
First Published: 2024-03-06
Last Modified: 2024-04-01
Americas Headquarters
Cisco Systems, Inc.
170 West Tasman Drive
San Jose, CA 95134-1706
USA
http://www.cisco.com
Tel: 408 526-4000
800 553-NETS (6387)
Fax: 408 527-0883
New and Changed Information
The following table provides an overview of the significant changes up to the current release. The table does not provide an exhaustive list of all changes or of the new features up to this release.
| Feature | Description | Release | Where Documented |
|---|---|---|---|
|
Onboard NX-OS sites without a controller |
Support for standalone NX-OS sites. |
6.4.1 |
|
|
View the active and susceptible bugs |
You can now view the active and susceptible bugs affecting your network after the Bug Scan is completed. |
6.4.1 |
This document is available from your Nexus Insights GUI as well as online at www.cisco.com. For the latest version of this document, visit Cisco Nexus Dashboard Insights Documentation.
Cisco Nexus Dashboard Insights Setup
Meet Nexus Dashboard Insights
Cisco Nexus Dashboard Insights (Nexus Dashboard Insights) is a single-pane-of-glass console that streamlines data center network operations and management.
Nexus Dashboard Insights consists of the following components:
-
Overview: Provides a bird’s-eye view of your global network infrastructure. If you’re new to Insights, quickly get started with Journey, which also provides you with updates and new features in the platform.
-
Topology: Visualize interconnectivity of switches in Nexus Dashboard Insights and their connected components, such as devices and endpoints.
-
-
Manage: Provides a deeper look into your network infrastructure and its operations.
-
Sites: Sites are on-premises network regions that consist of a group of switches and other networking devices that provide connectivity for your applications and endpoints.
-
Inventory: Displays information about your switches and controllers.
-
Rules: Enables you to manage your site’s anomalies and advisories configuration.
-
Software Management: Allows you to easily manage the software running on all your devices from a single place, install updates, and perform pre and post-update analysis.
-
-
Analyze: Allows you to go back in time and let analytics help you understand historical network patterns.
-
Anomalies: Allows you to proactively detect different types of anomalies across the network, analyze the anomalies, and identify remediation methods.
-
Advisories: Provides recommendations to keep your network under support and running in optimal conditions.
-
-
Analysis Hub: Enables you to analyze and troubleshoot your network with advanced analytics tools optimized for you to gain valuable insights into the performance and health of your network.
-
Sustainability: Explore your site’s energy usage, cost, and emissions.
-
Conformance: Keep track of your hardware and software life cycles.
-
Compliance: Monitor your fabric’s compliance with custom anomaly rules.
-
Connectivity Analysis: Analyze flows from one endpoint to another.
-
Delta Analysis: Compare configurations and differences in your sites between two points in time.
-
Pre-Change Analysis: View the potential impact of configuration changes.
-
Log Collector: Collect and analyze logs from you devices
-
Policy CAM: Monitor your network’s policies.
-
Traffic Analytics: Monitor your network’s latency, congestion, and drops.
-
Bug Scan: Learn more about active and potential bugs affecting your network.
-
-
Admin:
-
Integrations: Allows you to add integrations such as AppDynamics, vCenter, DNS, and Nexus Dashboard Orchestrator.
-
Configuration Import/Export: Enables you to import and export the configurations in Nexus Dashboard Insights.
-
Initial Setup
The following workflow will guide you through the configurations required for the initial setup. After you add a site, you can enable or configure the relevant features. You do not have to follow a sequential order to proceed with these tasks. You can perform or enable the tasks in any order.
-
Add Sites. See Add Sites. For prerequisites and guidelines see Sites.
-
Site Analysis. See Site Analysis.
-
Configure Flows. See Configure Flows.
-
Export Data. See Export Data.
-
System Status. See System Status.
Add Sites
You can add a site to Nexus Dashboard Insights using the following methods:
-
Online Sites
-
Enable the site that has already been added to Nexus Dashboard. Sites added to the Nexus Dashboard are not enabled in the services by default, so you will need to explicitly enable them directly from Nexus Dashboard Insights.
-
Add a site to Nexus Dashboard and then enable the site in a single workflow in Nexus Dashboard Insights.
-
-
Snapshot sites
-
Add a snapshot site.
-
Add an Online NDFC Site
-
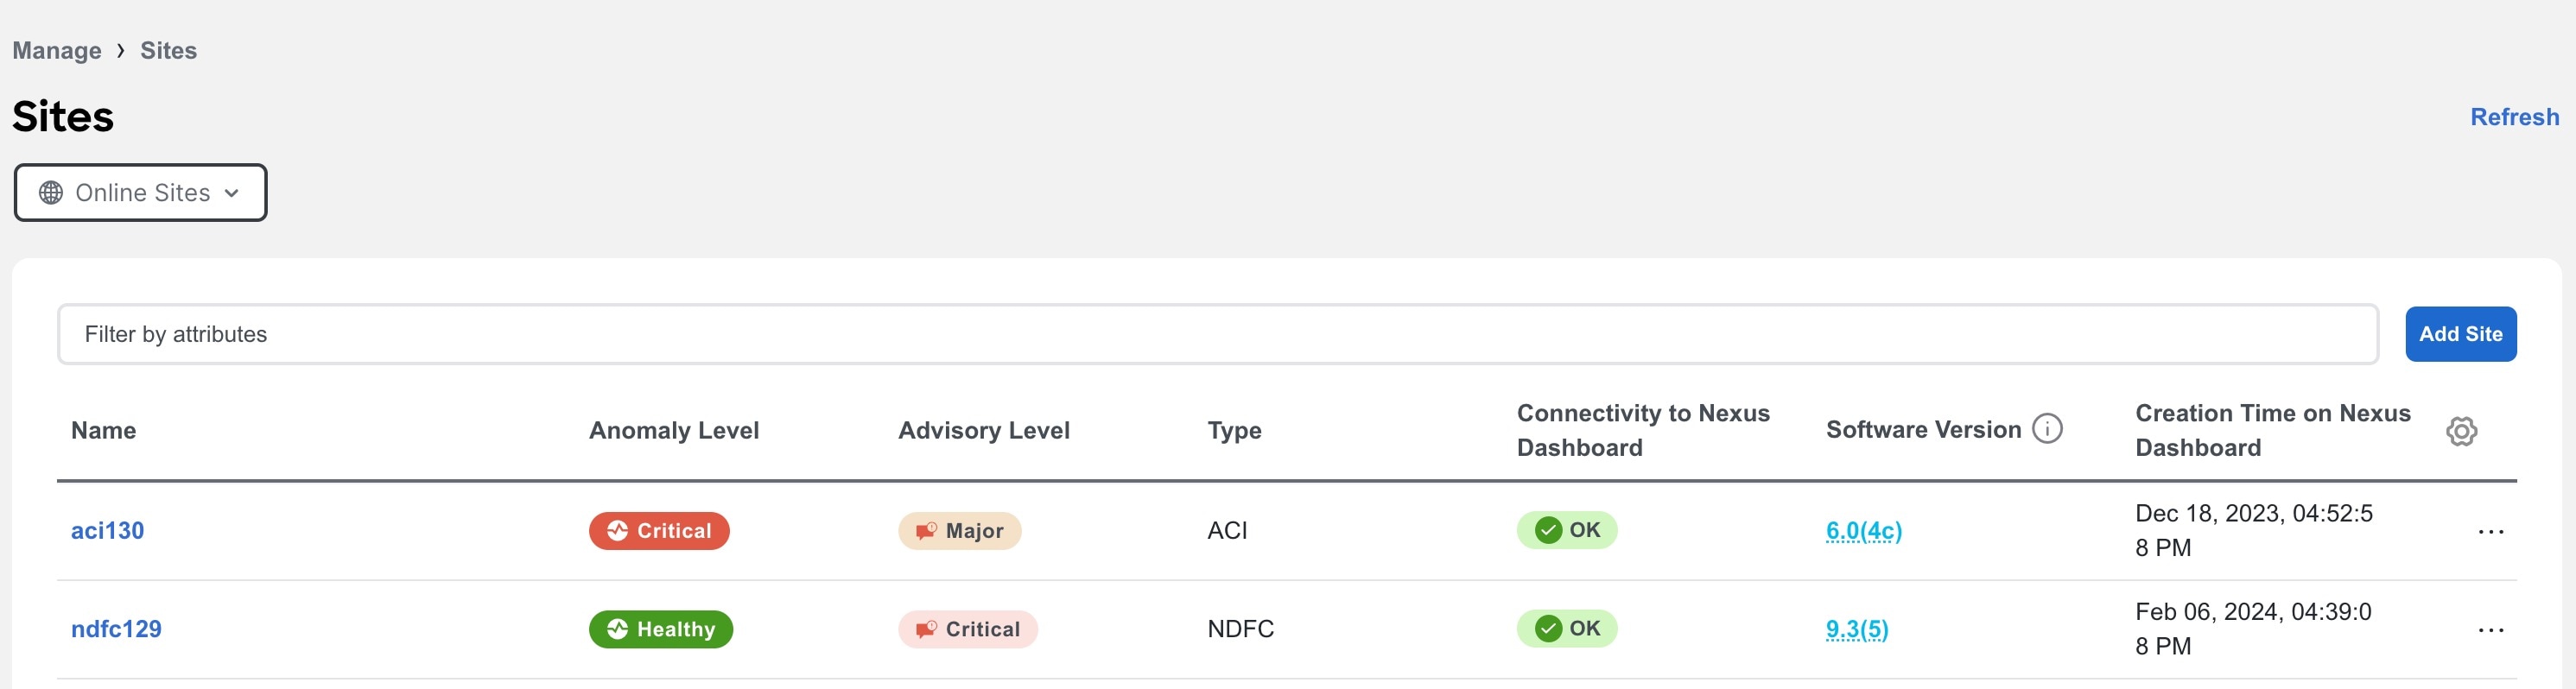
Navigate to Manage > Sites.
-
Click Add Site.
-
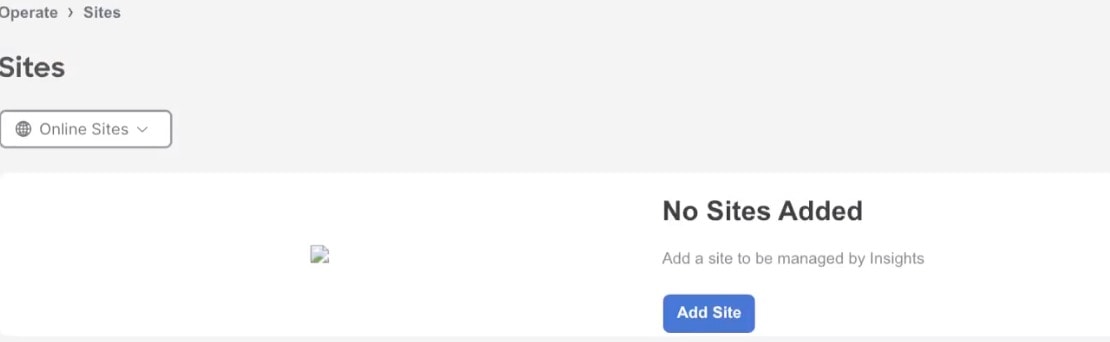
If you are adding a site in Nexus Dashboard Insights for the very first time, you will receive the following message. Click Add Site to proceed.
-
-
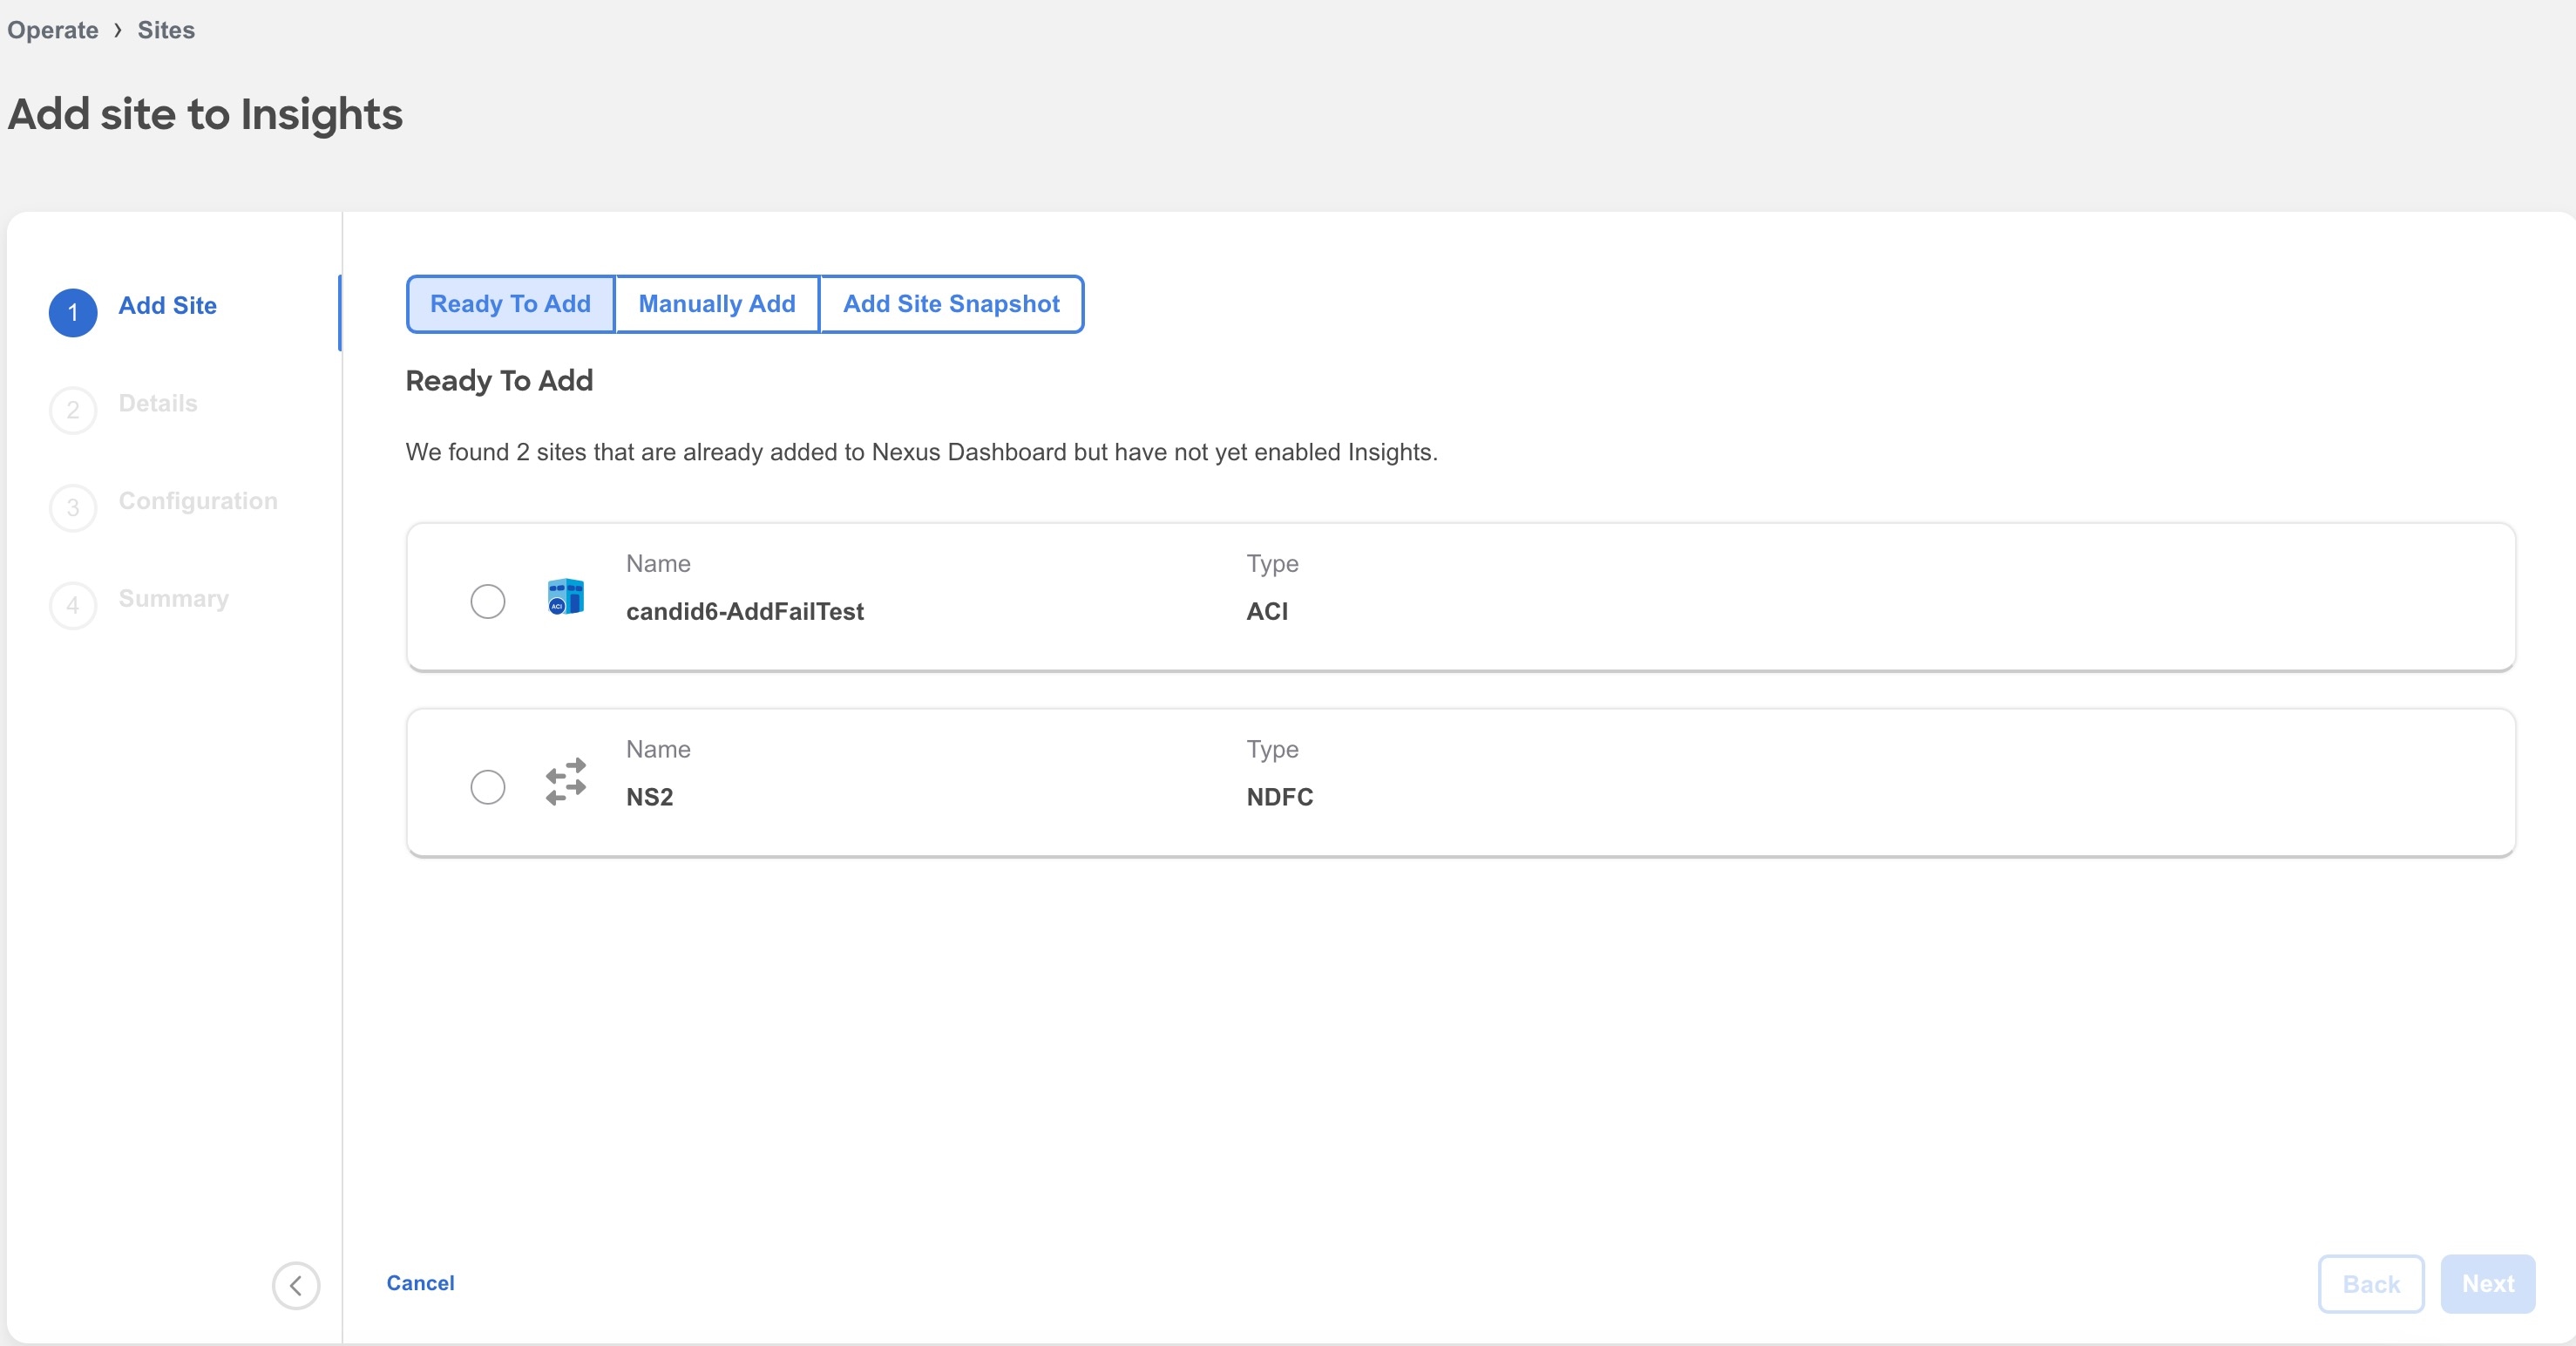
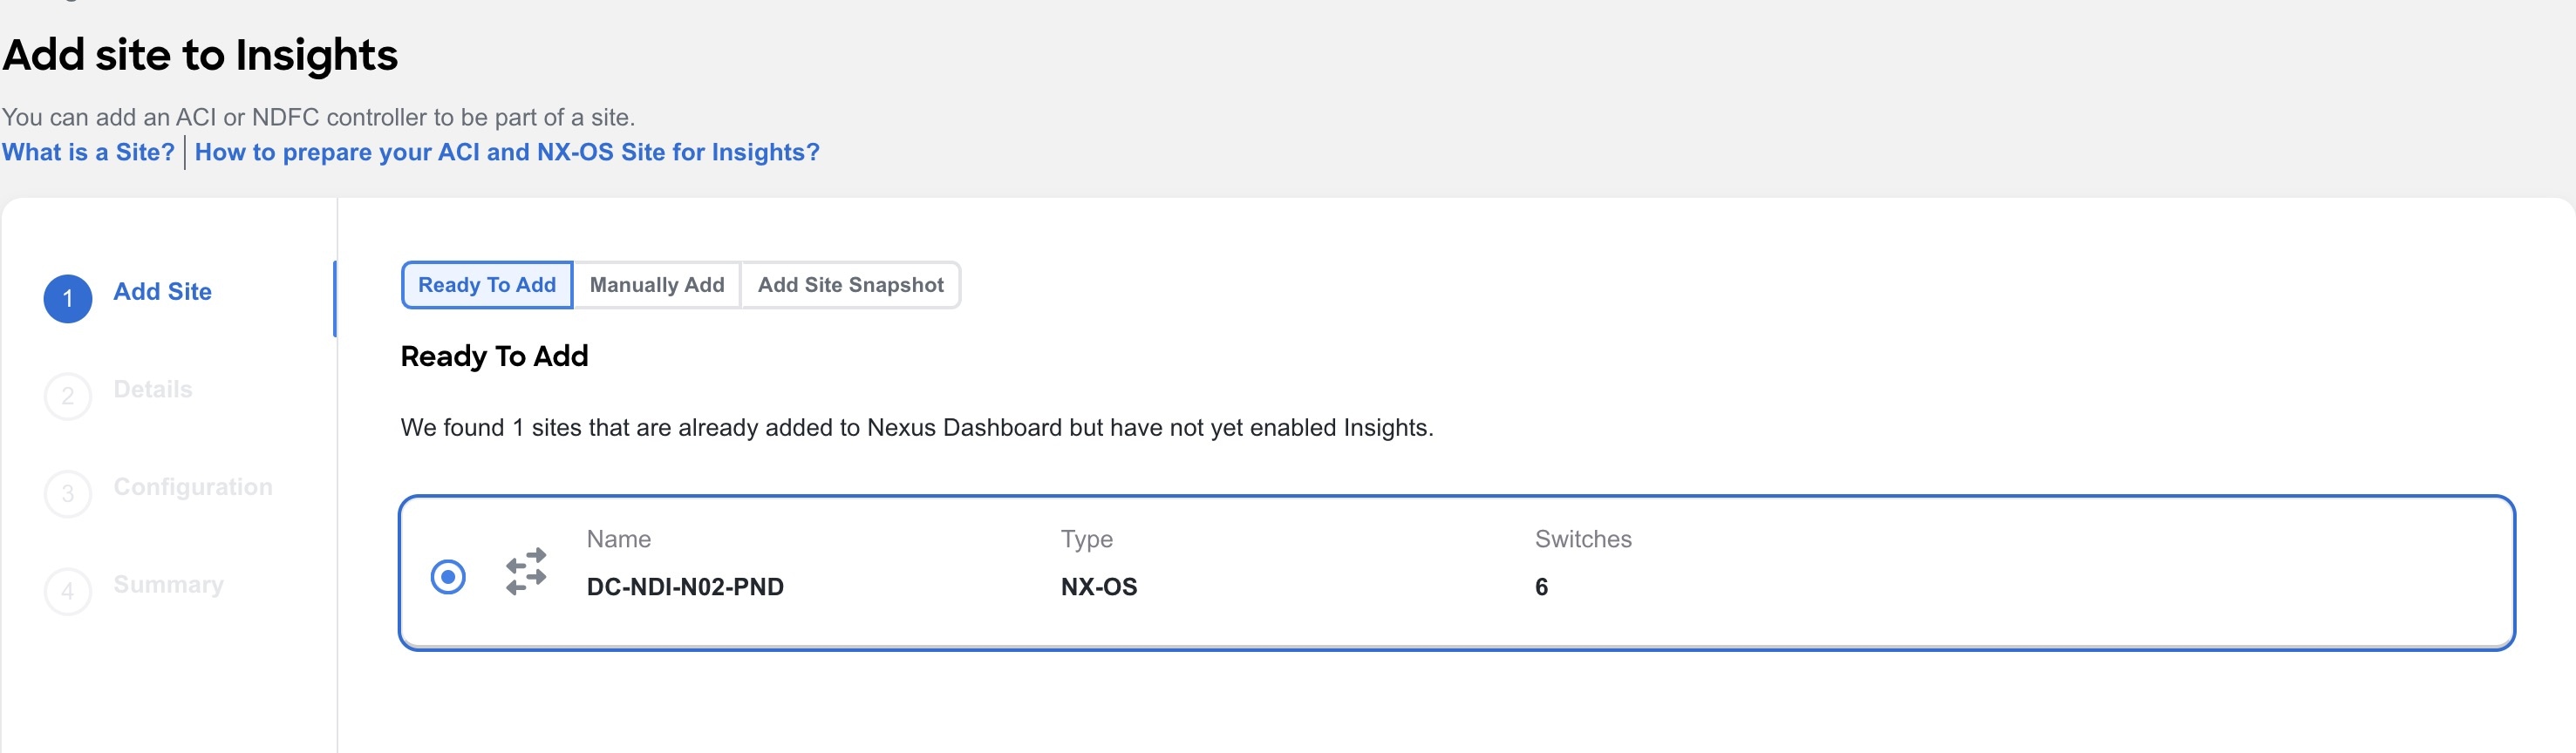
To enable a site that has been already added to Nexus Dashboard, select Ready to Add. The sites added to Nexus Dashboard are displayed. To add a site to Nexus Dashboard, see Cisco Nexus Dashboard Sites Management.
-
Complete the following fields for Ready to Add.
-
Select the site.
-
Click Next.
-
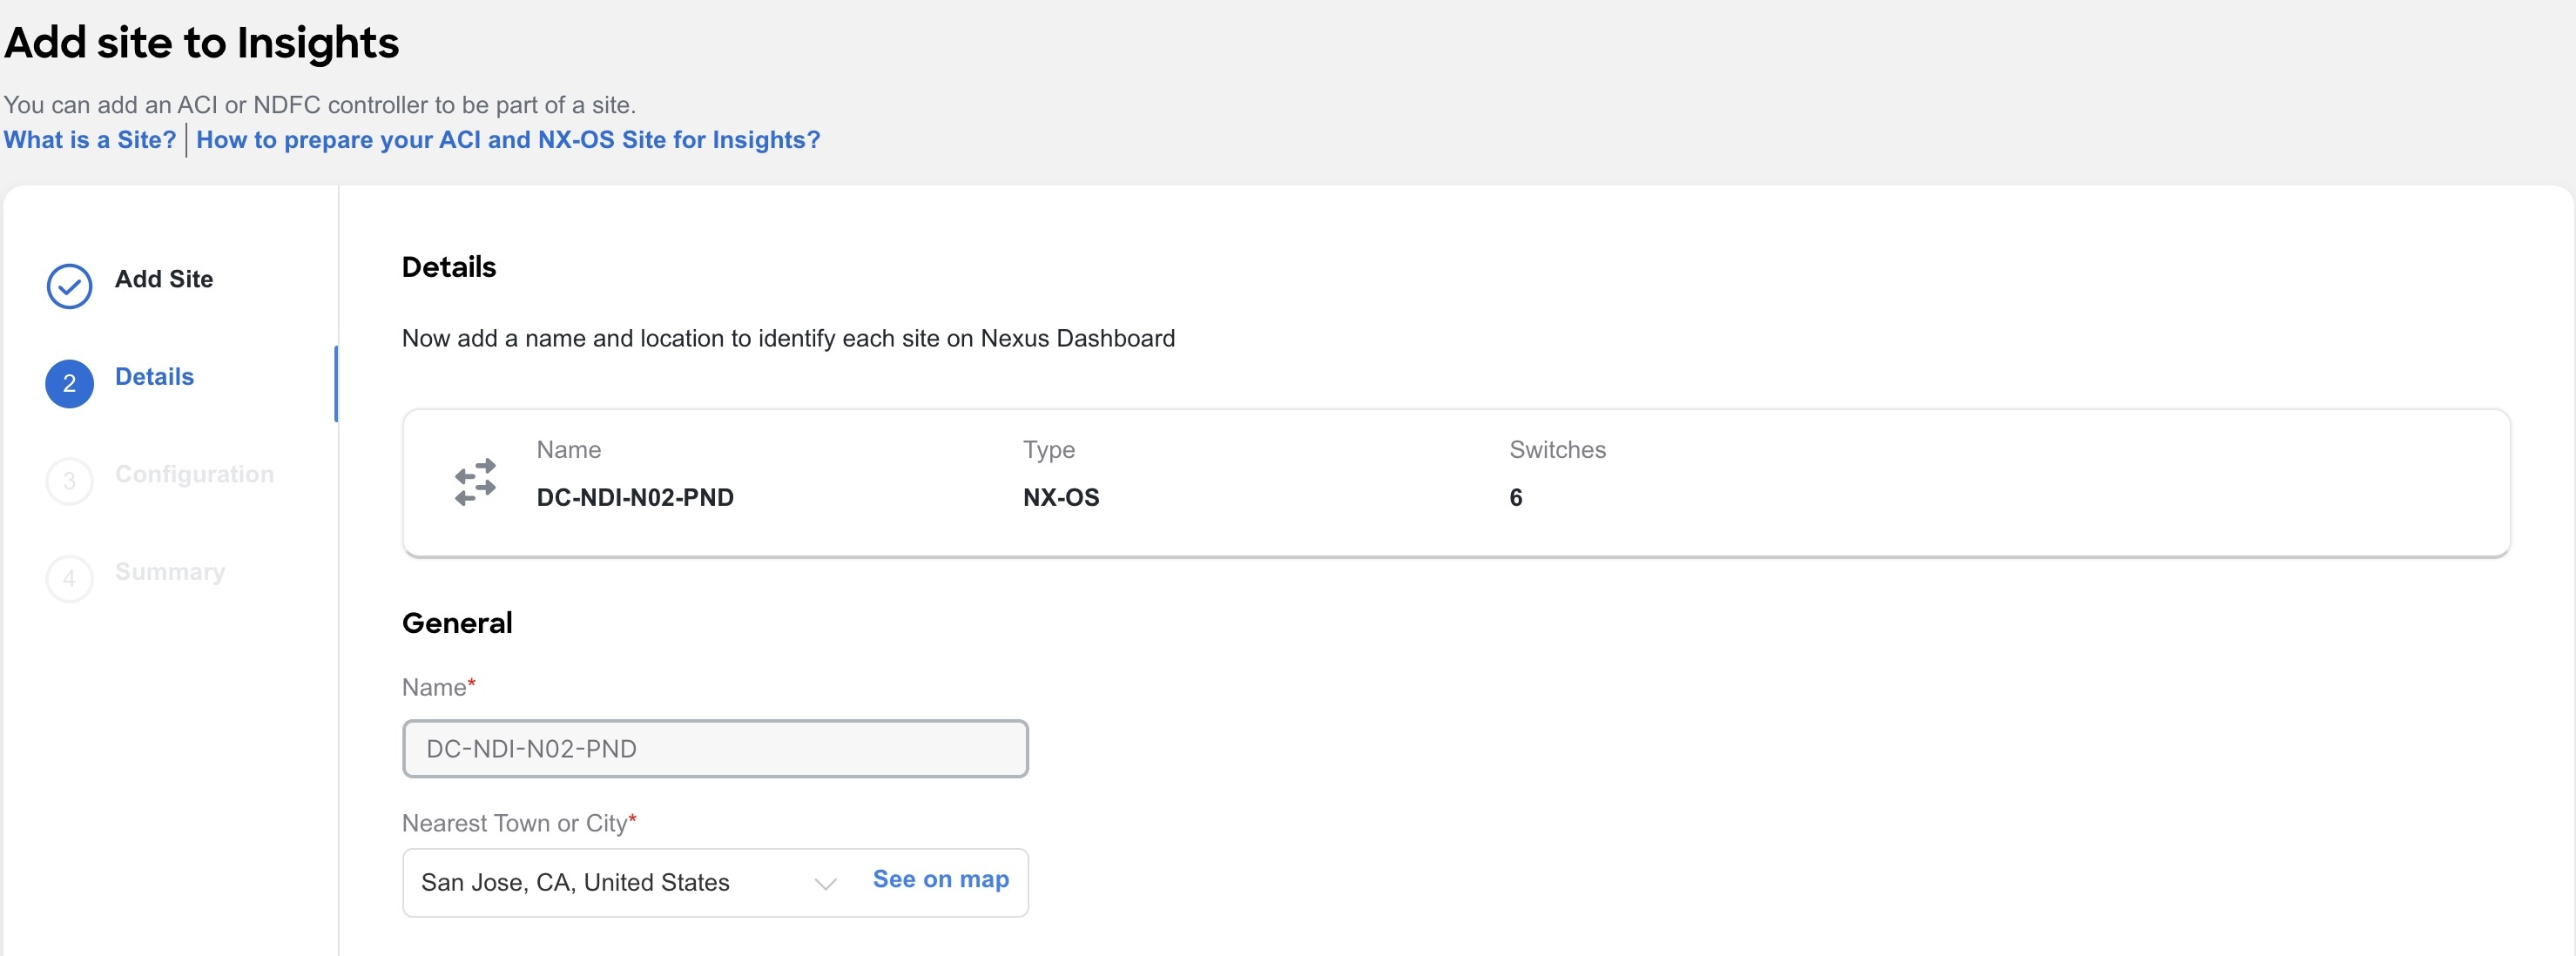
Select the site location from the map to identify the site on Nexus Dashboard.
-
Click Next.
-
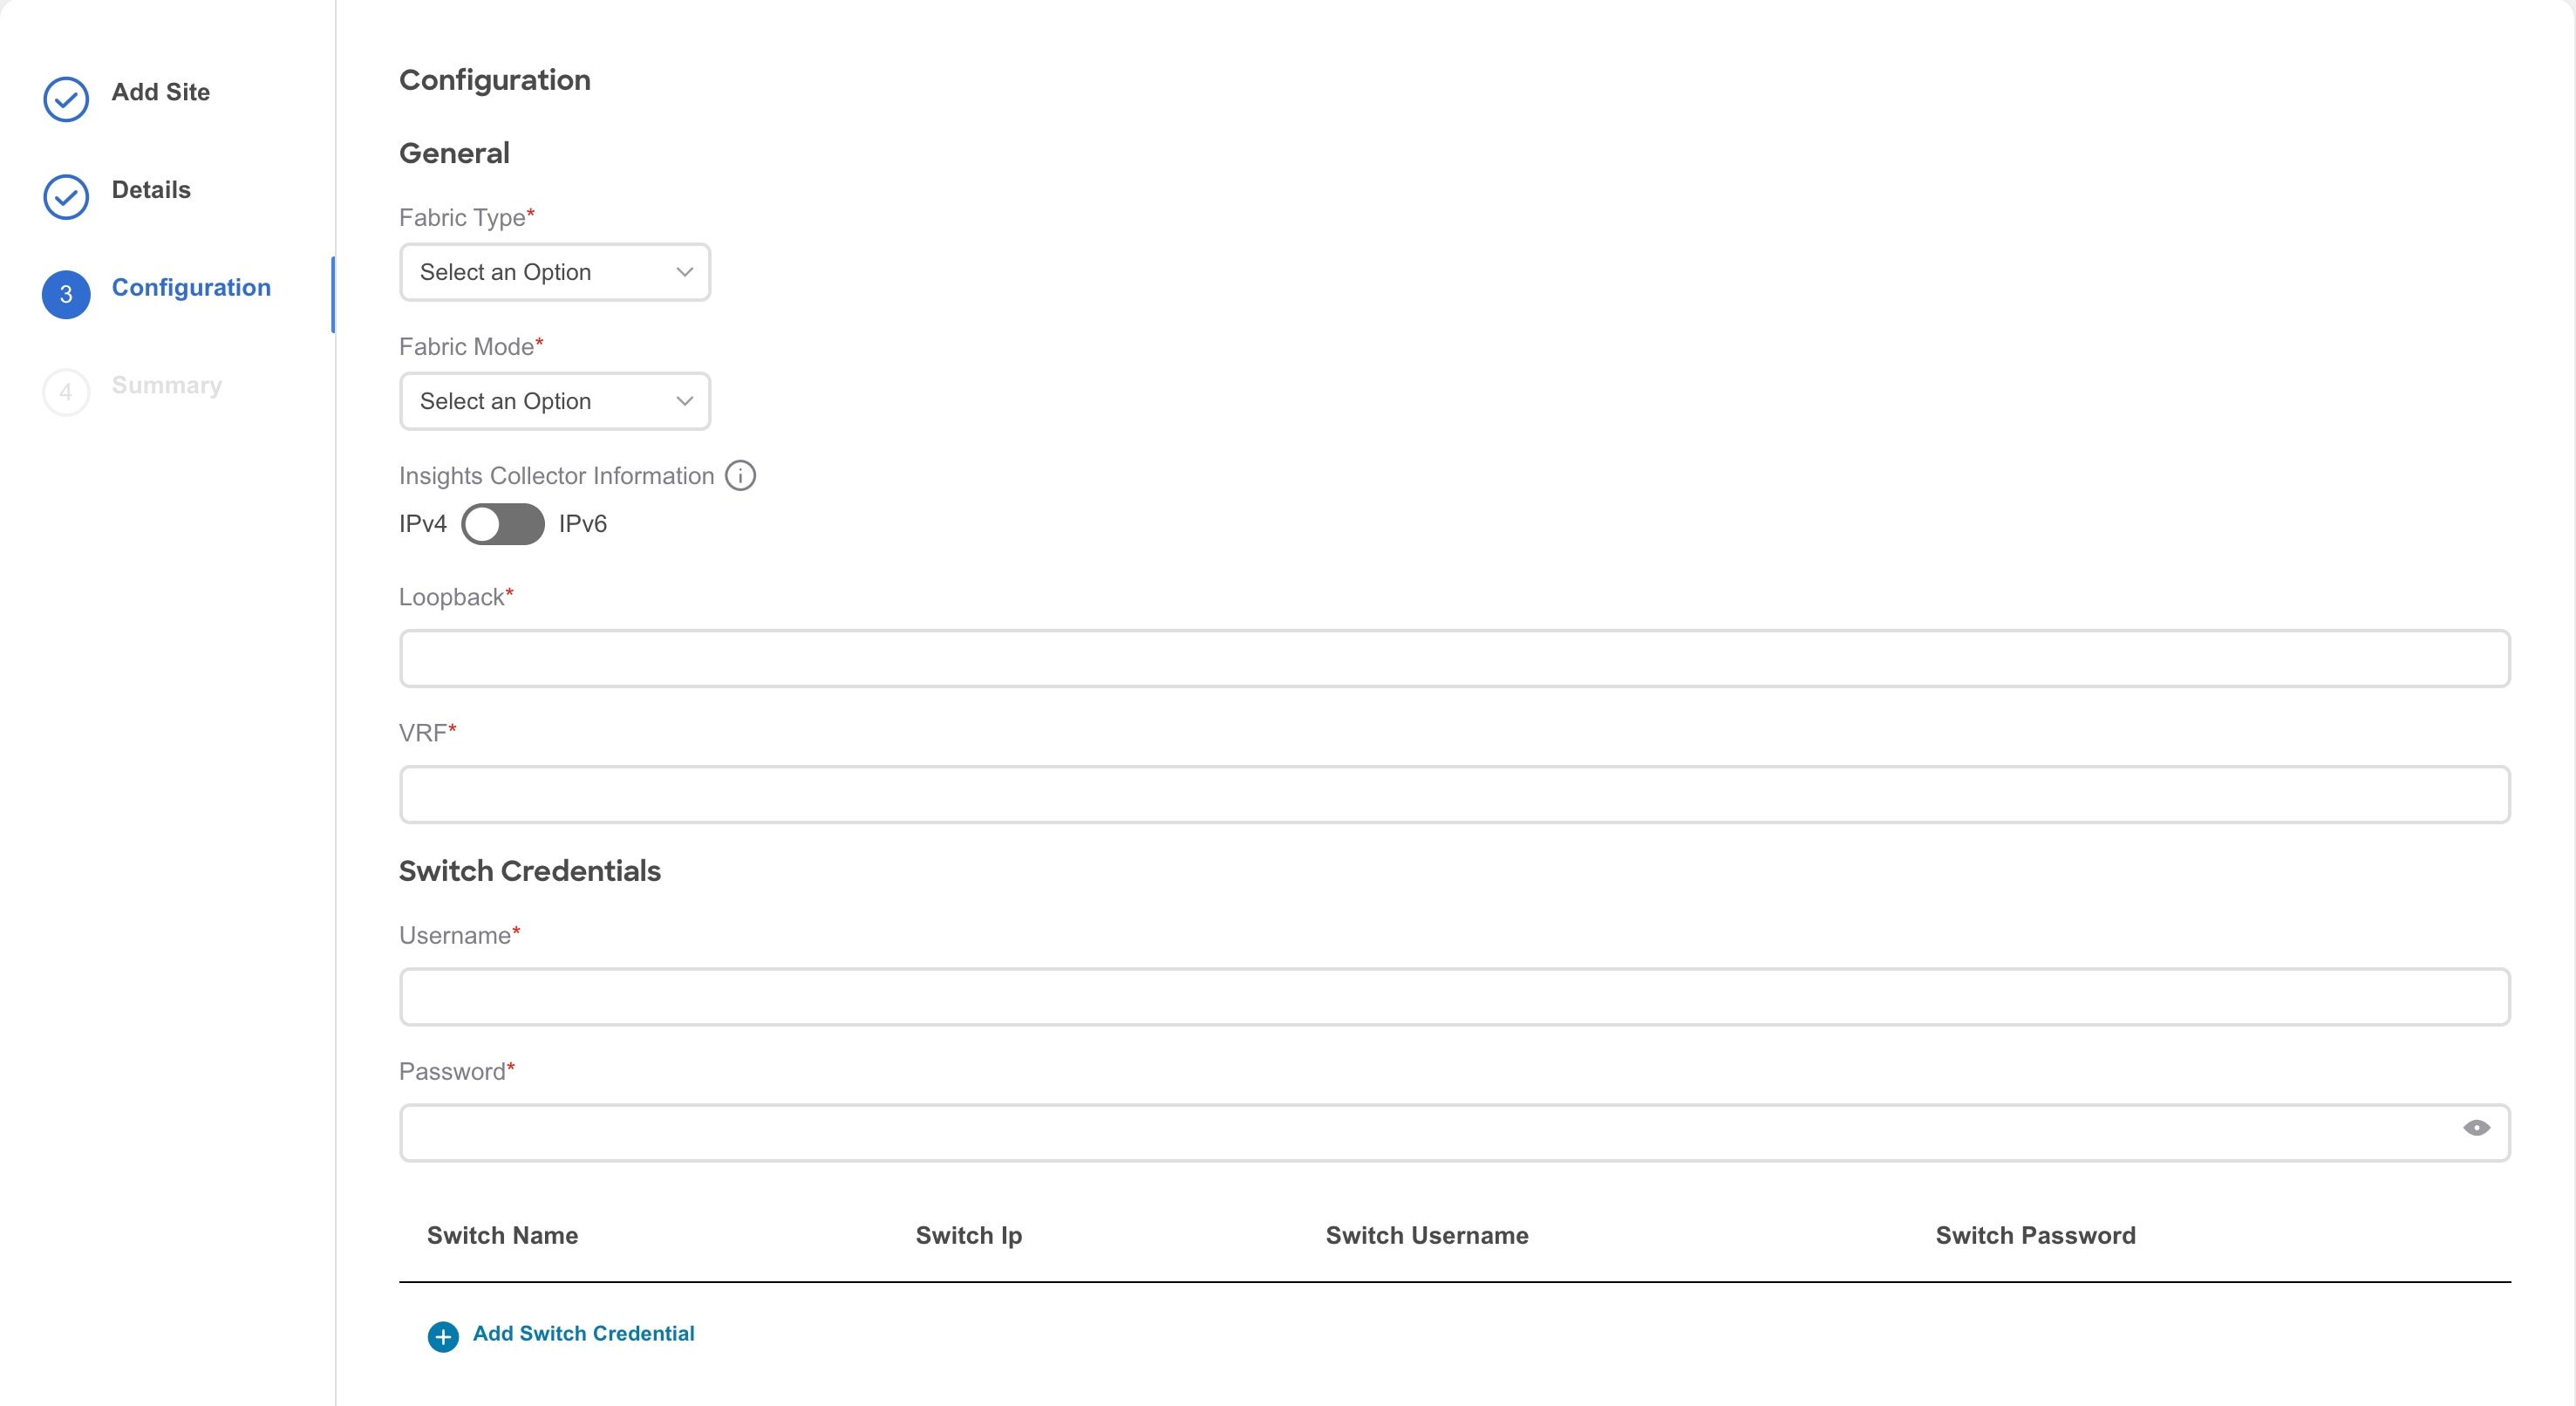
From the Fabric Type drop-down list, select the fabric type. The options are Classic, VXLAN or SR-MPLS. Choose SR-MPLS option to set up flows for SR-MPLS in a NX-OS fabric. Enhanced Classic LAN is not supported for NDFC sites.
-
From the Fabric Mode drop-down menu, select the fabric mode. The options are Managed or Monitored. In Managed mode, Nexus Dashboard Insights will deploy telemetry configuration to all switches in the fabric. In monitored mode, Nexus Dashboard Insights will not deploy telemetry configuration to all switches in the fabric.
-
Use toggle to select IPv4 or IPv6 to onboard the site. Based on this setting, Nexus Dashboard Insights will configure its collector to receive telemetry from this site. This setting should match your sites IP address configuration.
-
In the Loopback field, enter the loopback configured on the switches that provide connectivity to the Nexus Dashboard in-band IP address.
-
In the VRF field, enter the VRF name associated with the loopback interfaces. This is the VRF that provides connectivity to the Nexus Dashboard in-band IP addresses.

Default and non-default VRFs are supported. In VXLAN/EVPN fabrics they must be part of the underlay.
-
In the User Name and Password field for Switch Credentials, provide the login credentials for a LAN user with
adminprivileges on the switch you are adding. -
Click Add Switch Credentials to add switches to the list and specify their credentials only if the switch credentials do not match the default credentials provided above.
-
In the Switch Name field, enter the name for the switch.
-
In the Switch IP field, enter the IP address for the switch.
-
In the Switch Username field, enter the username for the switch.
-
In the Switch Password field, enter the password.
-
-
Check the check mark to complete to add your entries, and add additional switches as appropriate.
-
Click Next.
-
Verify the configuration.
-
Click Submit.
-
-
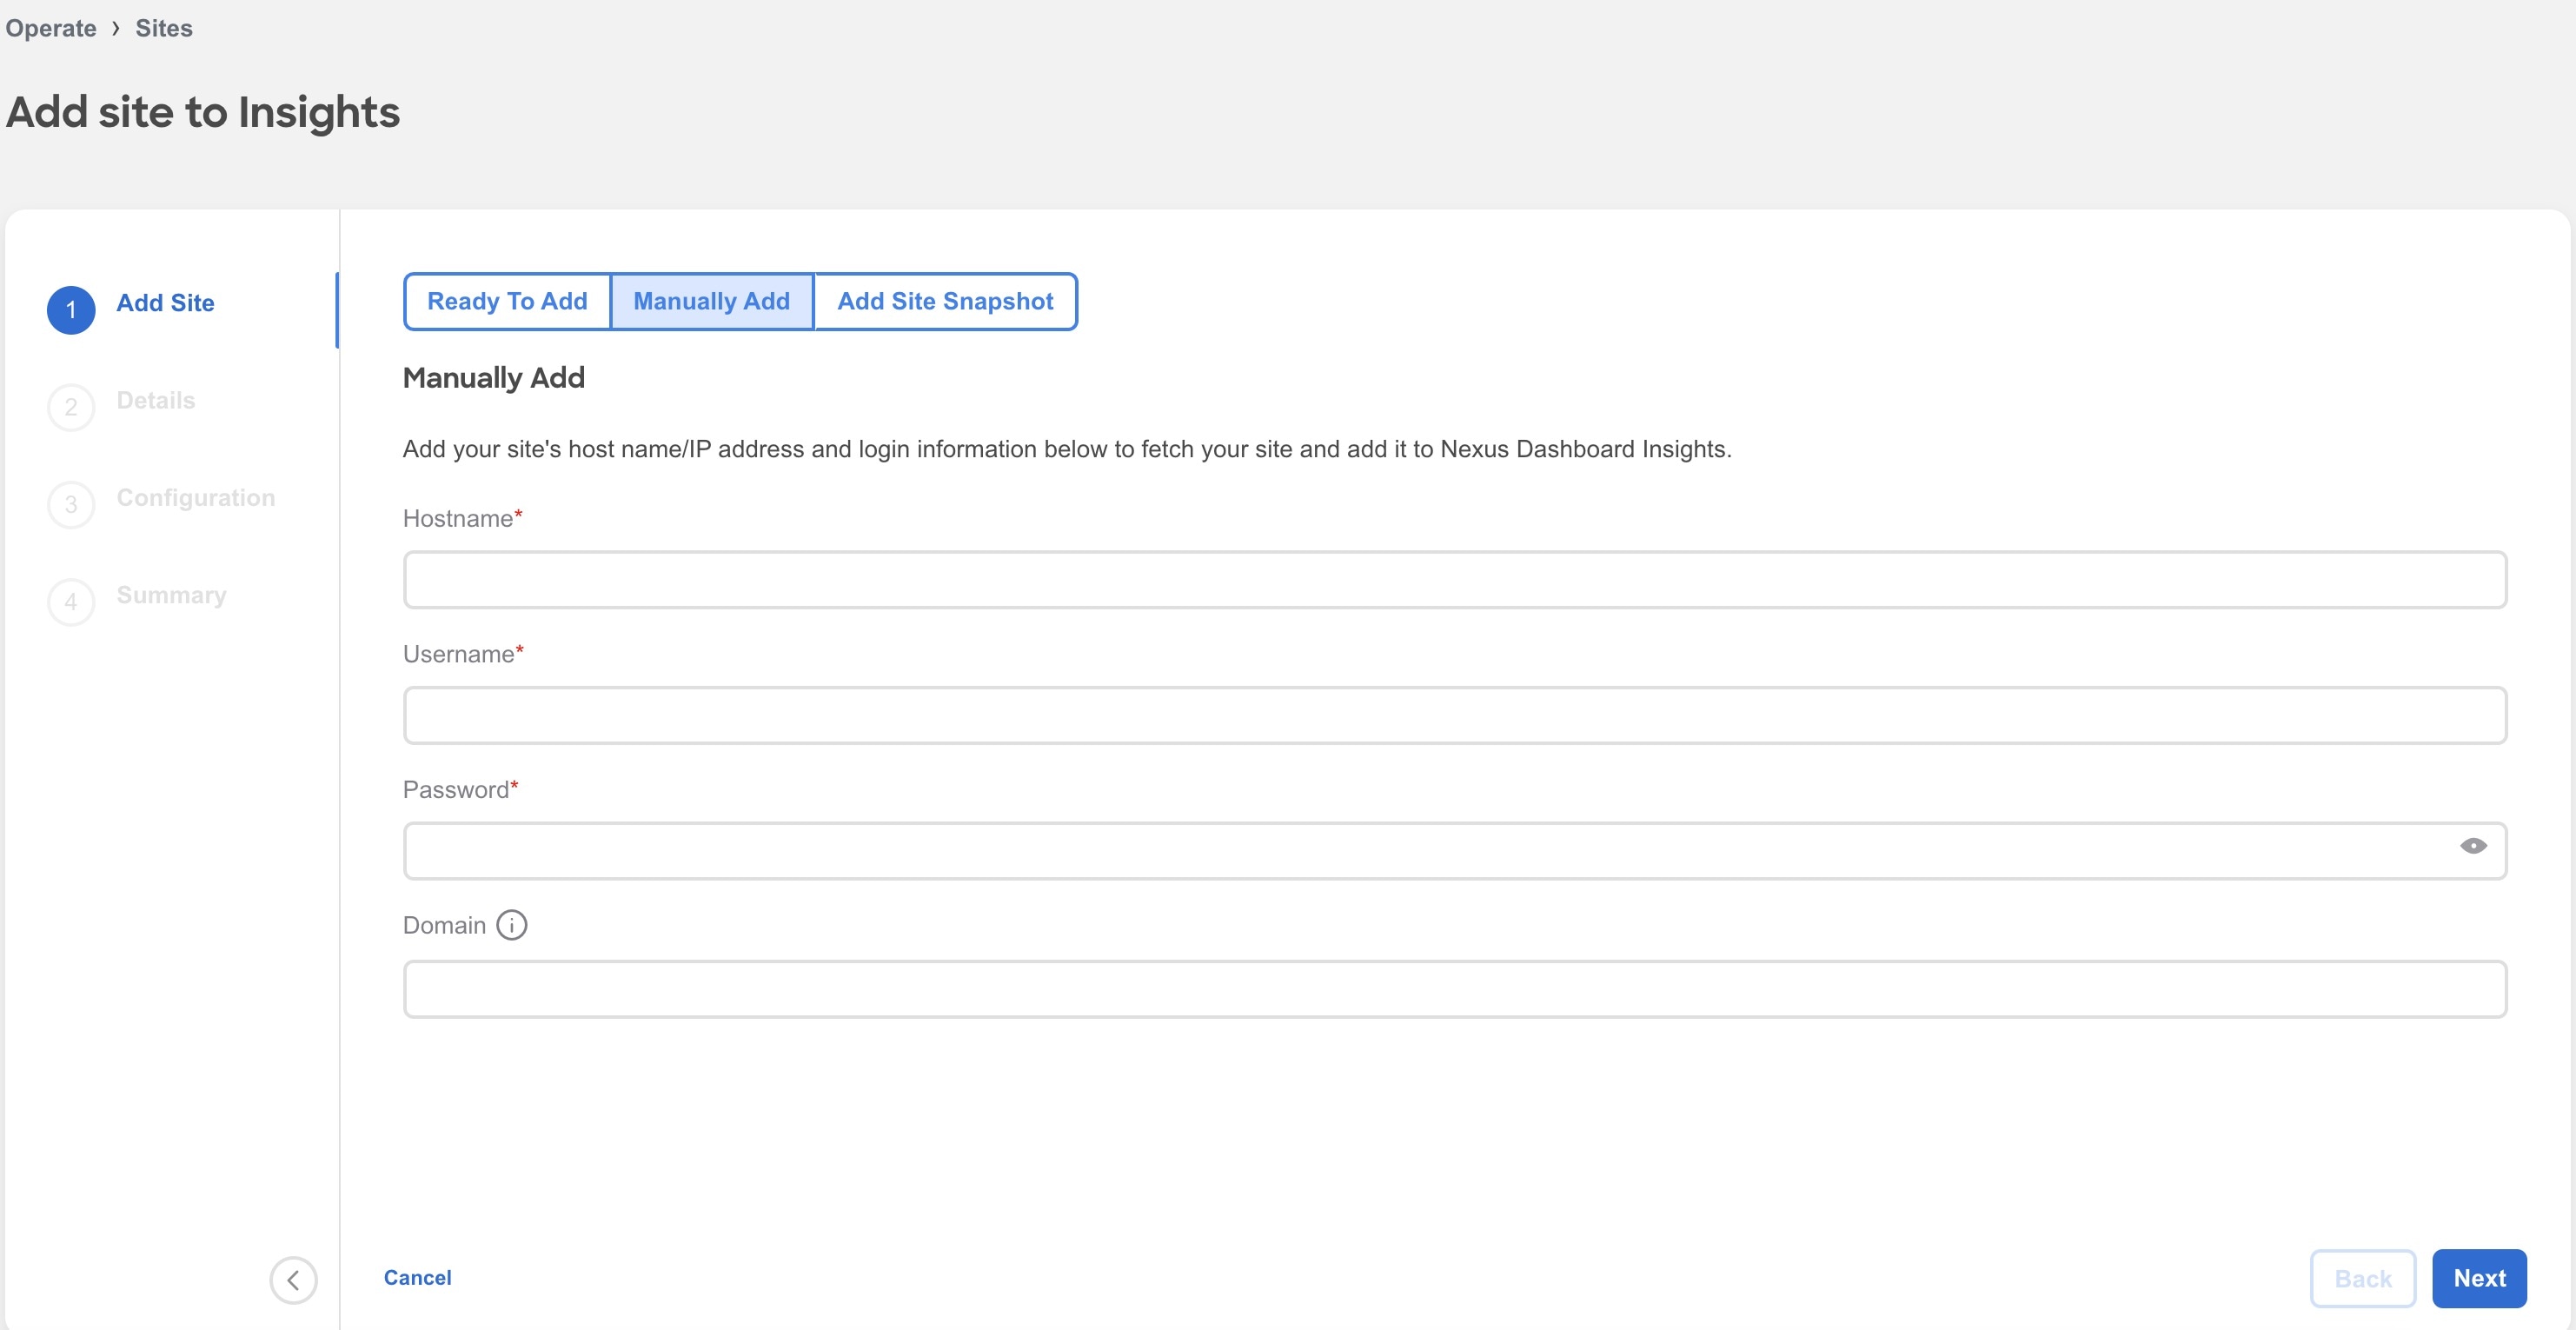
To add a site to Nexus Dashboard and then enable the site using Nexus Dashboard Insights, select Manually Add.
-
Complete the following fields for Manually Add.
-
In the Hostname field, enter the IP address used to communicate with the site’s controller.
-
In the User Name and Password field, provide the login credentials for a user with
adminprivileges for the controller you are adding. -
In the Domain field, enter the controller login domain name.
-
Click Next.
-
Enter the site name to identify the site on Nexus Dashboard.
-
Select the site location from the map to identify the site on Nexus Dashboard.
-
Click Next.
-
From the Fabric Type drop-down list, select the fabric type. The options are Classic, VXLAN or SR-MPLS. Choose SR-MPLS option to set up flows for SR-MPLS in a NX-OS fabric. Enhanced Classic LAN is not supported for NDFC sites.
-
From the Fabric Mode drop-down menu, select the fabric mode. The options are Managed or Monitored. In Managed mode, Nexus Dashboard Insights will deploy telemetry configuration to all switches in the fabric. In monitored mode, Nexus Dashboard Insights will not deploy telemetry configuration to all switches in the fabric.
-
Use toggle to select IPv4 or IPv6 to onboard the site. Based on this setting, Nexus Dashboard Insights will configure its collector to receive telemetry from this site. This setting should match your sites IP address configuration.
-
In the Loopback field, enter the loopback configured on the switches that provide connectivity to the Nexus Dashboard in-band IP address.
-
In the VRF field, enter the VRF name associated with the loopback interfaces. This is the VRF that provides connectivity to the Nexus Dashboard in-band IP addresses.
Default and non-default VRFs are supported. In VXLAN/EVPN fabrics they must be part of the underlay.
-
In the User Name and Password field for Switch Credentials, provide the login credentials for a LAN user with
adminprivileges on the switch you are adding. -
Click Add Switch Credentials to add switches to the list and specify their credentials only if the switch credentials do not match the default credentials provided above.
-
In the Switch Name field, enter the name for the switch.
-
In the Switch IP field, enter the IP address for the switch.
-
In the Switch Username field, enter the username for the switch.
-
In the Switch Password field, enter the password.
-
-
Check the check mark to complete to add your entries, and add additional switches as appropriate.
-
Click Next.
-
Verify the configuration.
-
Click Submit.
-
Add an Online NX-OS Site without a Controller
-
Navigate to Manage > Sites.
-
Click Add Site.
-
If you are adding a site in Nexus Dashboard Insights for the very first time, you will receive the following message. Click Add Site to proceed.
-
-
To enable a site that has been already added to Nexus Dashboard, select Ready to Add. The sites added to Nexus Dashboard are displayed. To add a site to Nexus Dashboard, see Cisco Nexus Dashboard Sites Management.
-
Complete the following fields for Ready to Add.
-
Select the NX-OS site.
-
Click Next.
-
Select the site location from the map to identify the site on Nexus Dashboard.
-
Click Next.
-
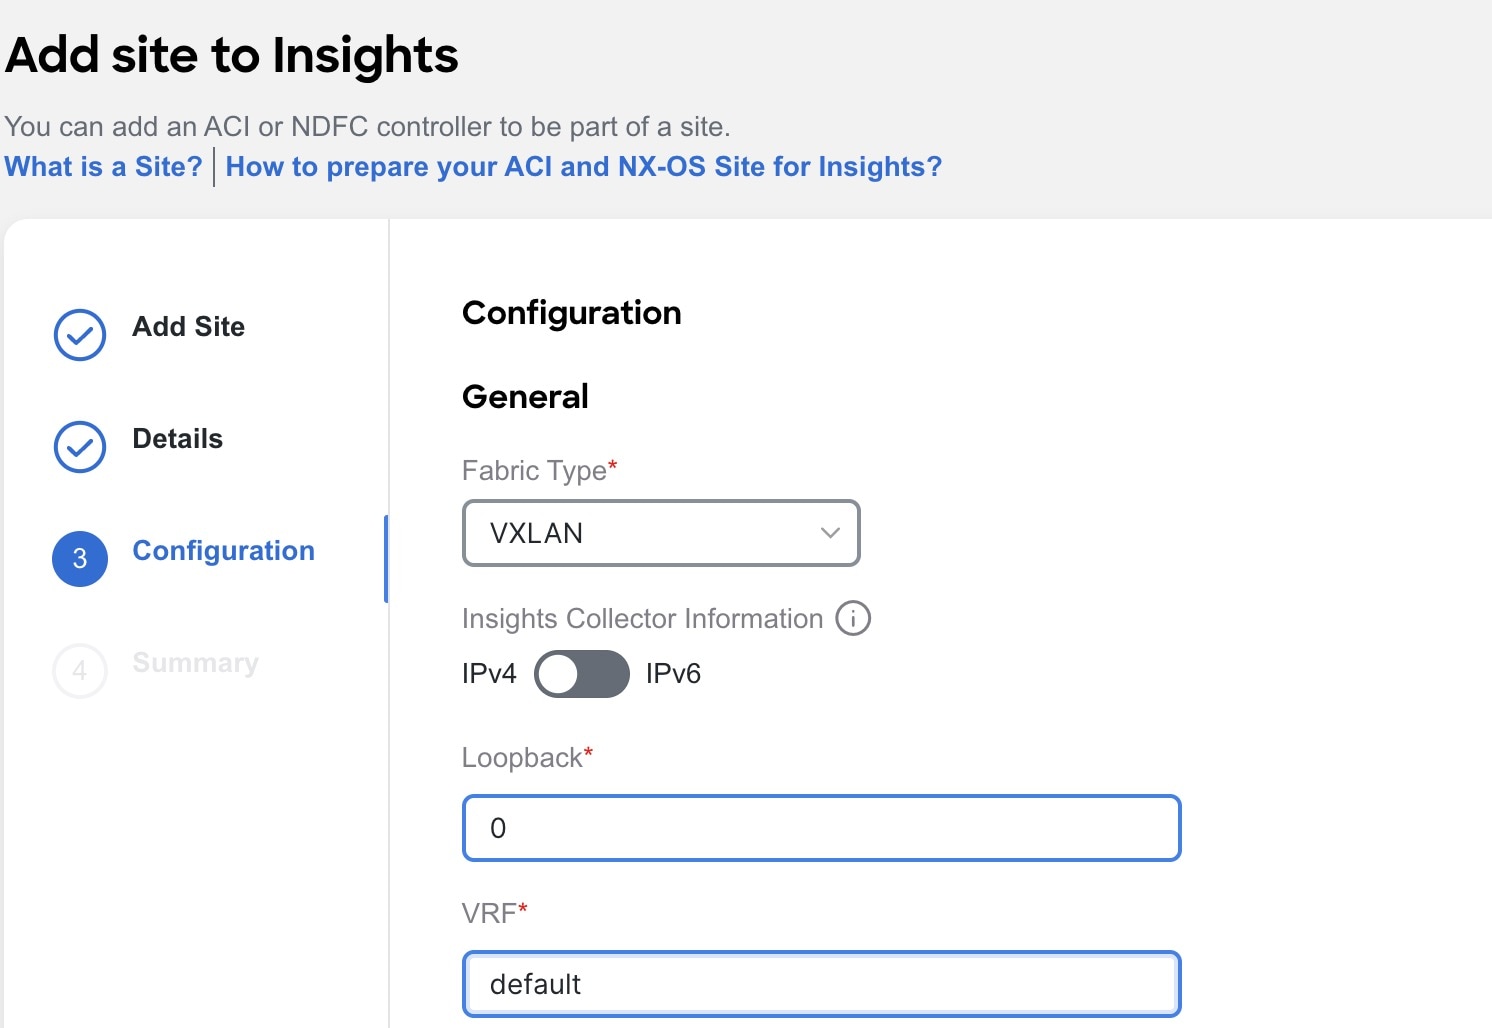
From the Fabric Type drop-down menu, select the fabric type. The options are Classic, VXLAN or SR-MPLS. Choose SR-MPLS option to set up flows for SR-MPLS in a NX-OS fabric.
-
Use toggle to select IPv4 or IPv6 to onboard the site. Based on this setting, Nexus Dashboard Insights will configure its collector to receive telemetry from this site. This setting should match your sites IP address configuration.
-
In the Loopback field, enter the loopback configured on the switches that provide connectivity to the Nexus Dashboard in-band IP address.
-
In the VRF field, enter the VRF name associated with the loopback interfaces. This is the VRF that provides connectivity to the Nexus Dashboard in-band IP addresses.
Default and non-default VRFs are supported. In VXLAN/EVPN fabrics they must be part of the underlay.
-
Click Next.
-
Verify the configuration.
-
Click Submit.
-
-
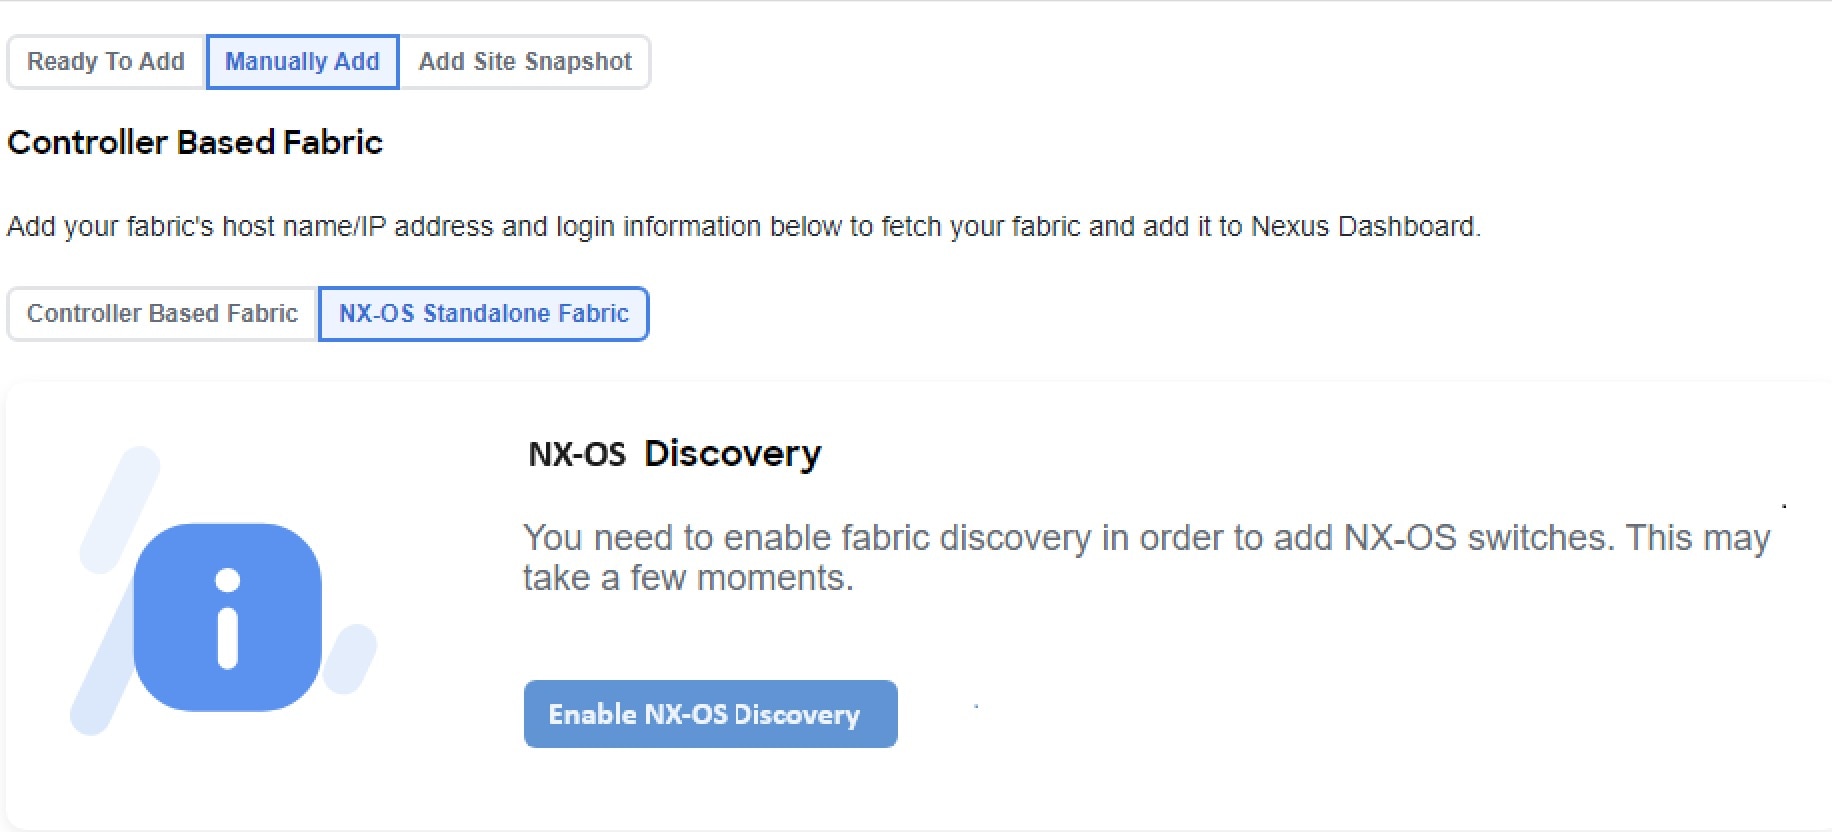
To add a site to Nexus Dashboard and then enable the site using Nexus Dashboard Insights, select Manually Add.
-
Complete the following fields for Manually Add.
-
Select NX-OS Standalone Fabric.
-
Click Enable NX-OS Discovery to enable NX-OS Discovery in Nexus Dashboard.

-
In the Seed Switch IP Address field, enter the IP address of the seed switch management interface.
-
In the User Name and Password field, provide the login credentials for a user with
adminprivileges on the switch you are adding. -
From the Authentication Protocol drop-down list, select the protocol.
-
Click Next.
-
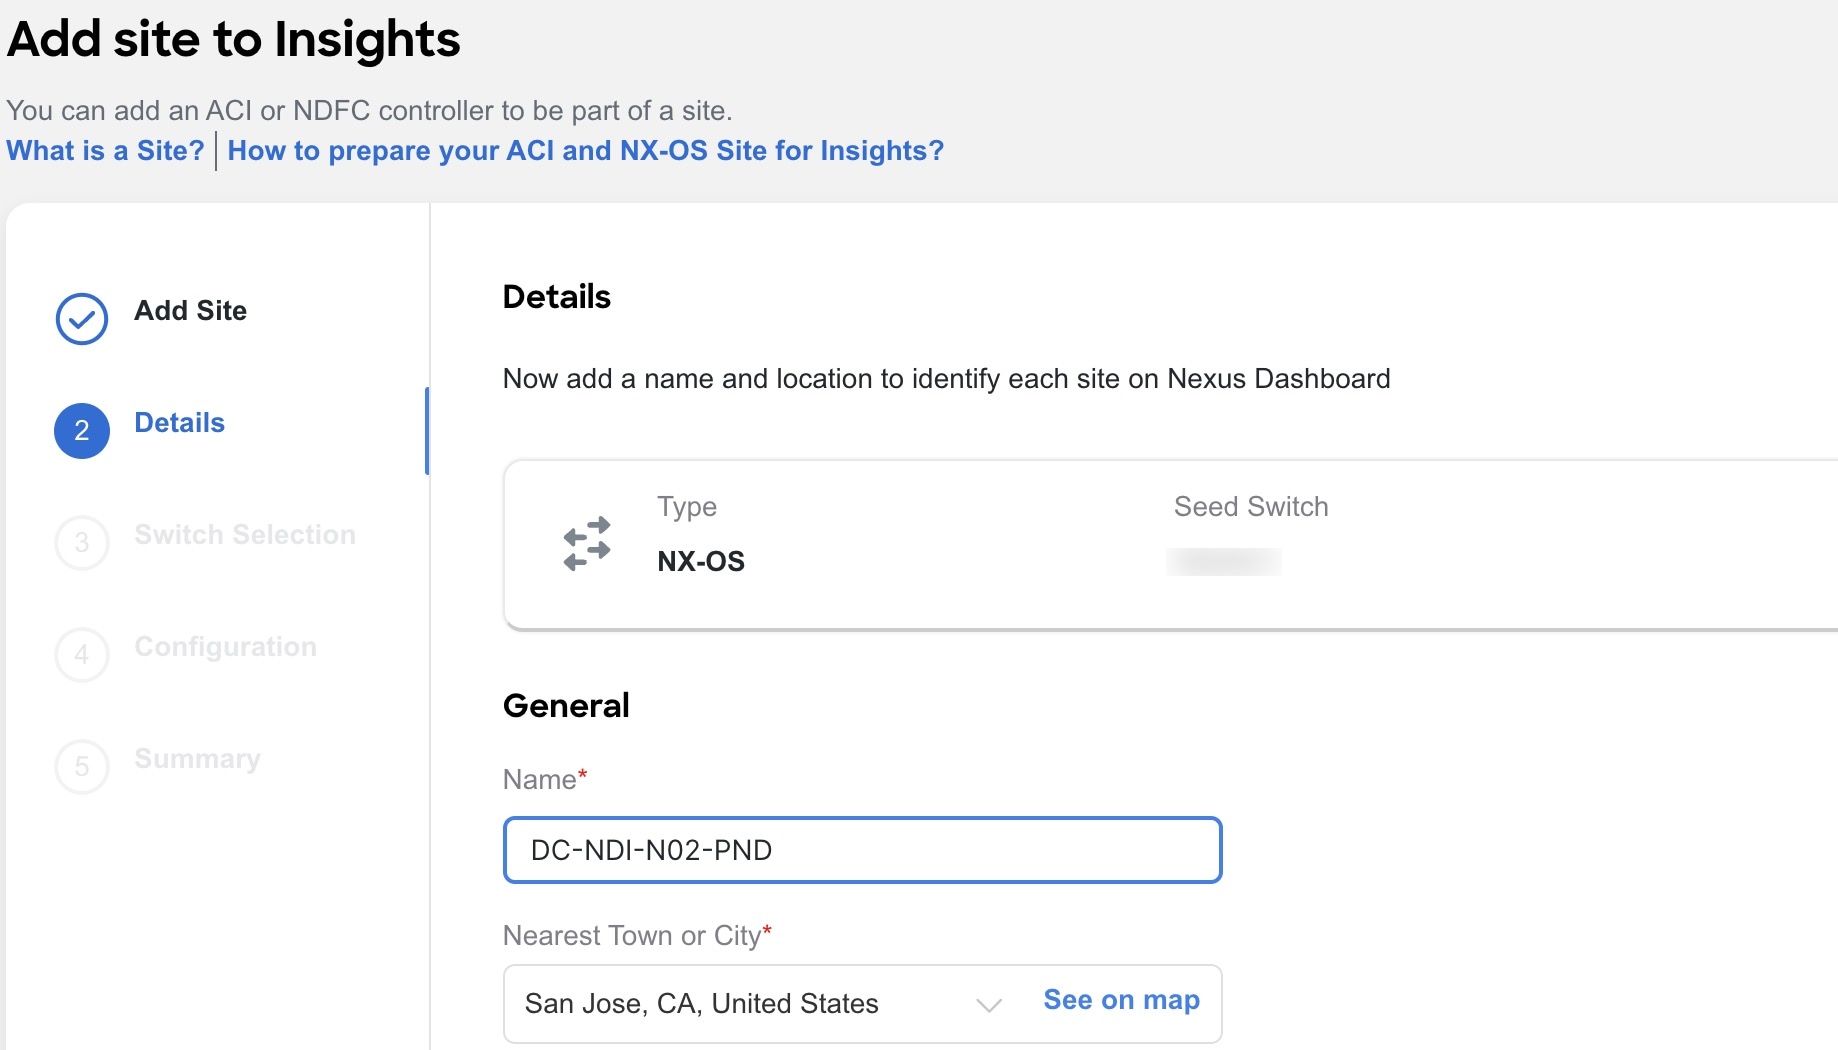
Enter the NX-OS site name to identify the site on Nexus Dashboard.
-
Select the NX-OS site location from the map to identify the site on Nexus Dashboard.
-
Select the switches to be added to the site.
-
Click Next.
-
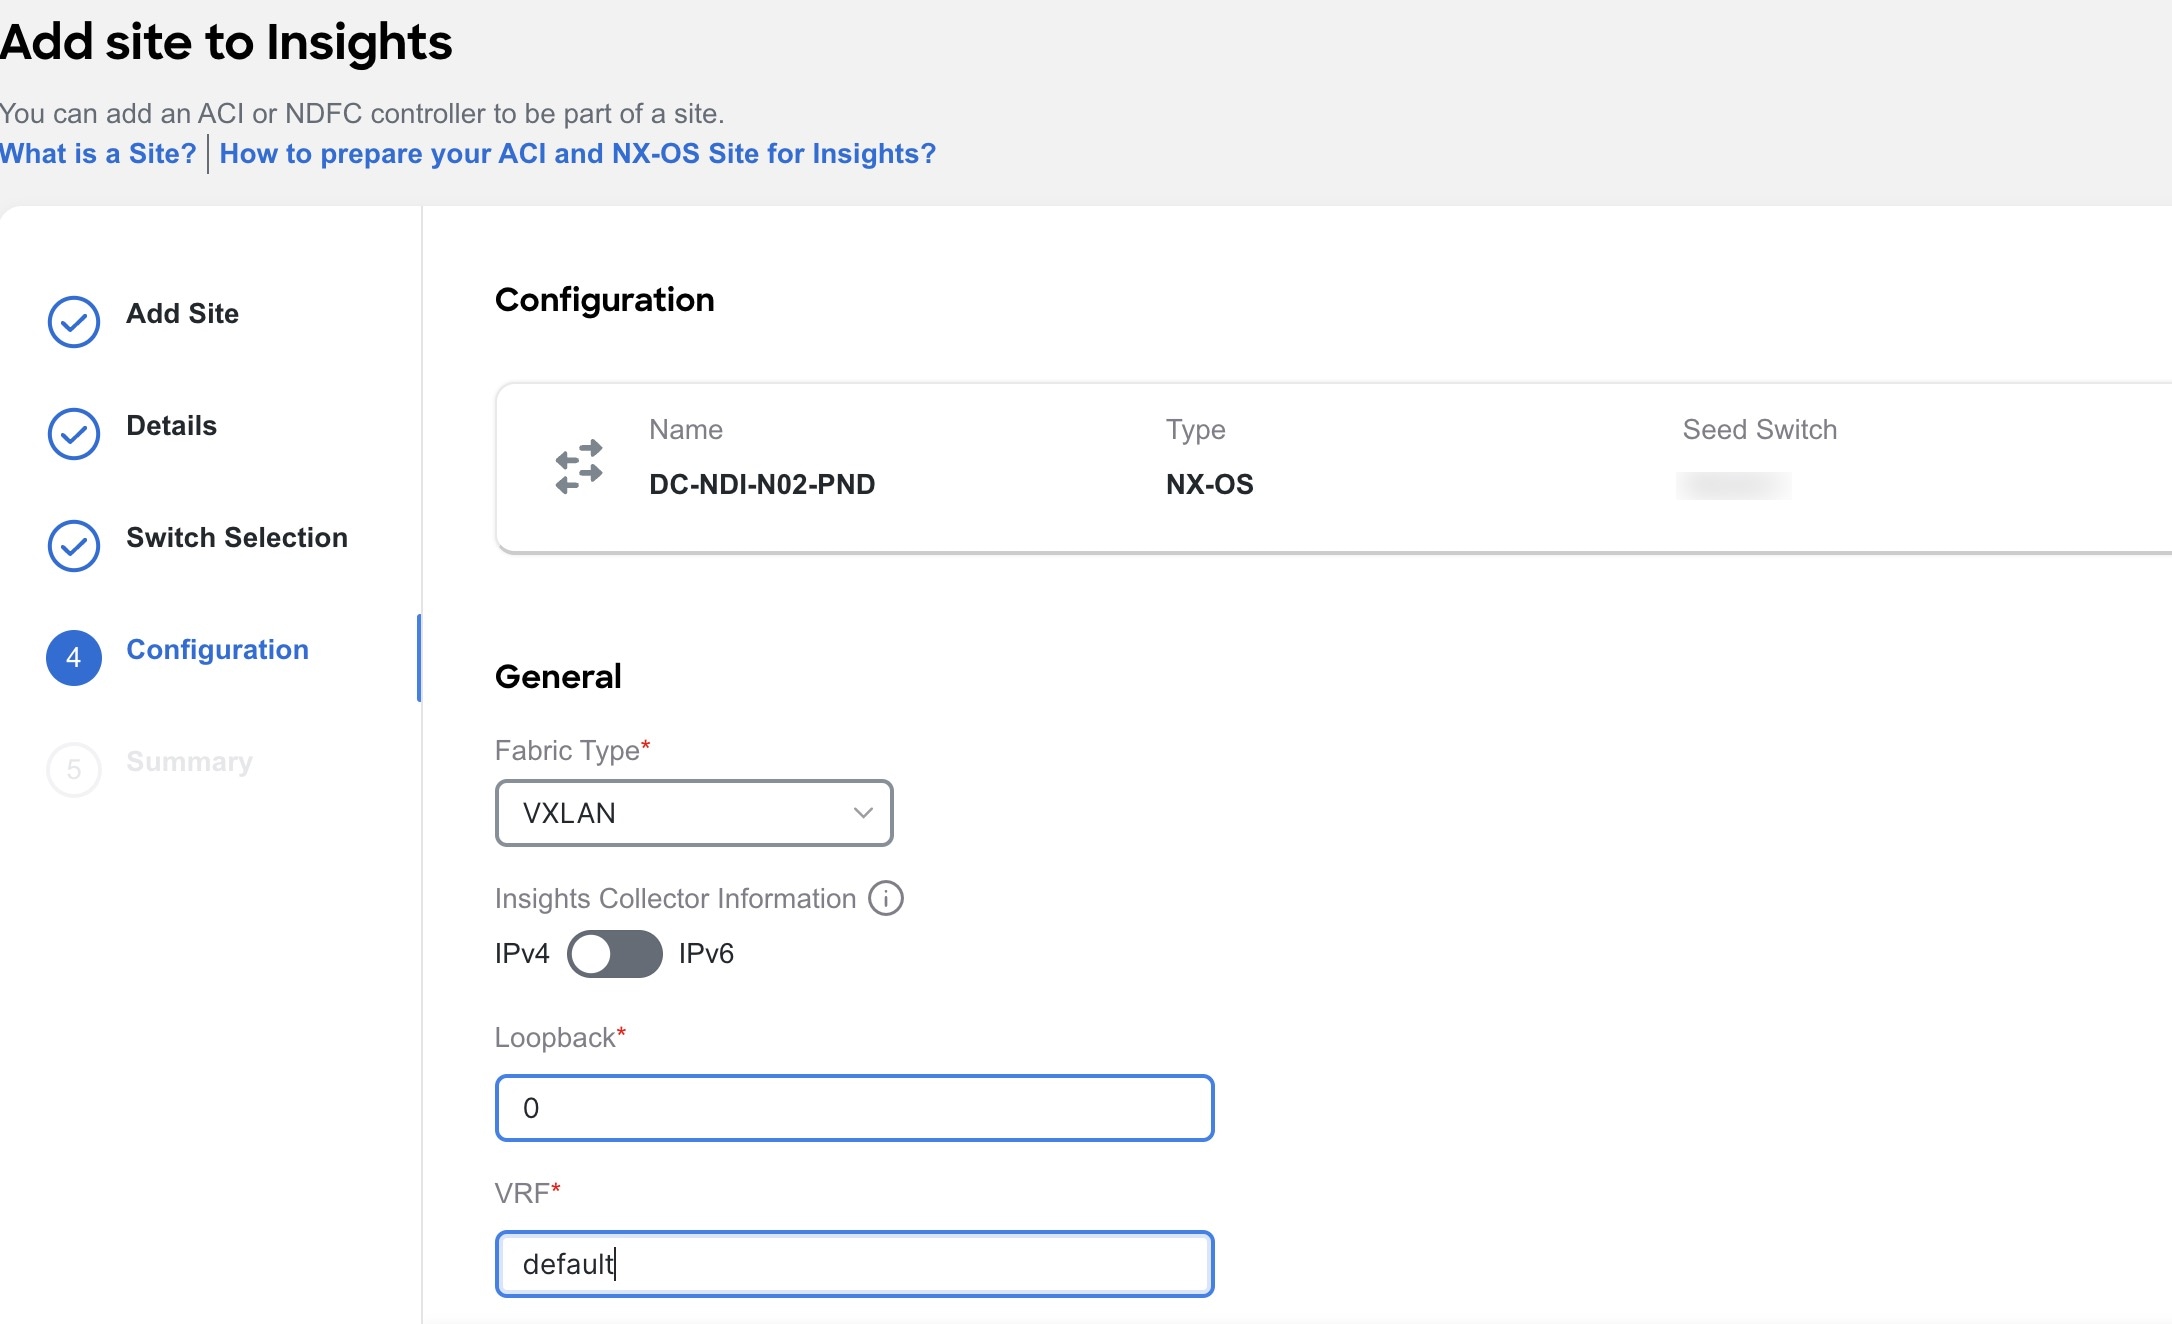
From the Fabric Type drop-down menu, select the fabric type. The options are Classic, VXLAN or SR-MPLS. Choose SR-MPLS option to set up flows for SR-MPLS in a NX-OS fabric.
-
Use toggle to select IPv4 or IPv6 to onboard the site. Based on this setting, Nexus Dashboard Insights will configure its collector to receive telemetry from this site. This setting should match your sites IP address configuration.
-
In the Loopback field, enter the loopback configured on the switches that provide connectivity to the Nexus Dashboard in-band IP address.
-
In the VRF field, enter the VRF name associated with the loopback interfaces. This is the VRF that provides connectivity to the Nexus Dashboard in-band IP addresses.
Default and non-default VRFs are supported. In VXLAN/EVPN fabrics they must be part of the underlay.
-
Click Next.
-
Verify the configuration.
-
Click Submit.
-
Add a Snapshot Site
-
Navigate to Manage > Sites.
-
Click Add Site.
-
To add a snapshot site, select Add Site Snapshot.
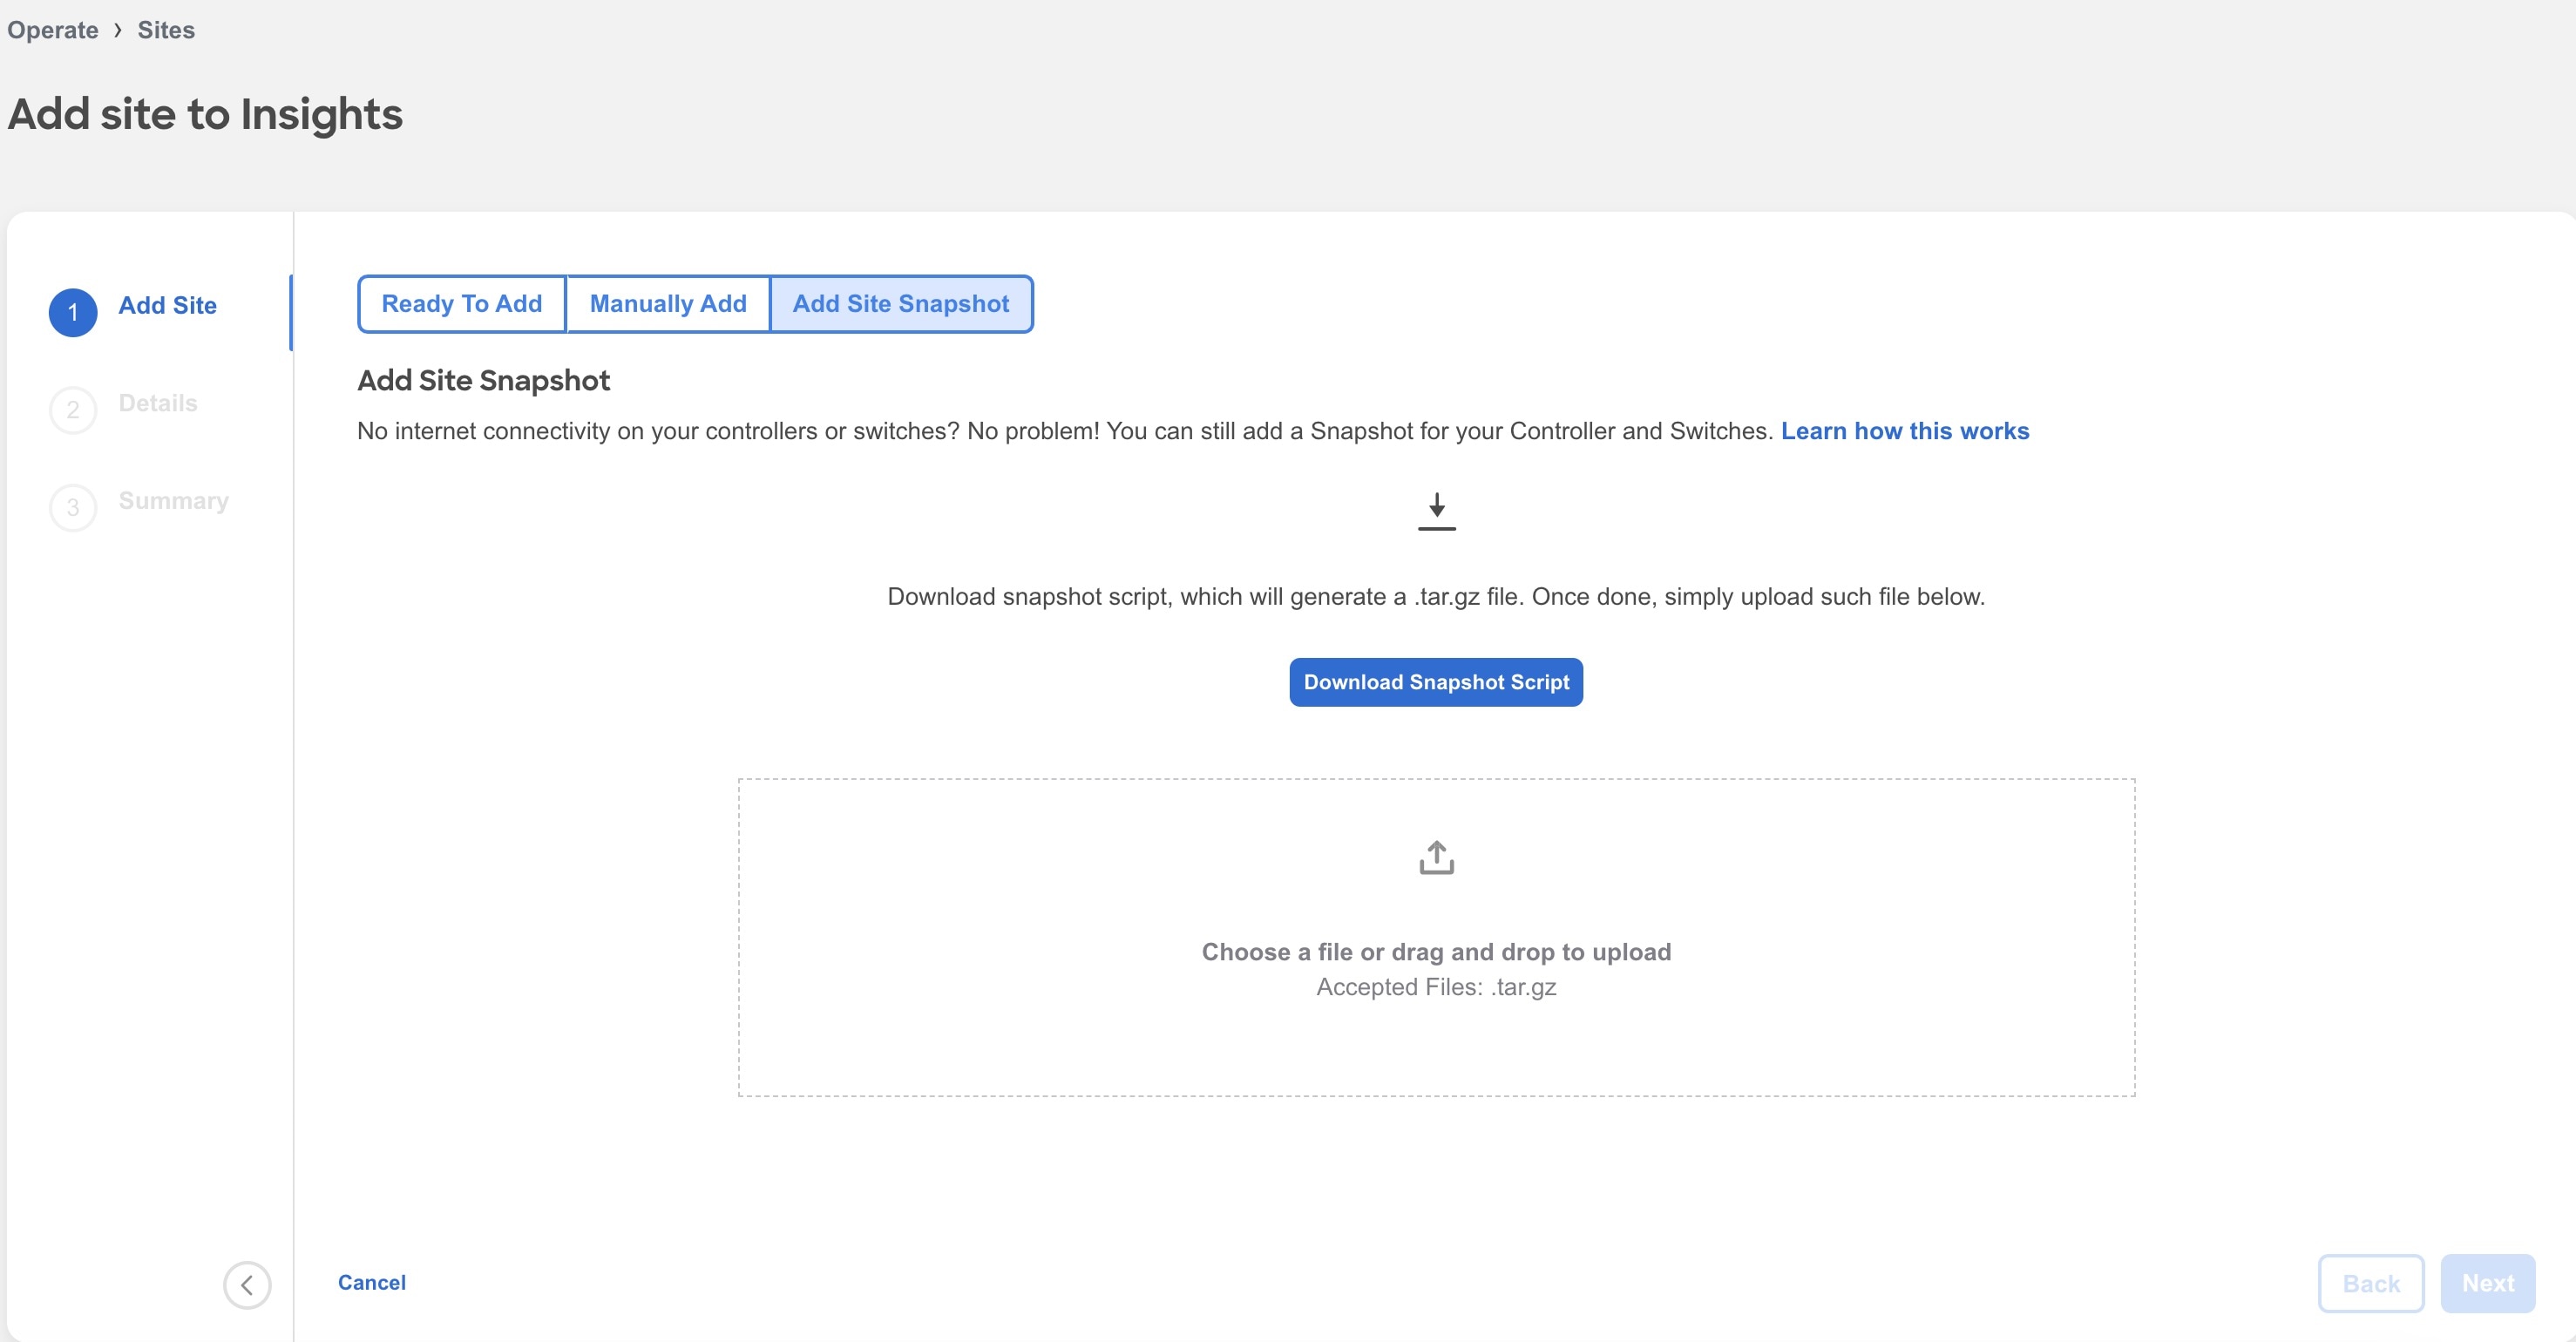
-
Click Download Snapshot Script to download the
data-collectors.tar.gzto your machine. -
Extract the file you downloaded and run the data collection script. Follow the instructions provided in the readme.md file. After the script is completed successfully, the data is collected in a
<filename>.tar.gzfile.
The collection script requires that you have Python3 installed on your system.
-
Upload the file in Nexus Dashboard Insights and click Next
-
Enter the site name to identify the site on Nexus Dashboard.
-
Select the site location from the map to identify the site on Nexus Dashboard.
-
Click Next.
-
Verify the configuration.
-
Click Submit.
Site Analysis
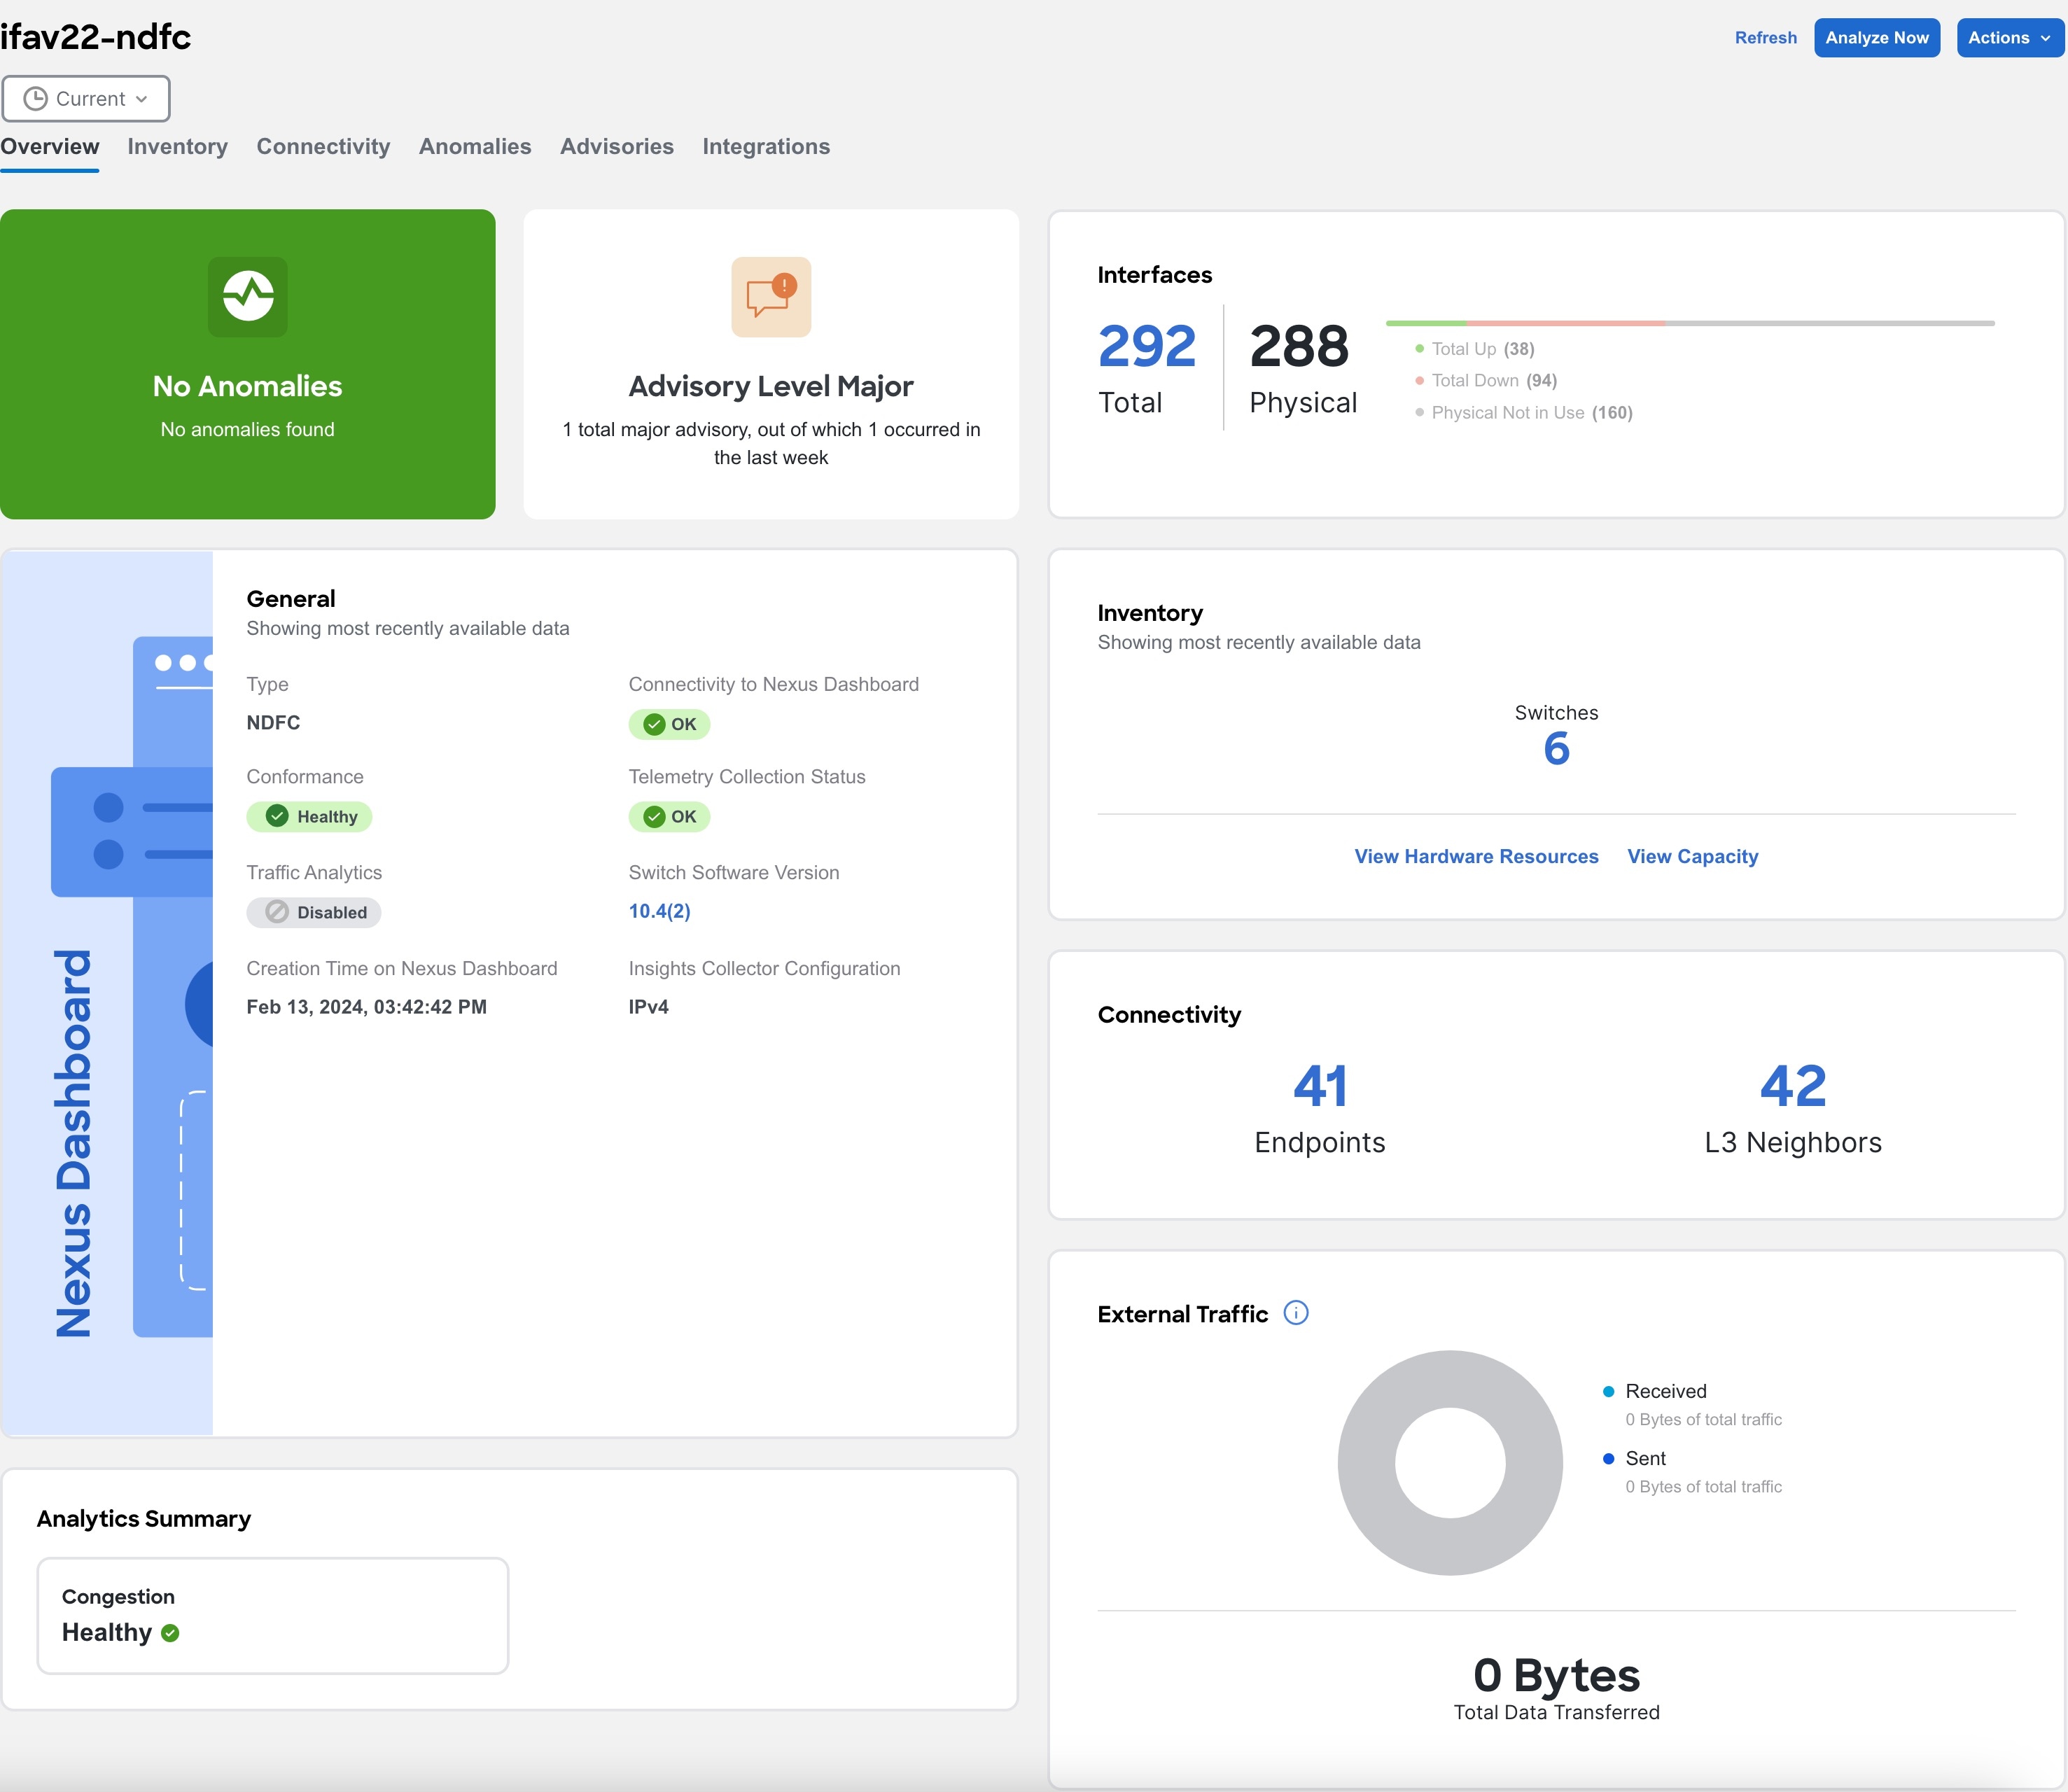
Once your site is onboarded and fully prepared, Nexus Dashboard Insights will start the analysis to collect data from your site and display the site information in the Sites page. To learn more, see Sites. The Site Analysis banner displays the progress of the analysis. The time to run the analysis depends on the size of the fabric.
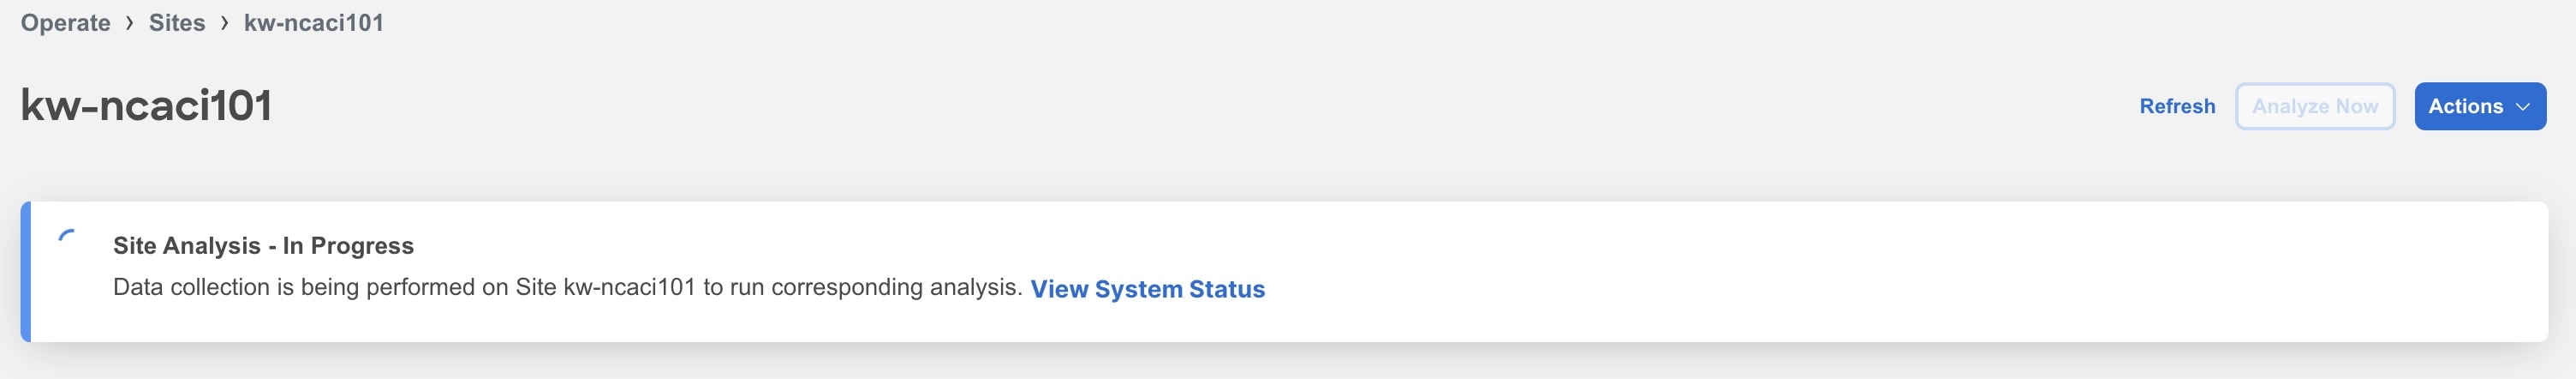
Click System Status to view the status. See System Status.
During site analysis, Telemetry Collection, Assurance Analysis, Bug Scan, and Best Practices analysis is carried out automatically. See Assurance Analysis and Bug Scan.
Assurance Analysis
Assurance analysis involves collecting data from sites, running the analysis to create a model with the collected data, and generating the results.
-
Assurance analysis provides assurance in real time. During assurance analysis for online sites, the data collection, model generation, and results generation are carried out simultaneously. The collected data is analyzed immediately after collection followed by result generation. This is repeated after a fixed time interval or as specified by the user. For online sites, assurance analysis is performed automatically every 2 hours. The schedule is determined by the fabric size and scale. For larger fabrics, assurance analysis is performed automatically every 3-4 hours.
-
For snapshot sites, a one-time assurance is provided. This assurance analysis allows you to decouple the data collection stage from the analysis stage. The data is collected using a Python script and the collected data is then uploaded to Nexus Dashboard Insights to provide a one-time assurance. The collected data can also be analyzed at a later time. It enables the user to collect the data during change management windows and then perform the analysis.
Guidelines and Limitations for Assurance Analysis
-
If you take the assurance analysis from a site and export the raw data set to upload a file to a Snapshot site, assurance analysis for the snapshot site will only generate assurance related anomalies.
-
Currently, if you begin an assurance analysis for a snapshot site, you can simultaneously continue to run the assurance analysis for online sites that are already in progress. They will all run without any disruption to the behavior.
-
Anomaly Rules and Compliance Rules are valid in assurance analysis for snapshot sites.
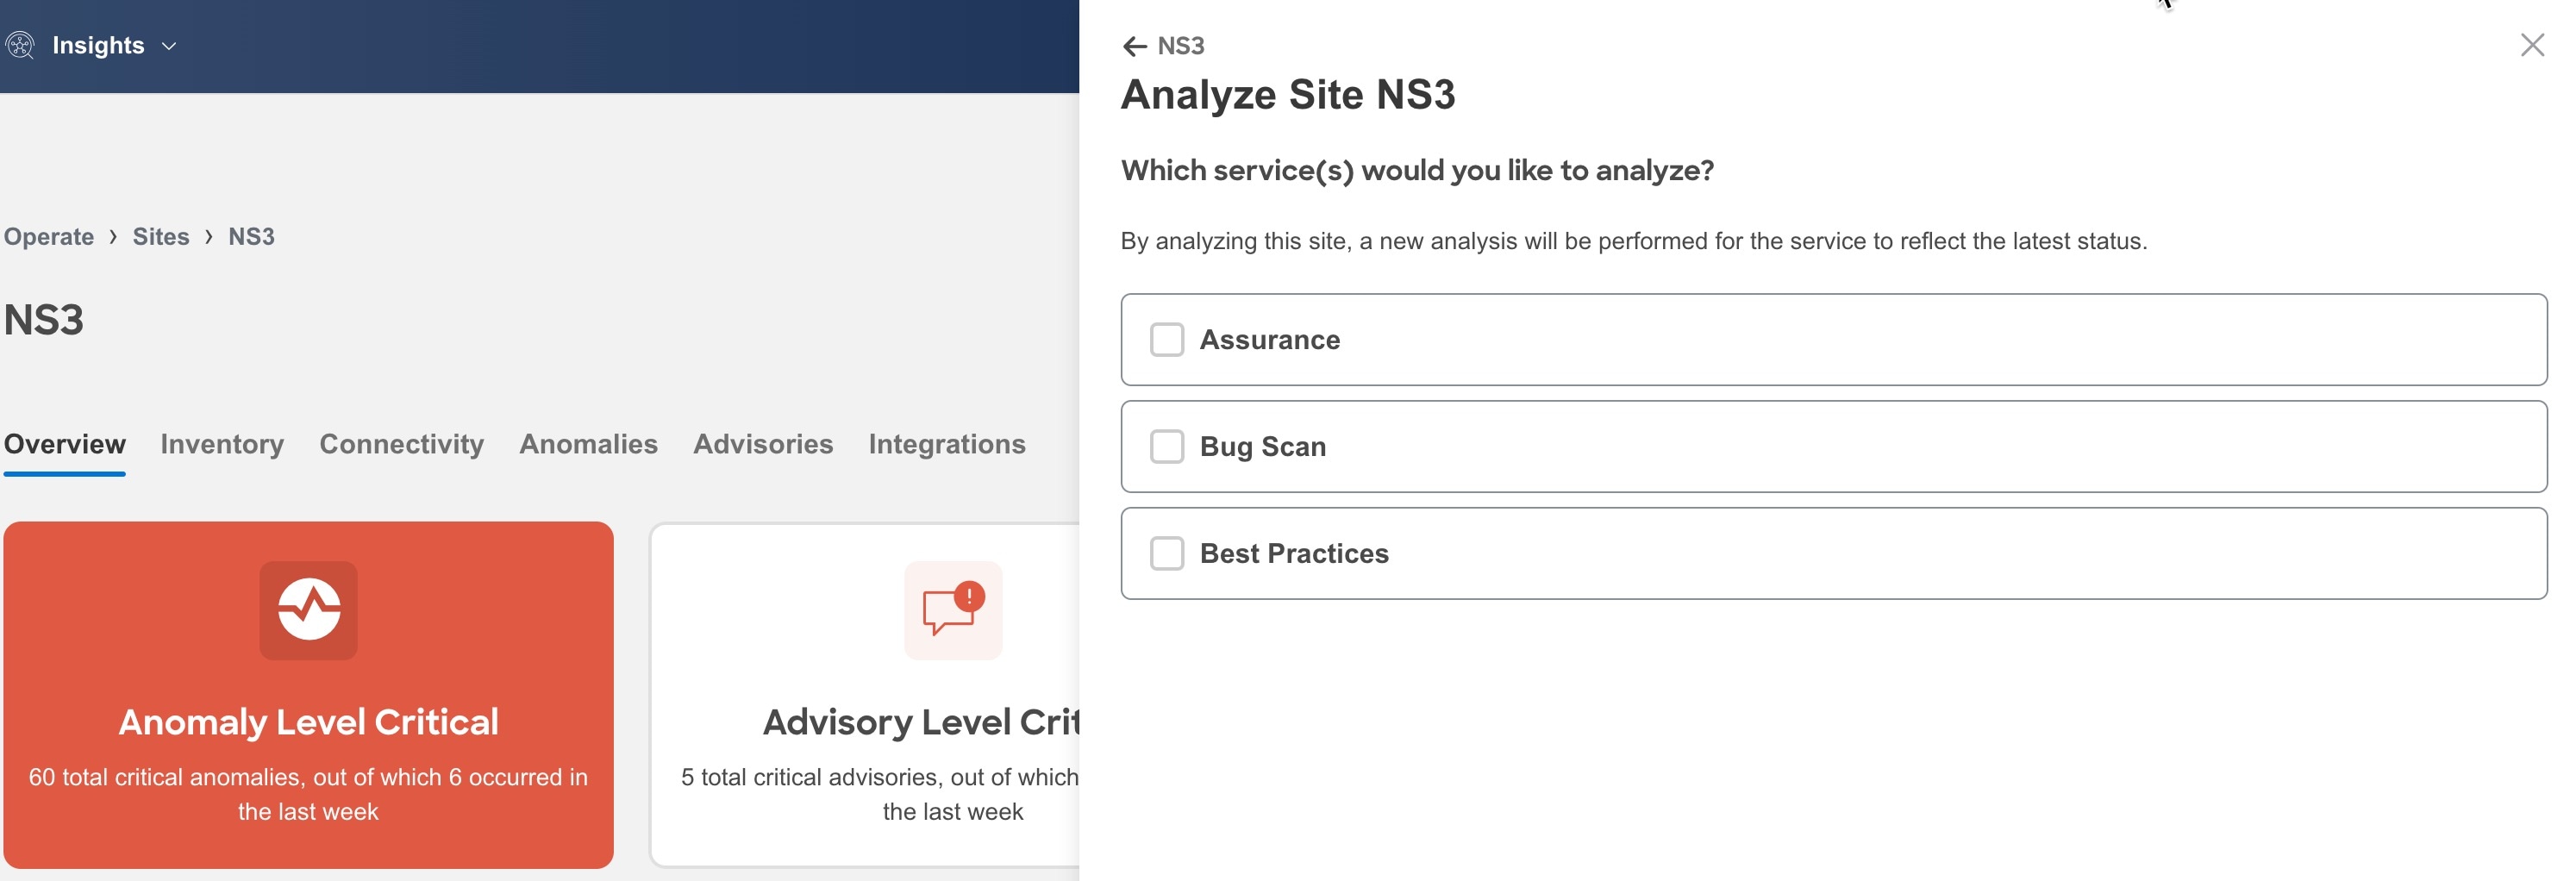
On-Demand Analysis
For online sites, assurance analysis is performed automatically, but you can also choose to request one at any time. This may be useful in cases where you resolve one or more issues in a site and would like Nexus Dashboard Insights to poll the latest Anomalies and Advisories information without waiting for the next automatic run.
Similarly you can also run an on-demand analysis for Bug Scan or Best Practices to reflect the latest status.
-
Navigate to Manage > Sites.
-
Select Online or Snapshot sites from the drop-down list.
-
For an online site, click the site name to view the details.
-
Click Analyze Now.
-
Select the service. For Bug Scan and Best Practices, select the switches and click Run Now.
-
-
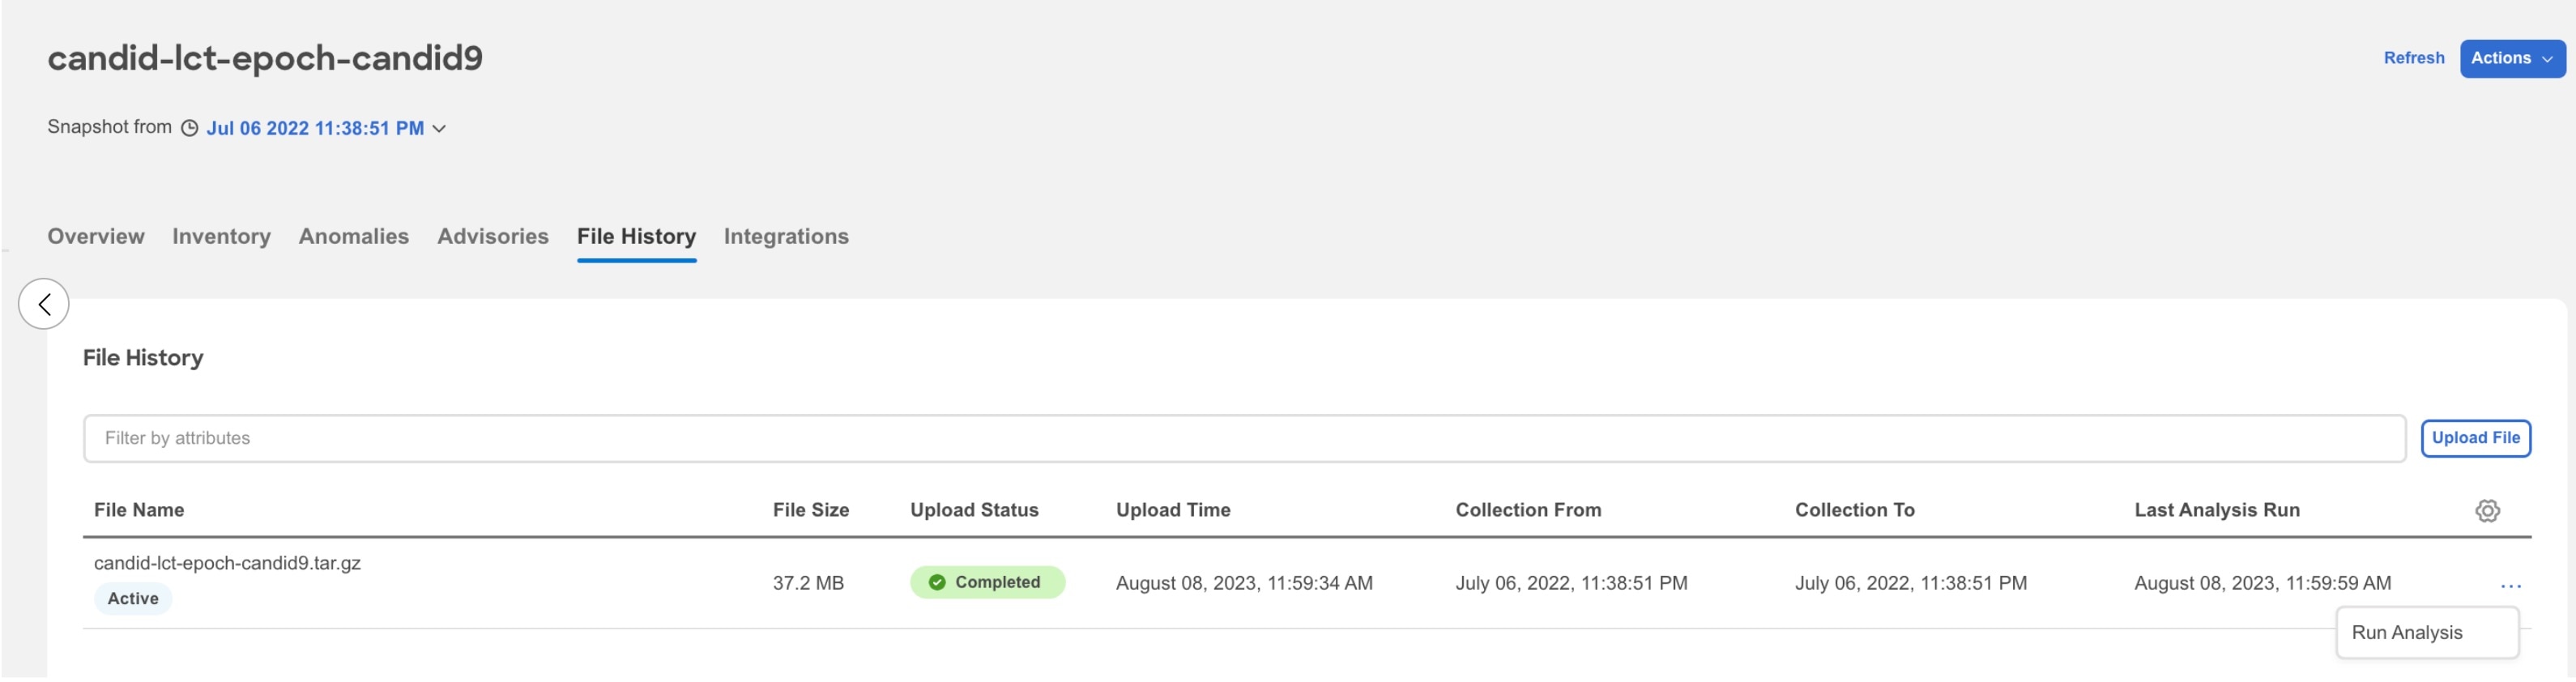
For snapshot site, click the site name to view the details.
-
Click File History.
-
In the File History table, click the ellipse icon and select Run Analysis.
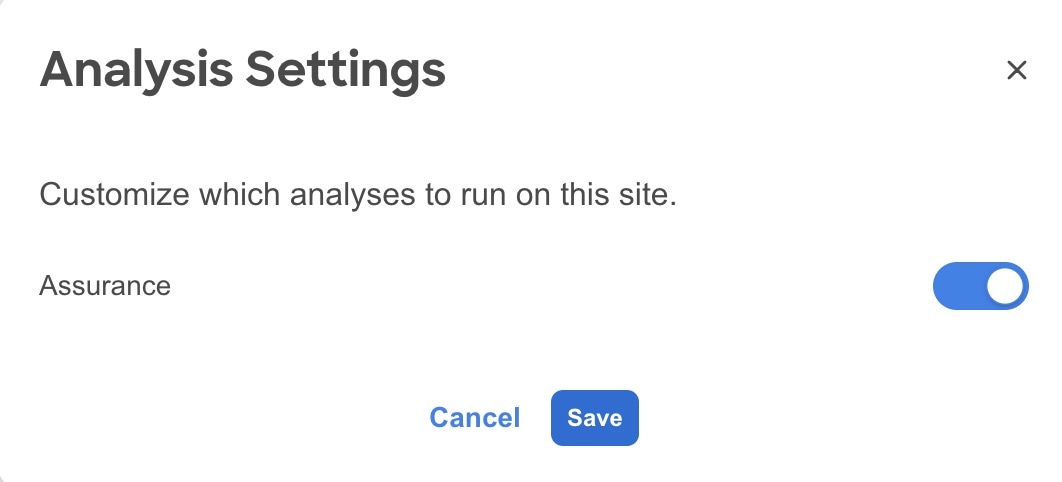
Enable Assurance Analysis
You can also enable or disable the automatically scheduled assurance analysis job.
-
Navigate to Manage > Sites.
-
Select Online site from the drop-down list.
-
Click the site name to view the details.
-
From the Actions menu, select System Status.
-
From the Actions menu, select Analyze Settings.
-
Use toggle to enable or disable scheduled assurance analysis job.
-
Click Save.
Bug Scan
Nexus Dashboard Insights collects technical support information from all the devices and runs them against known set of signatures, and flags the corresponding defects and PSIRTs. Nexus Dashboard Insights also generates advisories for PSIRTs and anomalies for defects. See Anomalies and Advisories to learn more about Metadata support.
The Bug Scan feature collects technical support logs from devices in a site and scans them for bugs that could have been hit. If the CPU and memory usage is below the set threshold of 65% then the tech support logs are collected and the Bug Scan is carried out for the devices. If the CPU and memory usage is above the set threshold, the devices are excluded from the Bug Scan and eventually will be reconsidered for the next default Bug Scan or when you run an on-demand Bug Scan for that device.
If the node interaction is not healthy on the device, you cannot select the device for Bug Scan to collect logs. The device cannot be selected to configure a job.
You can also run an on-demand Bug Scan for a site. See On-Demand Analysis.
Default Bug Scan
Bug Scan is run for all the sites onboarded to Nexus Dashboard Insights and is auto-scheduled every 7 days for each device. This schedule is fixed and is not customizable.
Bug Scan is run on devices contained in a site either based on the last Bug Scan or the onboarding time if a Bug Scan has not been run before. Priority is given to devices with a longer time elapsed since the last Bug Scan. After a Bug Scan is run on a device, regardless of whether it succeeds or fails, another Bug Scan will not be run for the same device for the next 7 days.
Bug Scan is auto-scheduled to run on devices only if the CPU and memory metrics for the devices are streamed and the percentage usage is less than 65%.
However, on-demand Bug Scan is an exception and is prioritized over any auto-scheduled runs and does not consider the CPU and memory metrics as it is user-initiated. If auto-scheduled Bug Scan is in progress and on-demand Bug Scan is initiated, based on the available resources in the Nexus Dashboard nodes the on-demand Bug Scan will start while the current Bug Scan is in progress or after the current Bug Scan is completed.
Only one Bug Scan at the time can run on a specific device. However, if you have one set of devices where Bug Scan is already in progress, a second (auto-scheduled or on-demand) Bug Scan can run only if Nexus Dashboard Insights has enough resources available. Otherwise it will be put on hold and started as soon as resources are available.
View Active and Susceptible Bugs
The Bug Scan feature collects technical support logs from devices in a site and scans them for bugs that could have been hit. Starting from Nexus Dashboard Insights release 6.4.1, you can view the active and susceptible bugs affecting your network after the Bug Scan is completed.
-
Navigate to Analyze > Analysis Hub > Bug Scan.
-
Select an online site or multiple online sites from the dropdown menu.
-
Select the software version from the dropdown menu. The active and susceptible bugs for the selected sites and software versions are displayed.
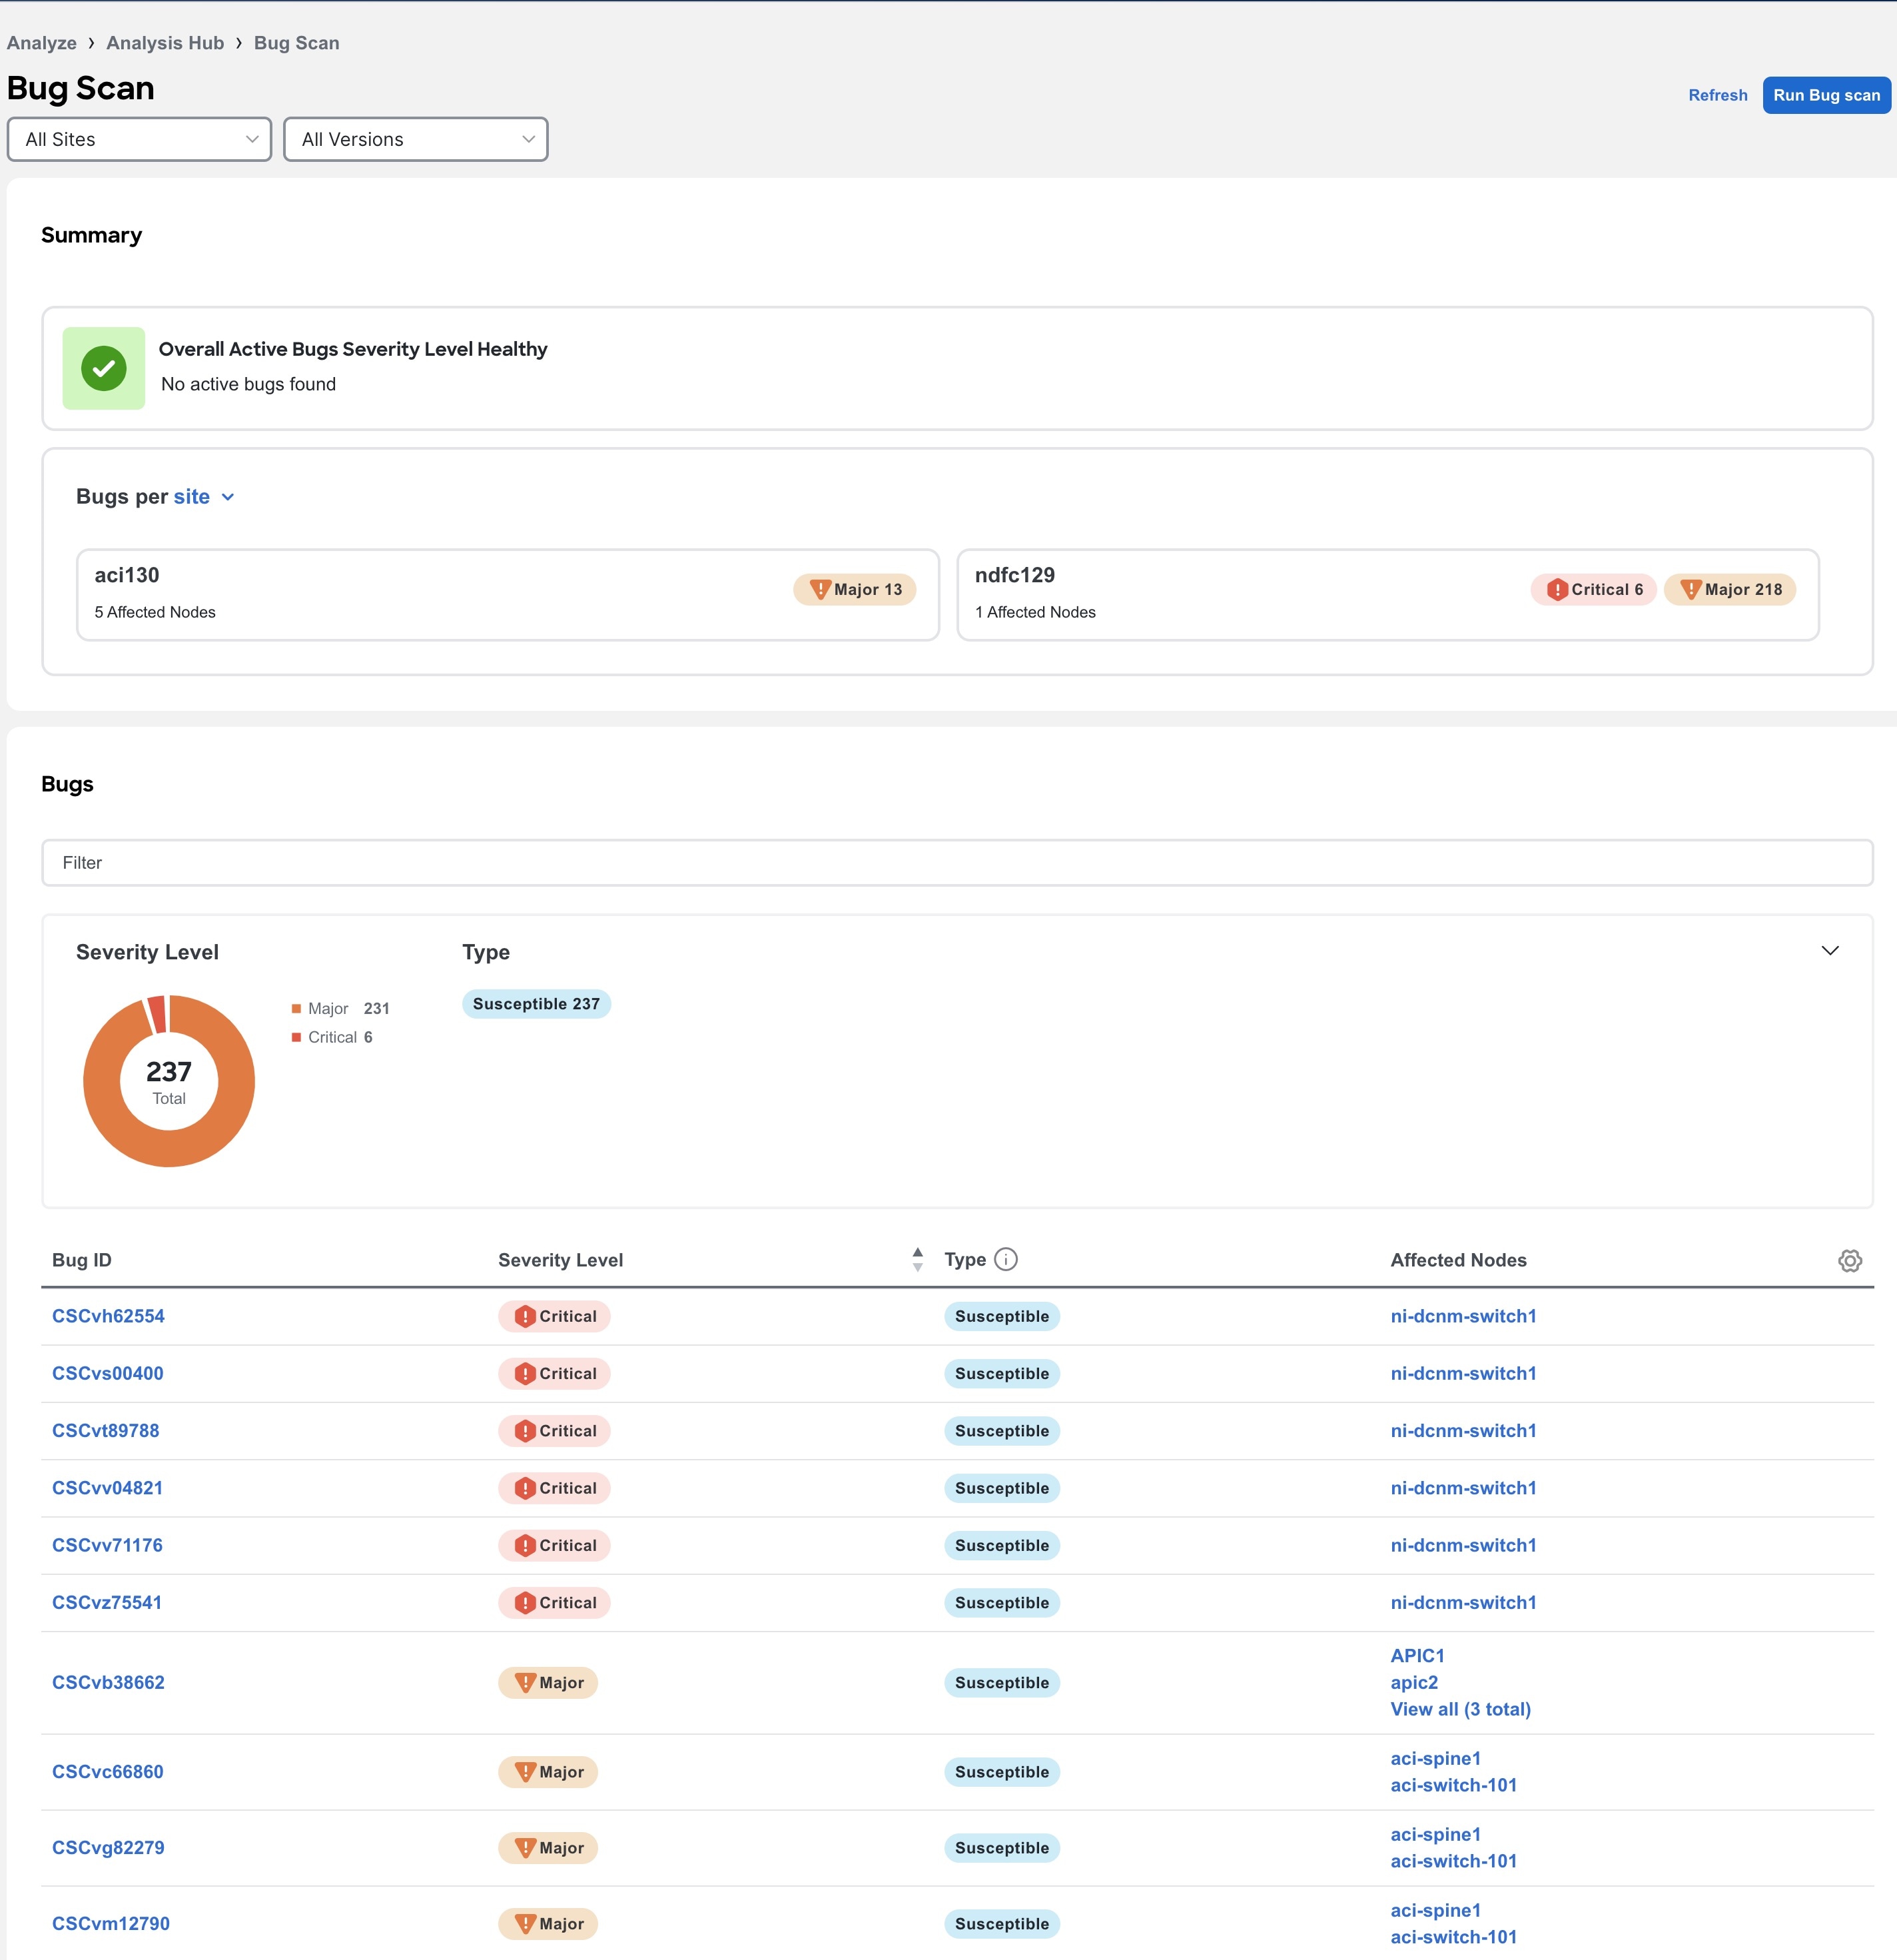
-
The Summary area displays the overall active bugs by severity. You can also view the Bugs per site or software version using the dropdown menu.
-
In the Bugs area, use the search bar to filter the bugs by bug ID, severity level, type, and affected nodes.
-
The Severity Level donut chart displays the total number of bugs of Critical, Major,and Warning severity. , The bugs table displays the filtered bugs. Click the column heading to sort the bugs in the table.
-
Click the gear icon to configure the columns in the table.
-
Click Bug ID to view bug details.
-
Click Run Bug Scan to run an on-demand Bug Scan. Select a site and click Run Now. See On-Demand Analysis.
View Active and Susceptible Bugs for an Individual Site
In Nexus Dashboard Insights, you can also view the bugs for an individual site in the following ways:
-
Navigate to Mange > Sites
-
Select Online Sites from the dropdown menu.
-
In the Software Version column, hover on the software version and click View Bugs to view the active and susceptible bugs for that site.
-
From the Actions dropdown menu click Run Bug Scan to run an on-demand Bug Scan. See On-Demand Analysis.
OR
-
Navigate to Manage > Sites
-
Select Online Sites from the dropdown menu.
-
Select a site.
-
In the General area hover on the software version and click View Bugs to view the active and susceptible bugs for that site.
-
From the Actions dropdown menu click Run Bug Scan to run an on-demand Bug Scan. See On-Demand Analysis.
OR
-
Navigate to Manage > Inventory
-
Select Online Sites from the dropdown menu.
-
In the Controllers table hover on the software version in the Software Version column and click View Bugs to view the active and susceptible bugs.
-
Click Switches. In the Switches table hover on the software version in the Software Version column and click View Bugs to view the active and susceptible bugs.
-
From the Actions dropdown menu click Run Bug Scan to run an on-demand Bug Scan.See On-Demand Analysis.
OR
-
Navigate to Manage > Site Software Management.
-
In the Software Management Jobs table click an analysis.
-
In the Firmware Summary area, hover on the Node Target Firmware and click View Bugs to view the active and susceptible bugs for that particular software version on that site.
-
From the Actions dropdown menu click Run Bug Scan to run an on-demand Bug Scan. See On-Demand Analysis.
Best Practices
Nexus Dashboard Insights collects technical support information from the site and runs them against known set of signatures and then flags the defects that are not compliant. Nexus Dashboard Insights also generates an anomaly list for you. See Anomalies and Advisories to learn more about Metadata support.
Best Practices is run for all the sites onboarded to Nexus Dashboard Insights and is auto-scheduled every 7 days for each device. This schedule is fixed and is not customizable.
Best Practices is run on devices contained in a site either based on the last Best Practices or the onboarding time if a Best Practices has not been run before. Priority is given to devices with a longer time elapsed since the last Best Practices. After a Best Practices is run on a device, regardless of whether it succeeds or fails, another Best Practices will not be run for the same device for the next 7 days.
However, on-demand Best Practices is an exception and is prioritized over any auto-scheduled runs. If auto-scheduled Best Practices is in progress and on-demand Best Practices is initiated, based on the available resources in the Nexus Dashboard nodes the on-demand Best Practices will start while the current Best Practices is in progress or after the current Best Practices is completed.
Only one Best Practices at the time can run on a specific device. However, if you have one set of devices where Best Practices is already in progress, a second (auto-scheduled or on-demand) Best Practices can run only if Nexus Dashboard Insights has enough resources available. Otherwise it will be put on hold and started as soon as resources are available.
On-Demand Best Practices
You can also run an on-demand Best Practices for a site. See On-Demand Analysis.
You can only run one on-demand Bug Scan or Best Practice job in Nexus Dashboard Insights at any given instance. Once an on-demand job is started, the UI takes up to a minute to grey out. If you trigger another on-demand job while the UI is not greyed out, the job will fail.
About Device Connector
Data center apps and services such as the Cisco Nexus Dashboard Insights service is connected to the Cisco Intersight cloud portal through a Device Connector which is embedded in the management controller of the Cisco Nexus Dashboard platform.
See Cisco Nexus Dashboard Operations for Configuring the Device Connector and Claiming a Device.
For connectivity requirements, see Network Connectivity Requirements.
Nexus Dashboard Insights Switch Configuration Status
-
Navigate to Admin > System Settings > System Status Details.
-
Select a site.
-
Click the ellipse icon and click Expected Configuration.
-
You can configure the appropriate switches by using the recommended configuration. From the Expected Configuration area, you can view and copy configurations under Software Telemetry and Flow Telemetry.
Apply Telemetry Configuration to a Switch
For NDFC fabric in Monitored mode, Nexus Dashboard Insights will not deploy telemetry configuration to all switches in the fabric in the following scenarios:
-
When you upgrade Nexus Dashboard Insights
-
When you upgrade the Nexus switch
In these scenarios, you must re-apply the telemetry configuration to every switch.
Use the following procedure to re-apply the telemetry config to a switch.
-
Navigate to Admin > System Settings > System Status Details.
-
Select a site.
-
Click the ellipse icon and then click Expected Configuration.
-
From the Expected Configuration area, you can view and copy configurations under Software Telemetry and Flow Telemetry.
-
Using the command line, log in to the switch.
-
Enter the following commands:
switch# configure terminal
switch(config)# no feature telemetry
switch(config)# copy running-config startup-config
Configure Flows
Flow Telemetry
Flow telemetry allows users to see the path taken by different flows in detail. It also allows you to identify the VRF instance of the source and destination. You can see the switches in the flow with the help of flow table exports from the nodes. The flow path is generated by stitching together all the exports in order of the flow.
You can configure the Flow Telemetry rule for the following interface types:
-
VRF instances
-
Physical interfaces
-
Port Channel interfaces
Physical or port channel flow rules are supported only on routed interfaces.
Flow telemetry monitors the flow for each fabric separately, as there is no stitching across the fabrics in a fabrics group. Therefore, flow telemetry is for individual flows. For example, if there are two fabrics (fabric A and fabric B) within a fabrics group, and traffic is flowing between the two fabrics, they will be displayed as two separate flows. One flow will originate from Fabric A and display where the flow exits. And the other flow from Fabric B will display where it enters and where it exits.
Flow Telemetry Guidelines and Limitations
-
Ensure that you have configured NTP and enabled PTP on NDFC. See Cisco Nexus Dashboard Insights Deployment Guide for more information. You are responsible for configuring the switches with external NTP servers for Cisco NDFC fabrics.
-
Starting with Cisco Nexus Dashboard Insights release 6.0.1, all flows are monitored as a consolidated view in a unified pipeline for site types ACI and NDFC, and the flows are aggregated under the same umbrella.
-
In the Edit Flow page, it is possible to enable all three, you choose the best possible mode for a product. sFlow is most restrictive, Netflow has some more capability, and Flow Telemetry has the most capability. So the recommendation is to enable Flow Telemetry if it is available for your configuration. If Flow Telemetry is not available, then use Netflow. If Netflow is not available, use sFlow.
-
Even if a particular node (for example, a third party switch) is not supported for Flow Telemetry, Cisco Nexus Dashboard Insights will use LLDP information from the previous and next nodes in the path to identify the switch name and the ingress and egress interfaces.
-
Flow telemetry including Flow Telemetry Events supports the following:
-
20,000 unique flows/s [physical standard]
-
10,000 unique flows/s [physical small]
-
2,500 unique flows/s [vND ]
-
-
If there are multiple NDFC clusters onboarded to Cisco Nexus Dashboard Insights, partial paths will be generated for each site.
-
If you manually configure the fabric to use with Nexus Dashboard Insights and Flow Telemetry support, the Flows Exporter port changes from 30000 to 5640. To prevent a breakage of the Flows Exporter, adjust the automation.
-
Nexus Dashboard supports Kafka export for Flow anomalies. However, Kafka export is not currently supported for Flow Event anomalies.
-
Flow telemetry is supported in -FX3 platform switches for the following NX-OS versions:
-
9.3(7) and later
-
10.1(2) and later
-
Flow telemetry is not supported in -FX3 platform switches for NX-OS version 10.1(1).
-
-
Interface based Flow Telemetry is only supported on modular chassis with -FX land -GX line cards on physical ports and port-channels rules.
-
If interface based Flow Telemetry is pushed from Nexus Dashboard Insights for Classic LAN and External Connectivity Network fabrics, perform the following steps in NDFC:
-
In the NDFC GUI, select the fabric.
-
Choose Policies > Action > Add policy > Select all > Choose template > host_port_resync and click Save.
-
In the Fabric Overview page, choose Actions > Recalculate and deploy.
-
-
For VXLAN fabrics, interface based Flow Telemetry is not supported on switch links between spine switch and leaf switch.
Flow Telemetry Rules guidelines and limitations:
-
If you configure an interface rule (physical/port channel)on a subnet, it can monitor only incoming traffic. It can’t monitor outgoing traffic on the configured interface rule.
-
If a configured port channel that contains two physical ports, only the port channel rule is applicable. Even if you configure physical interface rules on the port, only port channel rule takes precedence.
-
You can configure up to 500 rules on a node.
-
For NX-OS release 10.3(2) and earlier, if a flow rule are configured on an interface, then global flow rules are not matched.
-
For NX-OS release 10.3(3) and later, a flow rule configured on an interface is matched first and then the global flow rules are matched.
Configure Flows
Configure Flow Collection Modes
Procedure
-
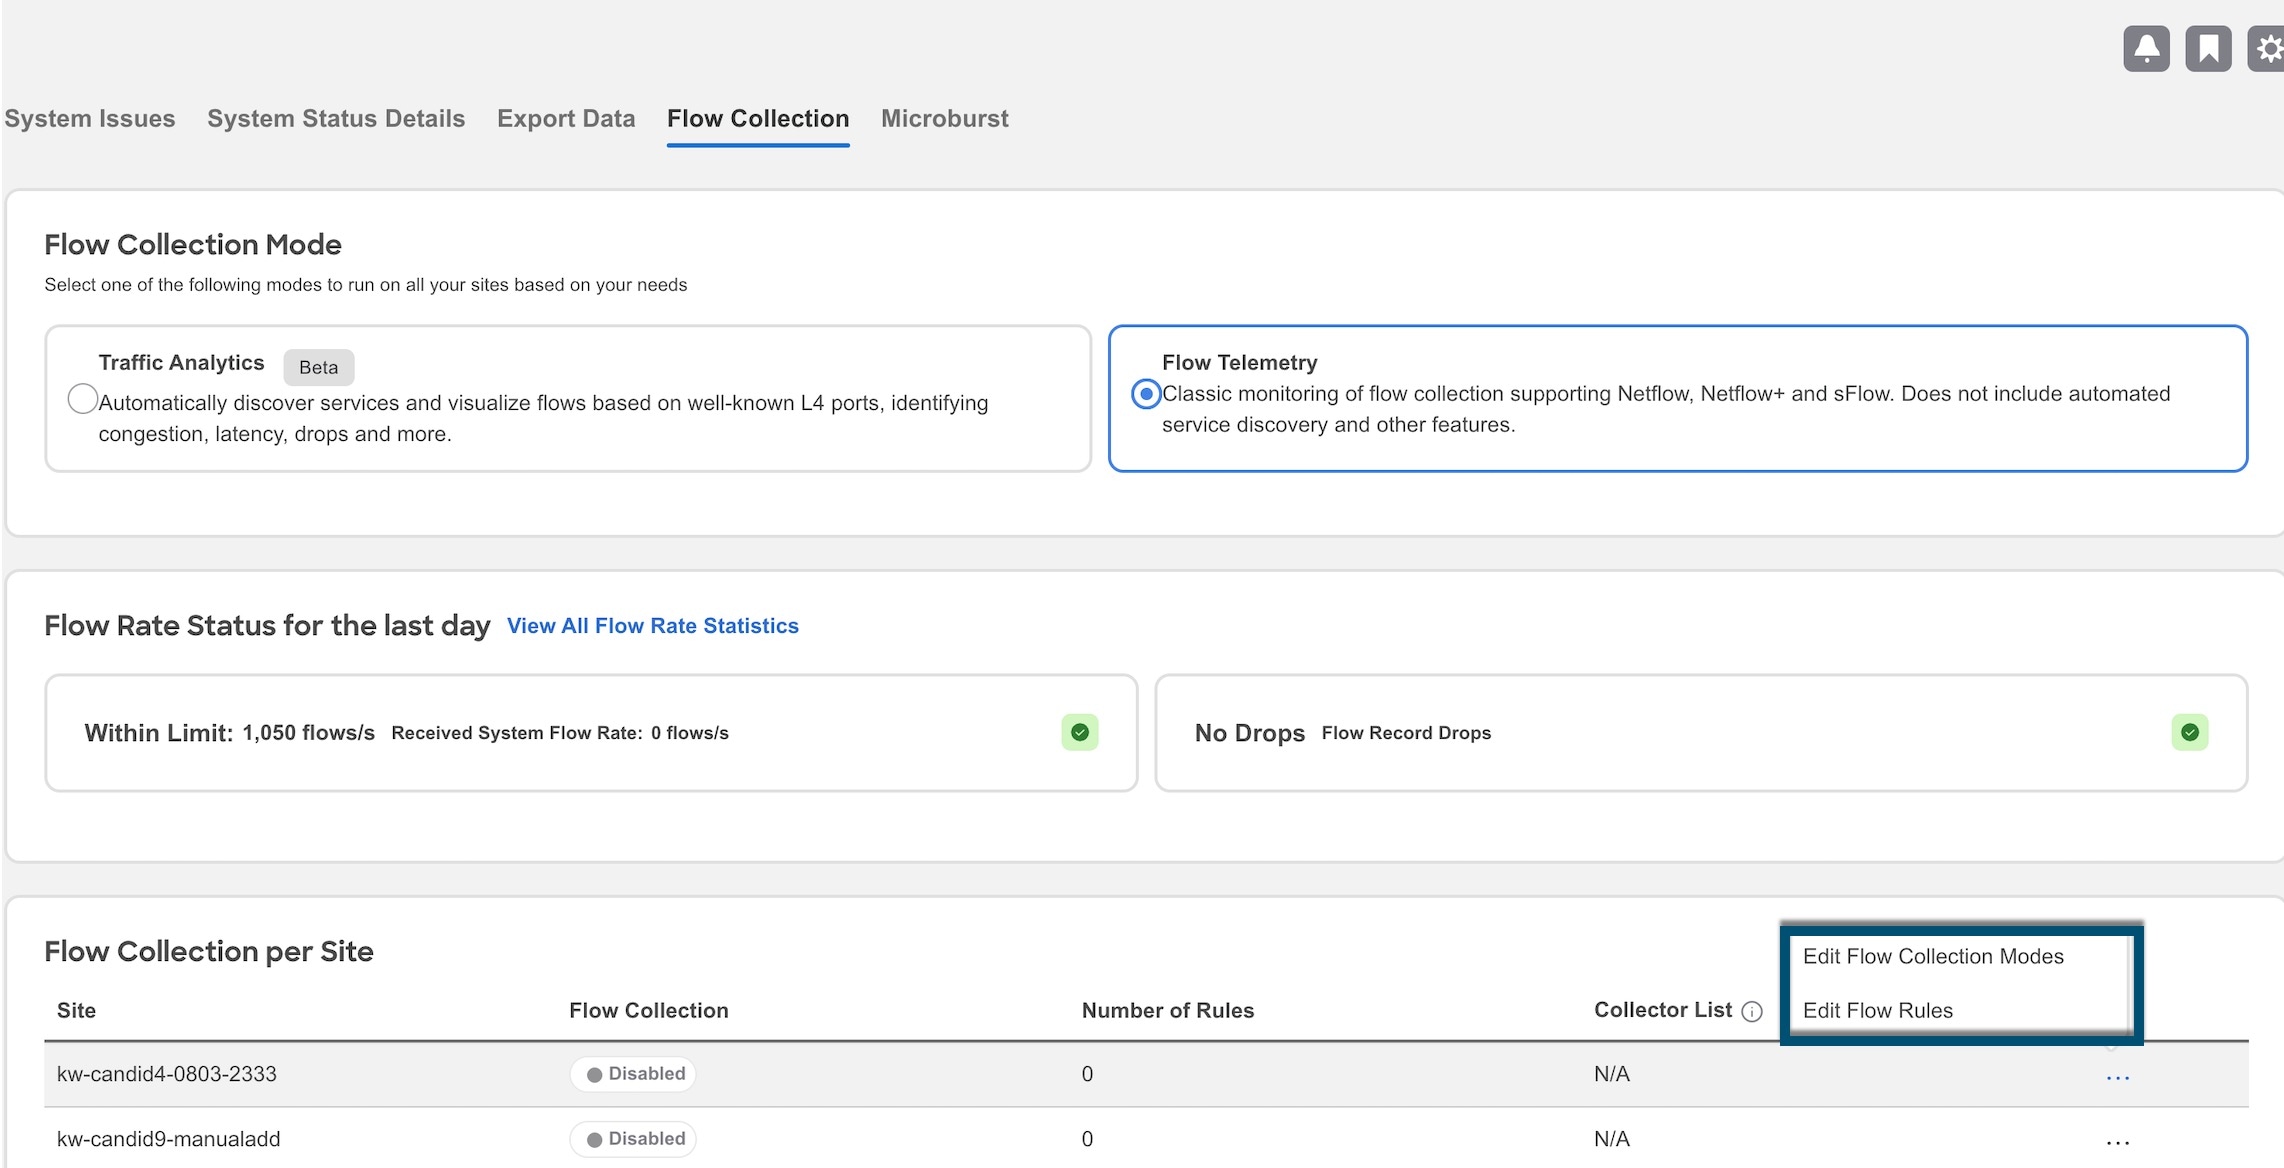
Navigate to Admin > System Settings > Flow Collection.
-
In the Flow Collection Mode area, select Flow Telemetry.
-
In the Flow Collection per Site table, select the site and click the ellipse icon.
-
Click Edit Flow Collection Modes.
-
In the Edit Flow Collection Mode page, select Flow Telemetry to enable Flow Telemetry. All the flows are disabled by default.
-
Click Save.
Enabling Flow Telemetry automatically activates Flow Telemetry Events. Whenever a compatible event takes place, an anomaly will be generated, and the What’s the impact? section in the Anomaly page will display the associated flows. You can manually configure a Flow Telemetry rule to acquire comprehensive end-to-end information about the troublesome flow.
Configure Flow Collection Rules
Procedure
-
Navigate to Admin > System Settings > Flow Collection.
-
In the Flow Collection Mode area, select Flow Telemetry.
-
In the Flow Collection per Site table, select the site and click the ellipse icon.
-
Click Edit Flow Rules.
-
To add a VRF rule, click VRF tab and perform the following:
-
From the Actions drop-down menu, select Create New Rule.
-
In the General area, complete the following:
-
Enter the name of the rule in the Rule Name field.
-
The VRF filed is disabled. The flow rule applies to all the VRFs.
-
In the Flow Properties area, select the protocol for which you intend to monitor the flow traffic.
-
Enter the source and destination IP addresses. Enter the source and destination port.
-
Click Save.
-
-
-
To add a physical interfaces rule, click Physical Interfaces tab and perform the following:
-
From the Actions drop-down menu select Create New Rule.
-
In the General area, complete the following:
-
Enter the name of the rule in the Rule Name field.
-
Check the Enabled check box to enable the status. If you enable the status, the rule will take effect. Otherwise, the rule will be removed from the switches.
-
In the Flow Properties area, select the protocol for which you intend to monitor the flow traffic.
-
Enter the source and destination IP addresses. Enter the source and destination port.
-
In the Interface List area, click Select a Node. Use the search box to select a node.
-
From the drop-down list, select an interface. You can add more than one row (node+interface combination) by clicking Add Interfaces. However, within the rule, a node can appear only once. Configuration is rejected if more than one node is added.
-
Click Save.
-
-
-
To add a port channel rule, click Port Channel tab and perform the following:
-
From the Actions drop-down menu, select Create New Rule.
-
In the General area, enter the name of the rule in the Rule Name field.
-
Select the Enabled check box to enable the status. If you enable the status, the rule will take effect. Otherwise, the rule will be removed from the switches.
-
In the Flow Properties area, select the protocol for which you intend to monitor the flow traffic.
-
Enter the source and destination IP addresses. Enter the source and destination port.
-
From the drop-down list, select an interface. You can add more than one row (node+interface combination) by clicking Add Interfaces. However, within the rule, a node can appear only once. Configuration is rejected if more than one node is added.
-
Click Save.
-
-
-
Click Done
Monitoring the Subnet for Flow Telemetry
For Flow Telemetry, you monitor the subnet as follows.
In the following example, the configured rule for a flow monitors the specific subnet provided. The rule is pushed to the site which pushes it to the switches. So, when the switch sees traffic coming from a source IP or the destination IP, and if it matches the subnet, the information is captured in the TCAM and exported to the Cisco Nexus Dashboard Insights service. If there are 4 nodes (A, B, C, D), and the traffic moves from A > B > C > D, the rules are enabled on all 4 nodes and the information is captured by all the 4 nodes. Cisco Nexus Dashboard Insights stitches the flows together. Data such as the number of drops and the number of packets, anomalies in the flow, and the flow path are aggregated for the 4 nodes.
-
Navigate to Manage > Sites.
-
Select Online Sites from the drop-down list.
-
Click a site name to view the site details.
-
Navigate to Connectivity > Flows.
-
Select a time range.
-
The Flows page displays all the flows that are being captured based on the snapshot that you selected.
The related anomaly score, record time, the nodes sending the flow telemetry, flow type, ingress and egress nodes, and additional details are displayed in a table format. If you click a specific flow in the table, specific details are displayed in the sidebar for the particular flow telemetry. In the sidebar, if you click the Details icon, the details are displayed in a larger page. In this page, in addition to other details, the Path Summary is also displayed with specifics related to source and destination. If there are flows in the reverse direction, that will also be visible in this location.
For a bi-directional flow, there is an option to choose to reverse the flow and see the path summary displayed. If there are any packet drops that generate a flow event, they can be viewed in the Anomaly dashboard.
Netflow
Netflow is an industry standard where Cisco routers monitor and collect network traffic on an interface. Starting with Cisco Nexus Dashboard Insights release 6.0, Netflow version 9 is supported.
Netflow enables the network administrator to determine information such as source, destination, class of service, and causes of congestion. Netflow is configured on the interface to monitor every packet on the interface and provide telemetry data. You cannot filter on Netflow.
Netflow in Nexus switches is based on intercepting the packet processing pipeline to capture summary information of network traffic.
The components of a flow monitoring setup are as follows:
-
Exporter: Aggregates packets into flows and exports flow records towards one or more collectors
-
Collector: Reception, storage, and pre-processing of flow data received from a flow exporter
-
Analysis: Used for traffic profiling or network intrusion
-
The following interfaces are supported for Netflow:
| Interfaces | 5 Tuple | Nodes | Ingress | Egress | Path | Comments |
|---|---|---|---|---|---|---|
|
Routed Interface/Port Channel NOTE: Port Channel support is available if the user monitors only the host-facing interfaces. |
Yes |
Yes |
Yes |
No |
Yes |
Ingress node is shown in path |
|
Sub Interface/Logical (Switch Virtual Interface) |
Yes |
Yes |
-No |
No |
No |
No |
Netflow Types
For Nexus 9000 Series switches with NDFC type, Full Netflow is supported. For Nexus 7000 and Nexus 7700 Series switches, F/M line cards with NDFC type, Sampled Netflow is supported.
Full Netflow
With Full Netflow, all packets on the configured interfaces are captured into flow records in a flow table. Flows are sent to the supervisor module. Records are aggregated over configurable intervals and exported to the collector. Except in the case of aliasing (multiple flows hashing to the same entry in the flow table), all flows can be monitored regardless of their packet rate.
Sampled Netflow
With Sampled Netflow, packets on configured interfaces are time sampled. Flows are sent to the supervisor or a network processor for aggregation. Aggregated flow records are exported at configured intervals. The probability of a record for a flow being captured depends on the sampling frequency and packet rate of the flow relative to other flows on the same interface.
Netflow Guidelines and Limitations
-
In the Edit Flow page, it is possible to enable all three, you choose the best possible mode for a product. sFlow is most restrictive, Netflow has some more capability, and Flow Telemetry has the most capability. So the recommendation is to enable Flow Telemetry if it is available for your configuration. If Flow Telemetry is not available, then use Netflow. If Netflow is not available, use sFlow.
-
Netflow, in Cisco Nexus 9000 series switches, supports a small subset of the published export fields in the RFC.
-
Netflow is captured only on the ingress port of a flow as only the ingress switch exports the flow. Netflow cannot be captured on fabric ports.
-
In Nexus 7000 and Nexus 9000 Series switches, only the ingress host-facing interface configured for Netflow are supported (either in VXLAN or Classic LAN).
-
For Netflow, Cisco Nexus Dashboard requires the configuration of persistent IPs under cluster configuration, and 7 IPs in the same subnet as the data network are required.
-
For NDFC type, the Netflow supported fabrics are Classic and VxLAN. VXLAN is not supported on fabric ports.
-
Netflow configurations will not be pushed. However, if a site is managed, the software sensors will be pushed.
-
If you manually configure the fabric to use with Cisco Nexus Dashboard Insights and Netflow support, the Flows Exporter port changes from 30000 to 5640. To prevent a breakage of the Flows Exporter, adjust the automation.
-
To configure Netflow on fabric switches, see the Configuring Netflow section in the Cisco Nexus 9000 Series NX-OS System Management Configuration Guide.
Configure Netflow
Before you begin
As a user, you must configure the appropriate switches by using the recommended configuration.
Procedure
Configure Netflow as follows.
-
Navigate to Admin > System Settings > Flow Collection.
-
In the Flow Collection Mode area, select Flow Telemetry.
-
In the Flow Collection per Site table, select the site and click the ellipse icon.
-
Click Edit Flow Collection Modes.
-
In the Edit Flow Collection Mode page, select Netflow. All the flows are disabled by default.
-
Click Save.
sFlow
sFlow is an industry standard technology traffic in data networks containing switches and routers. Cisco Nexus Dashboard Insights supports sFlow version 5 on Cisco Nexus 3000 series switches.
sFlow provides the visibility to enable performance optimization, an accounting and billing for usage, and defense against security threats.
The following interfaces are supported for sFlow:
| Interfaces | 5 Tuple | Nodes | Ingress | Egress | Path | Comments |
|---|---|---|---|---|---|---|
|
Routed Interface |
Yes |
Yes |
Yes |
Yes |
Yes |
Ingress node is shown in path |
sFlow Guidelines and Limitations
-
Cisco Nexus Dashboard Insights supports sFlow with Cisco Nexus 3000 series switches using NDFC.
-
It is recommended that enable Flow Telemetry if it is available for your configuration. If that is not available for your configuration, use Netflow. If Netflow, is not available for your configuration, then use sFlow.
-
For sFlow, Cisco Nexus Dashboard requires the configuration of persistent IPs under cluster configuration, and 6 IPs in the same subnet as the data network are required.
-
sFlow configurations will not be pushed. However, if a site is managed, the software sensors will be pushed.
-
If you manually configure the fabric to use with Cisco Nexus Dashboard Insights and sFlow support, the Flows Exporter port changes from 30000 to 5640. To prevent a breakage of the Flows Exporter, adjust the automation.
-
Cisco Nexus Dashboard Insights does not support sFlow in the following Cisco Nexus 3000 Series switches:
-
Cisco Nexus 3600-R Platform Switch (N3K-C3636C-R)
-
Cisco Nexus 3600-R Platform Switch (N3K-C36180YC-R)
-
Cisco Nexus 3100 Platform Switch (N3K-C3132C-Z)
-
-
Cisco Nexus Dashboard Insights does not support sFlow in the following Cisco Nexus 9000 Series fabric modules:
-
Cisco Nexus 9508-R fabric module (N9K-C9508-FM-R)
-
Cisco Nexus 9504-R fabric module (N9K-C9504-FM-R)
-
-
To configure sFlow on fabric switches, see the Configuring sFlow section in the Cisco Nexus 9000 Series NX-OS System Management Configuration Guide.
Configure sFlow
Before you begin
As a user, you must configure the appropriate switches by using the recommended configuration.
Procedure
Configure sFlow Telemetry as follows.
-
Navigate to Admin > System Settings > Flow Collection.
-
In the Flow Collection Mode area, select Flow Telemetry.
-
In the Flow Collection per Site table, select the site and click the ellipse icon.
-
Click Edit Flow Collection Modes.
-
In the Edit Flow Collection Mode page, select select sFlow. All the flows are disabled by default.
-
Click Save.
Export Data
Export Data
The Export Data feature enables you to export the data collected by Nexus Dashboard Insights over Kafka and Email. Nexus Dashboard Insights produces data such as advisories, anomalies, audit logs, faults, statistical data, risk and conformance reports. When you import a Kafka broker, all the data is written as a topic.
Additionally, you can configure an email scheduler to specify the data and the frequency with which you want to receive the information in an email.
Cisco Intersight is used for email notifications. See About Device Connector for more information.
Export Data Guidelines and Limitations
-
You can configure up to 5 emails per day for periodic job configurations.
-
Intersight connectivity is required to receive the reports via email.
-
A maximum of 5 exporters for Kafka Export is supported.
-
Before configuring your Kafka Export, you must add the external Kafka IP address as a known route in your Nexus Dashboard cluster configuration.
-
Nexus Dashboard supports Kafka export for Flow anomalies. However, Kafka export is not currently supported for Flow Event anomalies.
-
Make sure all configuration in the Message Bus Configuration and Email page are removed before disabling Software Telemetry on any fabric and removing the fabric from NDFC.
-
The following categories will be included for Anomalies in the Kafka and Email messages: Resources, Environmental, Statistics, Endpoints, Flows, Bugs.
-
The following categories will not be included for Anomalies in the Kafka and Email messages: Security, Forwarding, Change Analysis, Compliance, System.
-
Export data is not supported for Snapshot Sites.
-
You must provide unique names for each export.
Configure Kafka Exporter
Use the following procedure to configure the Kafka exporter:
-
Navigate to Admin > System Settings > Export Data.
-
In the Message Bus Configuration area, click Add New and perform the following tasks.
-
In the Site Name field, select the appropriate site.
-
In the IP Address and Port fields, enter the Kafka broker IP address and port.
-
In the Mode field, select the security mode. The supported modes are Unsecured, Secured SSL and SASLPLAIN mode.
-
In the General Settings area, enter the name and topic name, where the data must be sent, and select the Basic or Advanced mode.
The Kafka export details for the anomalies and advisories are displayed.
-
-
In the Collection Settings area for each category, choose the severity level for anomalies and advisories.
-
Click Save.
This configuration sends immediate notification when the selected anomalies or advisories occur.
Configure Email
Use the following procedure to configure an email scheduler that sends the summary of the data collected from Nexus Dashboard Insights:
-
Navigate to Admin > System Settings > Export Data.
-
In the Email area, click Add New, and perform the following actions:
-
In the General Settings area, in the Site Name field, choose the site name.
-
In the Name field, enter the name.
-
In the Email field, enter the email address. For multiple email addresses, use commas as separators.
-
In the Format field, choose Text or HTML format for email.
-
In the Start Date field, enter the start date.
-
In the Collect Every field, specify the frequency in days or weeks.
-
In the Mode field, select Basic or Advanced.
In the Basic mode, the severity for anomalies, advisories, and faults are displayed in the Collection Settings area. In the Advanced mode, the categories and severity for anomalies and advisories, are displayed in the Collection Settings area.
-
-
In the Collection Settings area for each category select the severity level for anomalies and advisories. Select all that apply. For Active Alerts select the enable or disable options. For Conformance Reports, select Software for software release, Hardware for hardware platform, and both for combination of software and hardware conformance.
-
Click Save. The configured email schedulers are displayed in the Email area.
You will receive an email about the scheduled job on the provided Start Date and at the time provided in Collect Every. The subsequent emails follow after Collect Every frequency expires. If the time provided is in the past, you will receive an email immediately and the next email is triggered after the expiry of the duration from the start time provided.
-
(Optional) In the edit area, perform the following steps:
-
Click
 to edit an email scheduler.
 -
Click the
 to delete an email scheduler.
-
Syslog
Starting from release 6.1.1, Nexus Dashboard Insights supports the export of anomalies and advisories in syslog format. You can use this feature to develop network monitoring and analytics applications on top of Nexus Dashboard Insights, integrate with the syslog server to get alerts, and build customized dashboards and visualizations.
After you choose the site where you want to configure the syslog exporter and you set up the configuration for syslog export, Nexus Dashboard Insights will establish a connection with the syslog server and send the data to the syslog server.
Nexus Dashboard Insights will read the anomalies and advisories from the Kafka message bus and then export this data to the syslog server. With syslog support, even if you do not use Kafka, you will be able to export anomalies to your third-party tools.
Guidelines and Limitations for Syslog
If the syslog server is not operational at a certain time, messages generated during that downtime will not be received by a server after the server becomes operational.
Configure Syslog
Use the following procedure to configure syslog to enable exporting anomalies and advisories data to a syslog server:
-
Navigate to Admin > System Settings > Export Data.
-
In the Syslog area, click Add New.
-
In the Syslog Configuration dialog box, in the Credentials area, perform the following actions:
-
In the Site Name field, click Select Site and choose the site name.
-
In the IP Address and Port fields, enter the IP address and port details.
-
In the Transport field, from the drop-down list, choose the appropriate option. The choices are TCP, UDP, and SSL.
-
In the Facility field, from the drop-down list, choose the appropriate facility string.
A facility code is used to specify the type of system that is logging the message. For this feature, the local0-local7 keywords for locally used facility are supported.
-
-
In the Mode field, click the toggle button to choose between Unsecured and Secured SSL.
If you choose Secured SSL, you will be required to provide a server CA certificate.
-
In the Configuration area, enter a unique name for the syslog configuration for export.
-
In the Collection Settings area select the desired severity options.
The options available are Critical, Error, Warning, and Info. Major and Minor anomalies and advisories in Nexus Dashboard Insights are mapped to Error.
-
Click Save.
Export Flow Records To Network Attached Storage
Starting from Nexus Dashboard Insights Release 6.3.1, you can export flow records captured by Nexus Dashboard Insights on a remote Network Attached Storage (NAS) with NFS.
Nexus Dashboard Insights defines the directory structure on NAS where the flow records are exported.
You can export the flow records in Base or Full mode. In Base mode, only 5-tuple data for the flow record is exported. In Full mode the entire data for the flow record is exported.
Nexus Dashboard Insights requires read and write permission to NAS in order to export the flow record.A system issue is raised if Nexus Dashboard Insights fails to write to NAS.
Guidelines and Limitations
-
In order for Nexus Dashboard Insights to export the flow records to an external storage, the Network Attached Storage added to Nexus Dashboard must be exclusive for Nexus Dashboard Insights.
-
Network Attached Storage with Network File System (NFS) version 3 must be added to Nexus Dashboard.
-
Flow Telemetry, Netflow, and sflow records can be exported.
-
Export of FTE is not supported.
-
Average Network Attached Storage requirements for 2 years of data storage at 20k flows per sec:
-
Base Mode: 500 TB data
-
Full Mode: 2.8 PB data
-
-
If there is not enough disk space, new records will not be exported and an anomaly is generated.
Add Network Attached Storage to Export Flow Records
The workflow to add Network Attached Storage (NAS) to export flow records includes the following steps:
-
Add NAS to Nexus Dashboard.
-
Add the onboarded NAS on Nexus Dashboard to Nexus Dashboard Insights to enable export of flow records.
Add NAS to Nexus Dashboard
-
In Nexus Dashboard, navigate to Admin > System Settings > Network-Attached Storage.
-
Click Edit.
-
Click Add Network-Attached Storage.
-
Complete the following fields for Add Network-Attached Storage.
-
Select Read Write Type. Nexus Dashboard Insights requires read and write permission to export the flow record to NAS. A system issue is raised if Nexus Dashboard Insights fails to write to NAS.
-
In Nexus Dashboard Insights, navigate to Admin > System Settings > System Issues to view the system issue.
-
Enter the name of the Network Attached Storage.
-
Enter the IP address of the Network Attached Storage.
-
Enter the port number of the Network Attached Storage.
-
Enter the export path. Using the export path, Nexus Dashboard Insights creates the directory structure in NAS for exporting the flow records.
-
Enter the alert threshold time. Alert threshold is used to send an alert when the NAS is used beyond a certain limit.
-
Enter the storage limit in Mi/Gi.
-
Click Save.
Add the onboarded NAS to Nexus Dashboard Insights
-
In Nexus Dashboard Insights, navigate to Admin > System Settings > Export Data.
-
In the Network-Attached storage area, click Add New.
-
Complete the following fields for NAS Configuration.
-
Enter the name.
-
Select the NAS server added to Nexus Dashboard from the drop-down list.
-
Click Select Site to select a site. You can only select one site at a time.
-
Select the Collection Settings for the flow from the drop-down list. In Base mode, only 5-tuple data for the flow record is exported. In Full mode the entire data for the flow record is exported.
-
Click Save.
-
-
The traffic from the flows displayed in the Flows page is exported as a JSON file to the external NAS in the following directory hierarchy.
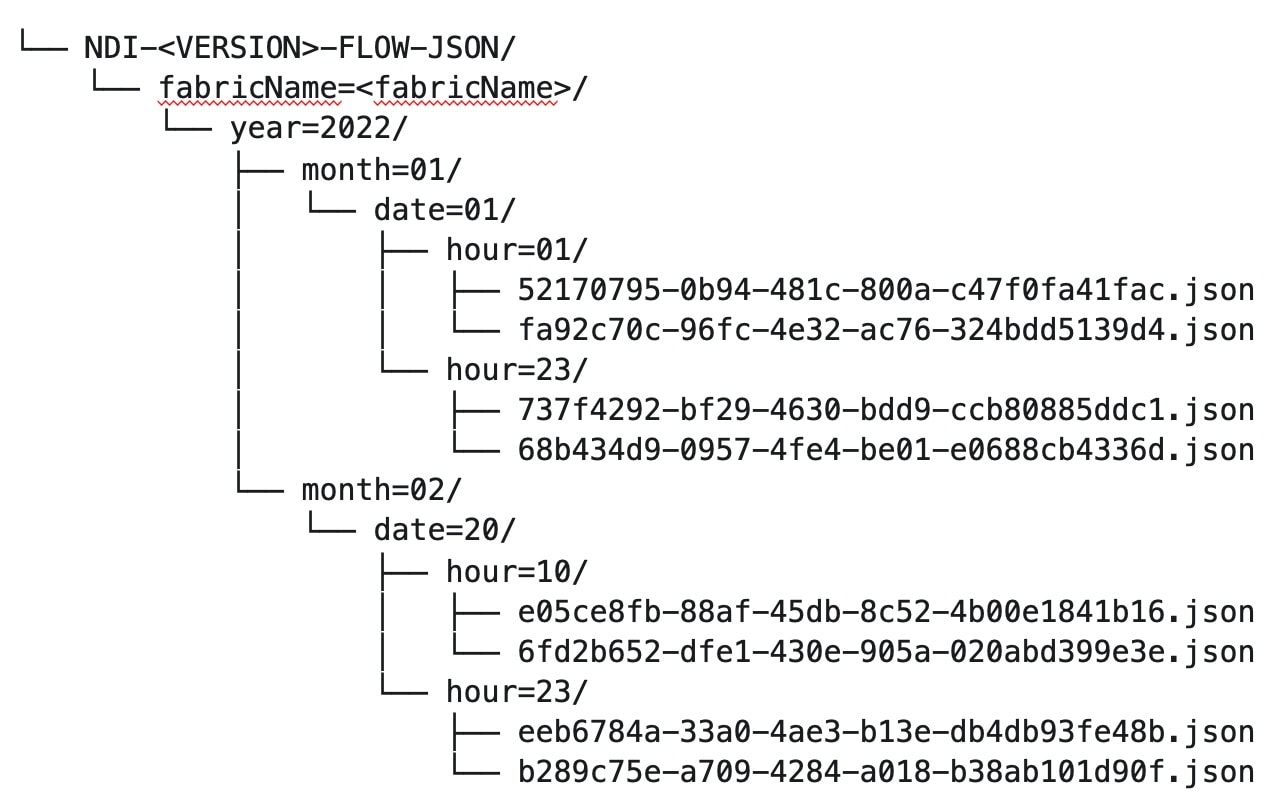
Navigate to Analyze > Flows to view the flows that will be exported.
-
Each flow record is written as a line delimited JSON.
JSON output file format for a flow record in base mode
{"fabricName":"myapic","terminalTs":1688537547433,"originTs":1688537530376,"srcIp":"2000:201:1:1::1","dstIp":"2000:201:1:1::3","srcPort":1231,"dstPort":1232,"ingressVrf":"vrf1","egressVrf":"vrf1","ingressTenant":"FSV1","egressTenant":"FSV1","protocol":"UDP"}

{"fabricName":"myapic","terminalTs":1688537547378,"originTs":1688537530377,"srcIp":"201.1.1.127","dstIp":"201.1.1.1","srcPort":0,"dstPort":0,"ingressVrf":"vrf1","egressVrf":"","ingressTenant":"FSV2","egressTenant":"","protocol":"ANY-HOST"}
JSON output file format for a flow record in full mode
{"fabricName":"myapic","terminalTs":1688538023562,"originTs":1688538010527,"srcIp":"201.1.1.121","dstIp":"201.1.1.127","srcPort":0,"dstPort":0,"ingressVrf":"vrf1","egressVrf":"vrf1","ingressTenant":"FSV2","egressTenant":"FSV2","protocol":"ANY-HOST","srcEpg":"ext-epg","dstEpg":"ext-epg1","latencyMax":0,"ingressVif":"eth1/15","ingressVni":0,"latency":0,"ingressNodes":"Leaf1-2","ingressVlan":0,"ingressByteCount":104681600,"ingressPktCount":817825,"ingressBurst":0,"ingressBurstMax":34768,"egressNodes":"Leaf1-2","egressVif":"po4", "egressVni":0,"egressVlan":0,"egressByteCount":104681600,"egressPktCount":817825,"egressBurst":0,"egressBurstMax":34768,"dropPktCount":0,"dropByteCount":0,"dropCode":"","dropScore":0,"moveScore":0,"latencyScore":0,"burstScore":0,"anomalyScore":0,"hashCollision":false,"dropNodes":"[]","nodeNames":"[\"Leaf1-2\"]","nodeIngressVifs":"[\"Leaf1-2,eth1/15\"]","nodeEgressVifs":"[\"Leaf1-2,po4\"]“ ,"srcMoveCount":0,"dstMoveCount":0,"moveCount":0,"prexmit":0,"rtoOutside":false,"events":"[[\\\"1688538010527,Leaf1-2,0,3,1,no,no,eth1/15,,po4,po4,,,,,0,64,0,,,,,,,,\\\"]]"}
JSON output file format for a flow record in base mode (5 tuple)
{"fabricName":"myapic","terminalTs":1688537547433,"originTs":1688537530376,"srcIp":"2000:201:1:1::1","dstIp":"2000:201:1:1::3","srcPort":1231,"dstPort":1232,"ingressVrf":"vrf1","egressVrf":"vrf1","ingressTenant":"FSV1","egressTenant":"FSV1","protocol":"UDP"}
System Settings
System Issues
System issues are problems that may affect the Nexus Dashboard Insights directly and they are raised for system related issues such as connectivity issues, status upgrade, onboarding configurations. The categories for system include Connectivity system issue and Collection system issue.
View System Issues
-
Navigate to Admin > System Settings > System Issues.
-
Use the search bar to filter the system issues.
-
The System Issues table displays the filtered system issues.
-
Click the gear icon to configure the columns in the System Issues table.
-
Click a System Issues to view the additional details such as What’s wrong?, What’s the impact?, and How do I fix it?.
System Status
The System Status page displays the collection status for your site for the last hour.
Nexus Dashboard Insights processes your sites telemetry and displays the status for the following jobs or services.
-
Site
-
Node
-
Assurance
-
Capacity
-
Hardware Resources
-
Statistics
-
Endpoints
-
Bug Scan
-
Best Practices
-
Telemetry Configuration Status
View System Status
-
Navigate to Admin > System Settings > System Status Details.
OR
-
Navigate to Manage > Sites
-
Select a site.
-
In the Sites page, from the Actions drop-down menu, select System Status.
In Endpoints column of the status table, a value of "No Data" can indicate there were no changes in the endpoint count in the last hour. This value does not necessarily indicate that there is an issue.
Import and Export of Configurations
The import and export of configurations feature enables you import and export the following configurations in Nexus Dashboard Insights:
-
Flow Collection Mode
-
Flow Telemetry
-
Traffic Analytics
-
Microburst
-
Anomaly Rules
-
Compliance
-
Export Settings
-
Email
-
Message Bus Configurations
-
Syslog
-
Network Attached Storage (NAS)
-
Flow Rules
-
User Preferences
-
Integrations
Only an administrator can manage all operations for configuration import and export.
Guidelines and Limitations
-
You must be an administrator user to import or export a configuration.
-
Snapshot sites are not supported.
-
Running more than one import job simultaneously could yield unpredictable results and is not supported. Perform only one import job at a time.
-
Importing a configuration appends the existing configuration in Nexus Dashboard Insights.
-
Importing a configuration does not affect existing anomalies, and existing assurance analyses. Existing anomalies continue to exist after importing a configuration.
-
The online site must be onboarded on Nexus Dashboard Insights first with the same name as that in the exported configuration tar.gz file before importing all the configuration.
-
Only the configurations local to Nexus Dashboard cluster is exported, and the configurations of remote Nexus Dashboard cluster is not exported.
-
Export Settings import will fail if Nexus Dashboard Insights is not connected to Cisco Intersight. Nexus Dashboard Insights must be connected to Cisco Intersight before importing Export Settings.
-
Import of any secured configuration that have certificates or passwords is not supported.
-
The following behaviors are observed when configurations are exported from releases prior to Nexus Dashboard Insights release 6.3.1:
-
Import of Anomaly Rules with categories and severities that are deprecated in Nexus Dashboard Insights release 6.3.1 are not supported.
-
Export of fast kafka in Message Bus configuration is not supported.
-
Exporting a Configuration
-
Navigate to Admin > Configuration Import/Export.
-
Click Create Configuration Import/Export.
-
In the Create Configuration Import/Export page, click Export.
-
Click Start .All the configurations available in Nexus Dashboard Insights are exported. All the existing configurations on the host, which includes, Sites , Alert Rules, Compliance, Export Settings, Flow Rules, Integrations, and User Preferences are exported.
-
The Configuration Import/Export table displays information of the exported files such as status, type, start time, last update time, and content.
-
Click the ellipse icon and choose Download once the export job status has moved to Completed. The exported configuration is downloaded as a compressed file.
-
Click the ellipse icon and choose Delete to delete the configuration.
Importing a Configuration
-
Navigate to Admin > Configuration Import/Export.
-
Click Create Configuration Import/Export.
-
In the Create Configuration Import/Export page, click Import.
-
Select the downloaded compressed tar.gz configuration file and click Start. The import job details are displayed in the Configuration Import/Export table.
-
Click the ellipse icon and choose Apply once the import job status has moved to Validated.
-
Select the configurations to import and click Apply The Configuration Import/Export table displays the details of the imported configuration.
When the status of the import job status is Partially Failed, some of the configurations would be added and some would be skipped due to failures. To view the reasons for the failure hover the mouse over the status column.
Copyright
THE SPECIFICATIONS AND INFORMATION REGARDING THE PRODUCTS IN THIS MANUAL ARE SUBJECT TO CHANGE WITHOUT NOTICE. ALL STATEMENTS, INFORMATION, AND RECOMMENDATIONS IN THIS MANUAL ARE BELIEVED TO BE ACCURATE BUT ARE PRESENTED WITHOUT WARRANTY OF ANY KIND, EXPRESS OR IMPLIED. USERS MUST TAKE FULL RESPONSIBILITY FOR THEIR APPLICATION OF ANY PRODUCTS.
THE SOFTWARE LICENSE AND LIMITED WARRANTY FOR THE ACCOMPANYING PRODUCT ARE SET FORTH IN THE INFORMATION PACKET THAT SHIPPED WITH THE PRODUCT AND ARE INCORPORATED HEREIN BY THIS REFERENCE. IF YOU ARE UNABLE TO LOCATE THE SOFTWARE LICENSE OR LIMITED WARRANTY, CONTACT YOUR CISCO REPRESENTATIVE FOR A COPY.
The Cisco implementation of TCP header compression is an adaptation of a program developed by the University of California, Berkeley (UCB) as part of UCB’s public domain version of the UNIX operating system. All rights reserved. Copyright © 1981, Regents of the University of California.
NOTWITHSTANDING ANY OTHER WARRANTY HEREIN, ALL DOCUMENT FILES AND SOFTWARE OF THESE SUPPLIERS ARE PROVIDED “AS IS" WITH ALL FAULTS. CISCO AND THE ABOVE-NAMED SUPPLIERS DISCLAIM ALL WARRANTIES, EXPRESSED OR IMPLIED, INCLUDING, WITHOUT LIMITATION, THOSE OF MERCHANTABILITY, FITNESS FOR A PARTICULAR PURPOSE AND NONINFRINGEMENT OR ARISING FROM A COURSE OF DEALING, USAGE, OR TRADE PRACTICE.
IN NO EVENT SHALL CISCO OR ITS SUPPLIERS BE LIABLE FOR ANY INDIRECT, SPECIAL, CONSEQUENTIAL, OR INCIDENTAL DAMAGES, INCLUDING, WITHOUT LIMITATION, LOST PROFITS OR LOSS OR DAMAGE TO DATA ARISING OUT OF THE USE OR INABILITY TO USE THIS MANUAL, EVEN IF CISCO OR ITS SUPPLIERS HAVE BEEN ADVISED OF THE POSSIBILITY OF SUCH DAMAGES.
Any Internet Protocol (IP) addresses and phone numbers used in this document are not intended to be actual addresses and phone numbers. Any examples, command display output, network topology diagrams, and other figures included in the document are shown for illustrative purposes only. Any use of actual IP addresses or phone numbers in illustrative content is unintentional and coincidental.
The documentation set for this product strives to use bias-free language. For the purposes of this documentation set, bias-free is defined as language that does not imply discrimination based on age, disability, gender, racial identity, ethnic identity, sexual orientation, socioeconomic status, and intersectionality. Exceptions may be present in the documentation due to language that is hardcoded in the user interfaces of the product software, language used based on RFP documentation, or language that is used by a referenced third-party product.
Cisco and the Cisco logo are trademarks or registered trademarks of Cisco and/or its affiliates in the U.S. and other countries. To view a list of Cisco trademarks, go to this URL: http://www.cisco.com/go/trademarks. Third-party trademarks mentioned are the property of their respective owners. The use of the word partner does not imply a partnership relationship between Cisco and any other company. (1110R)
© 2017-2024 Cisco Systems, Inc. All rights reserved.