
First Published: 2024-02-23
Americas Headquarters
Cisco Systems, Inc.
170 West Tasman Drive
San Jose, CA 95134-1706
USA
http://www.cisco.com
Tel: 408 526-4000
800 553-NETS (6387)
Fax: 408 527-0883
New and Changed Information
The following table provides an overview of the significant changes up to the current release. The table does not provide an exhaustive list of all changes or of the new features up to this release.
| Feature | Description | Release | Where Documented |
|---|---|---|---|
|
Sustainability Report for PDUs |
If you have Panduit PDUs onboarded to Nexus Dashboard, Sustainability Report for PDUs gives you insight into how much electricity your devices and/or Panduit PDUs are using. |
6.4.1 |
|
|
ToR role support |
Layer 2 ToR devices connected within a NDFC onboarded fabric are supported in Connectivity Analysis. |
6.4.1 |
|
|
Connectivity Analysis improved job times |
The time taken by the connectivity analysis jobs in the NX-OS fabrics has been reduced. |
6.4.1 |
|
|
Health Resource enhancements |
Delta analysis now performs an object delta rather than a count delta. So along with the count, you can now view how many anomalies were cleared, how many are unchanged and how many are new anomalies. |
6.4.1 |
This document is available from your Nexus Dashboard Insights GUI as well as online at www.cisco.com. For the latest version of this document, visit Cisco Nexus Dashboard Insights Documentation.
Sustainability Report
Sustainability Report
Sustainability Report
Cisco Nexus Dashboard Insights Sustainability report helps you monitor, predict, and improve your network’s energy usage, its related carbon emissions, and its total energy cost. Sustainability report enables you to get insights on energy utilization, CO2 emissions, and energy cost for all your sites on a monthly basis.
The report is generated by calculating the monthly values for Power Consumption and by summing the usage data across all of your devices at each of your sites for every single day in the selected month. This data is then combined with our third-party services such as Electricity Maps to provide greater insight into what that usage means in terms of energy cost, estimated emissions, and estimated switch power consumption.
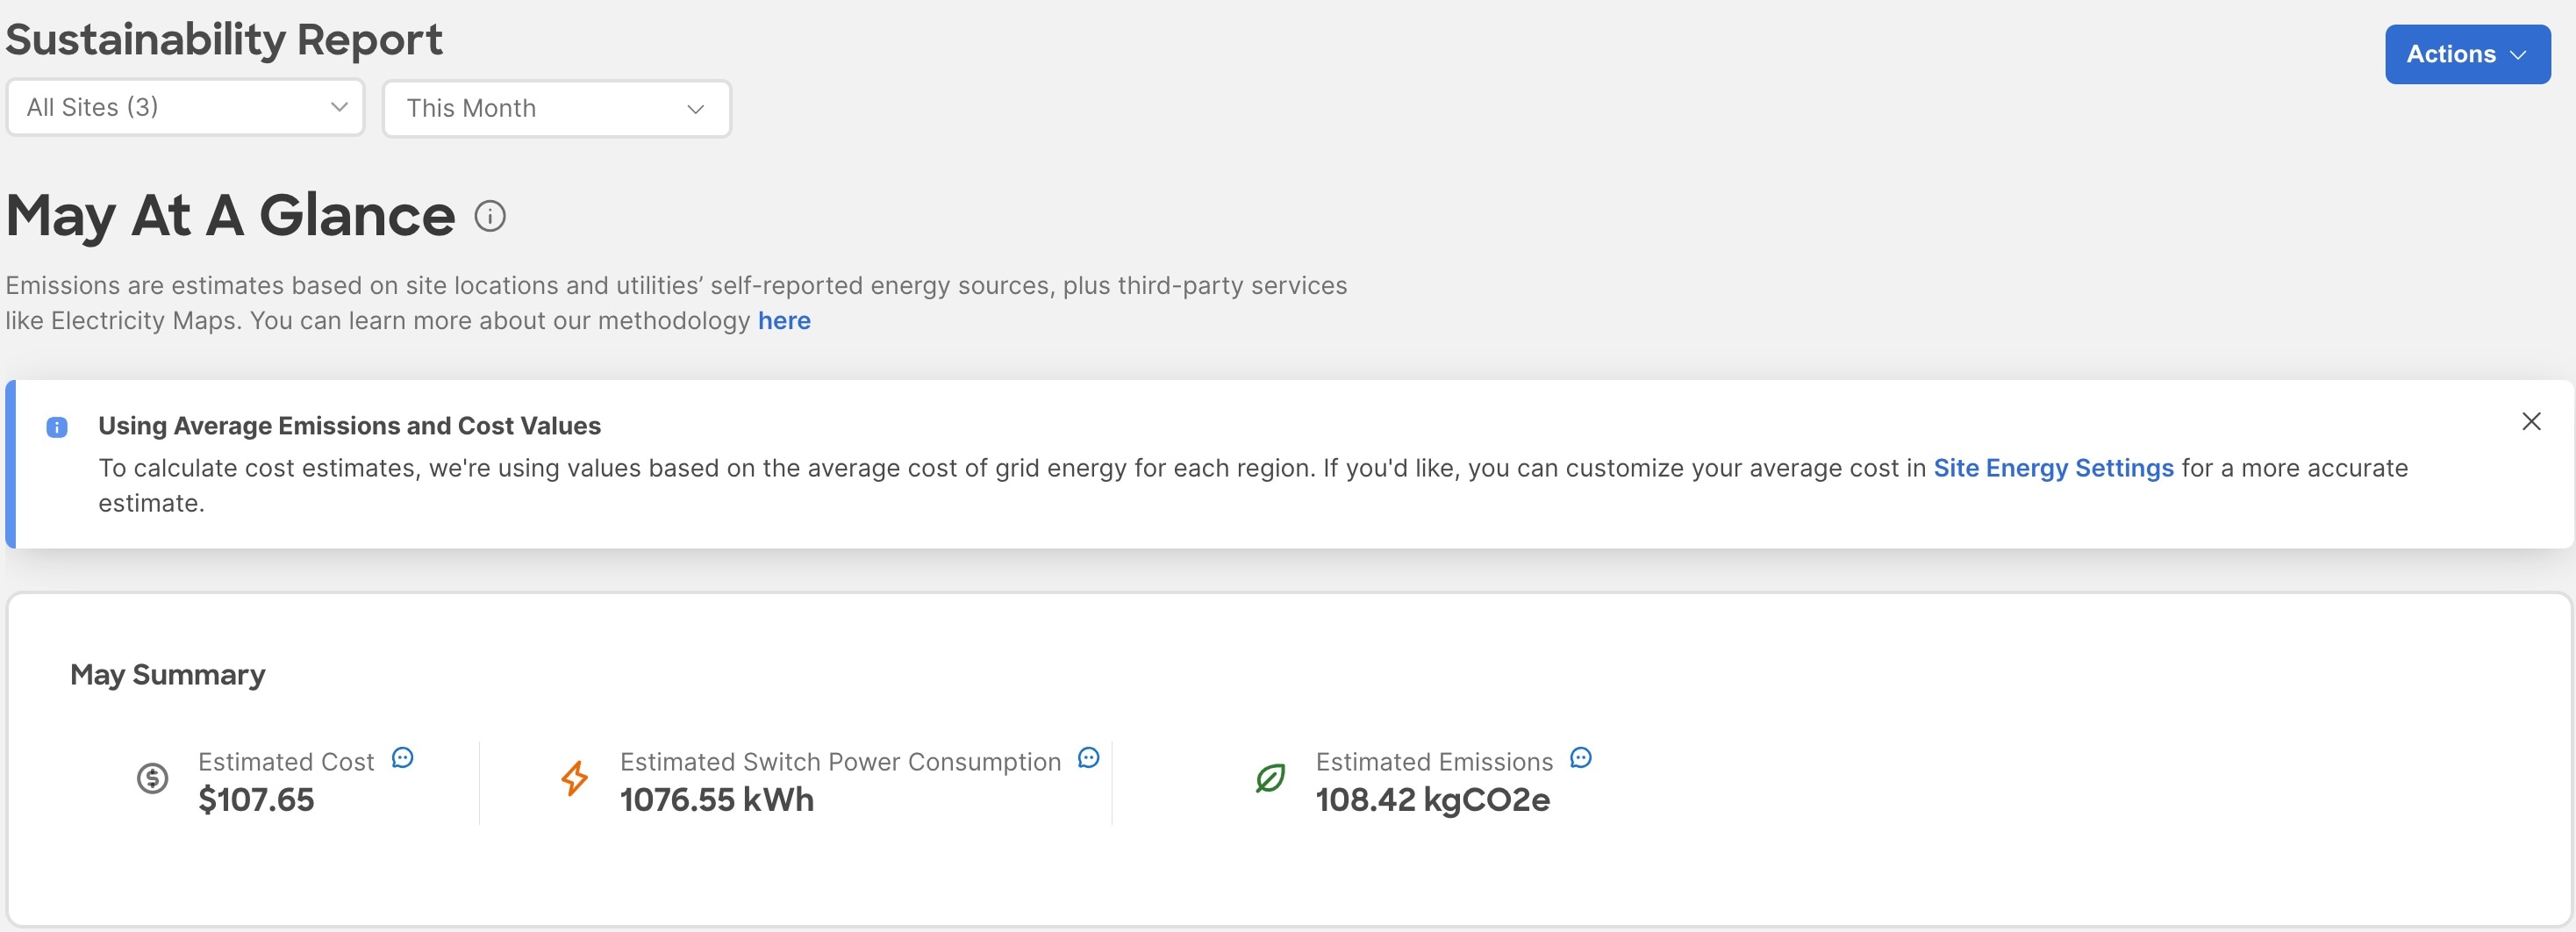
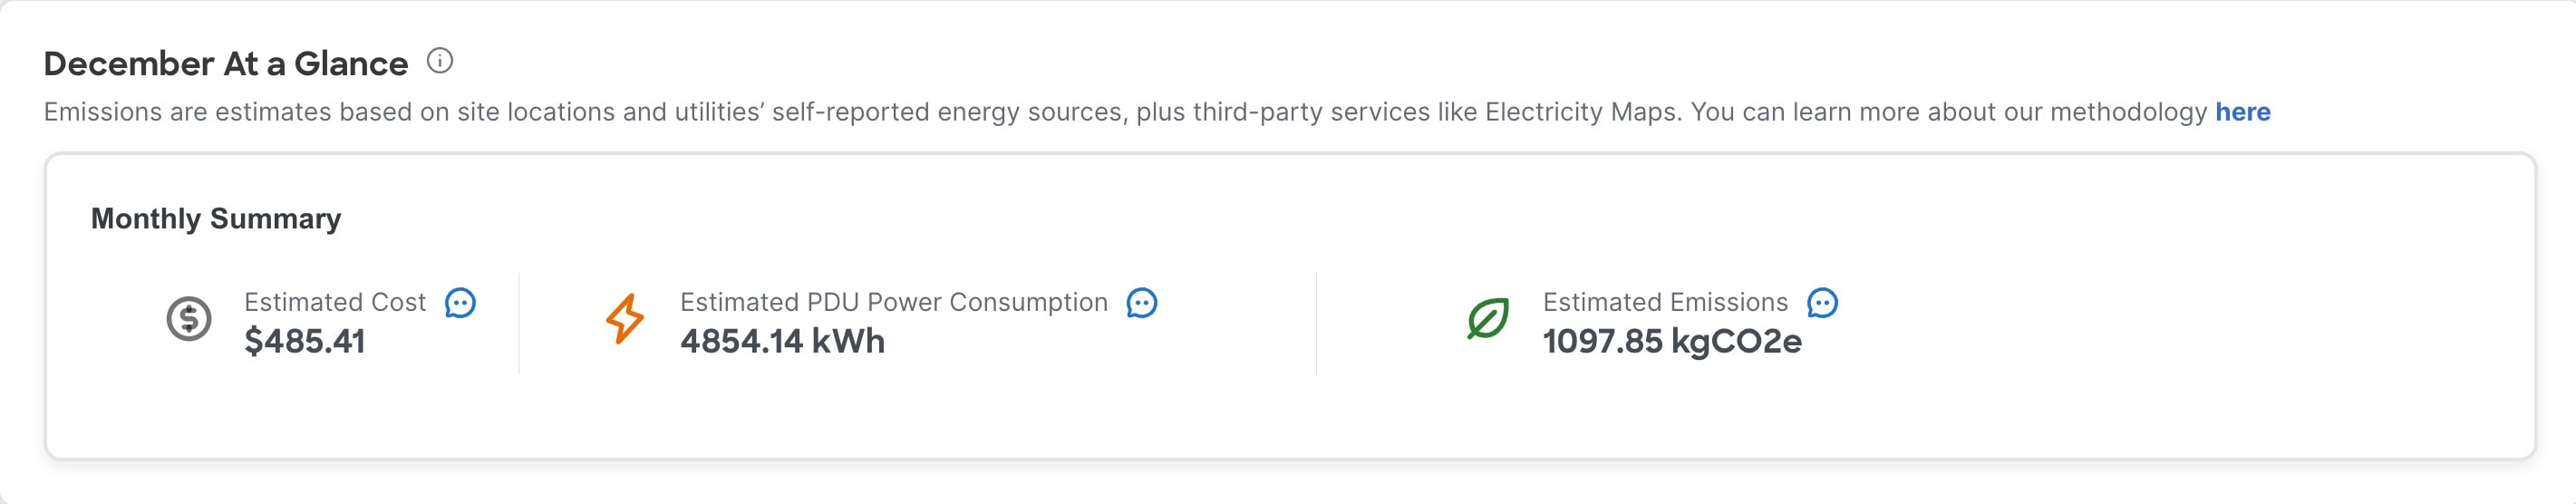
The summary area of the report contains information such as estimated cost, estimated switch power consumption, sources of emission, and estimated emissions.
-
Estimated Cost gives you insight into any expected increase or decrease in your sites’ energy bills based on your monthly energy use.
-
Estimated Switch Power Consumption gives you insight into how efficiently your switches are using electricity. Estimated PDU Power Consumption gives you insight into how much electricity your devices and/or Panduit PDUs are using.
-
Estimated Emissions gives you insight into the sustainability your sites have on your total CO2 emissions, based on the sources and amount of energy used.
If you have Panduit PDUs onboarded to Nexus Dashboard, you can use the Data Source toggle to see two different electricity values on Sustainability Report - one for Switches only, and one for PDUs.
-
Switch Data - Uses only the electricity data reported by individual switches added to a site.
-
PDU Data - Uses the electricity data reported by a supported PDU, which could include switches, fans, and any other devices physically plugged into the PDU.
Depending on which value you choose in the Data Source toggle, the values calculated for your other metrics, including estimated cost and emissions, will vary.

The retention time for Sustainability Report in Nexus Dashboard Insights is 12 months.
View Sustainability Report
-
Navigate to Analyze > Analysis Hub > Sustainability Report.
-
Select an online site or multiple online sites from the dropdown menu.
-
Select a time range from the dropdown menu.
-
Use the Data Source toggle to display data from switches.
-
Click Prepare Report.
Sustainability report displays At A Glance, Cost, Energy, and Emissions information for a particular site in the selected month.
-
The At A Glance area displays summary of the estimated cost, estimated switch power consumption, and estimated emissions in the selected month. Click the Learn More icon for more information.
-
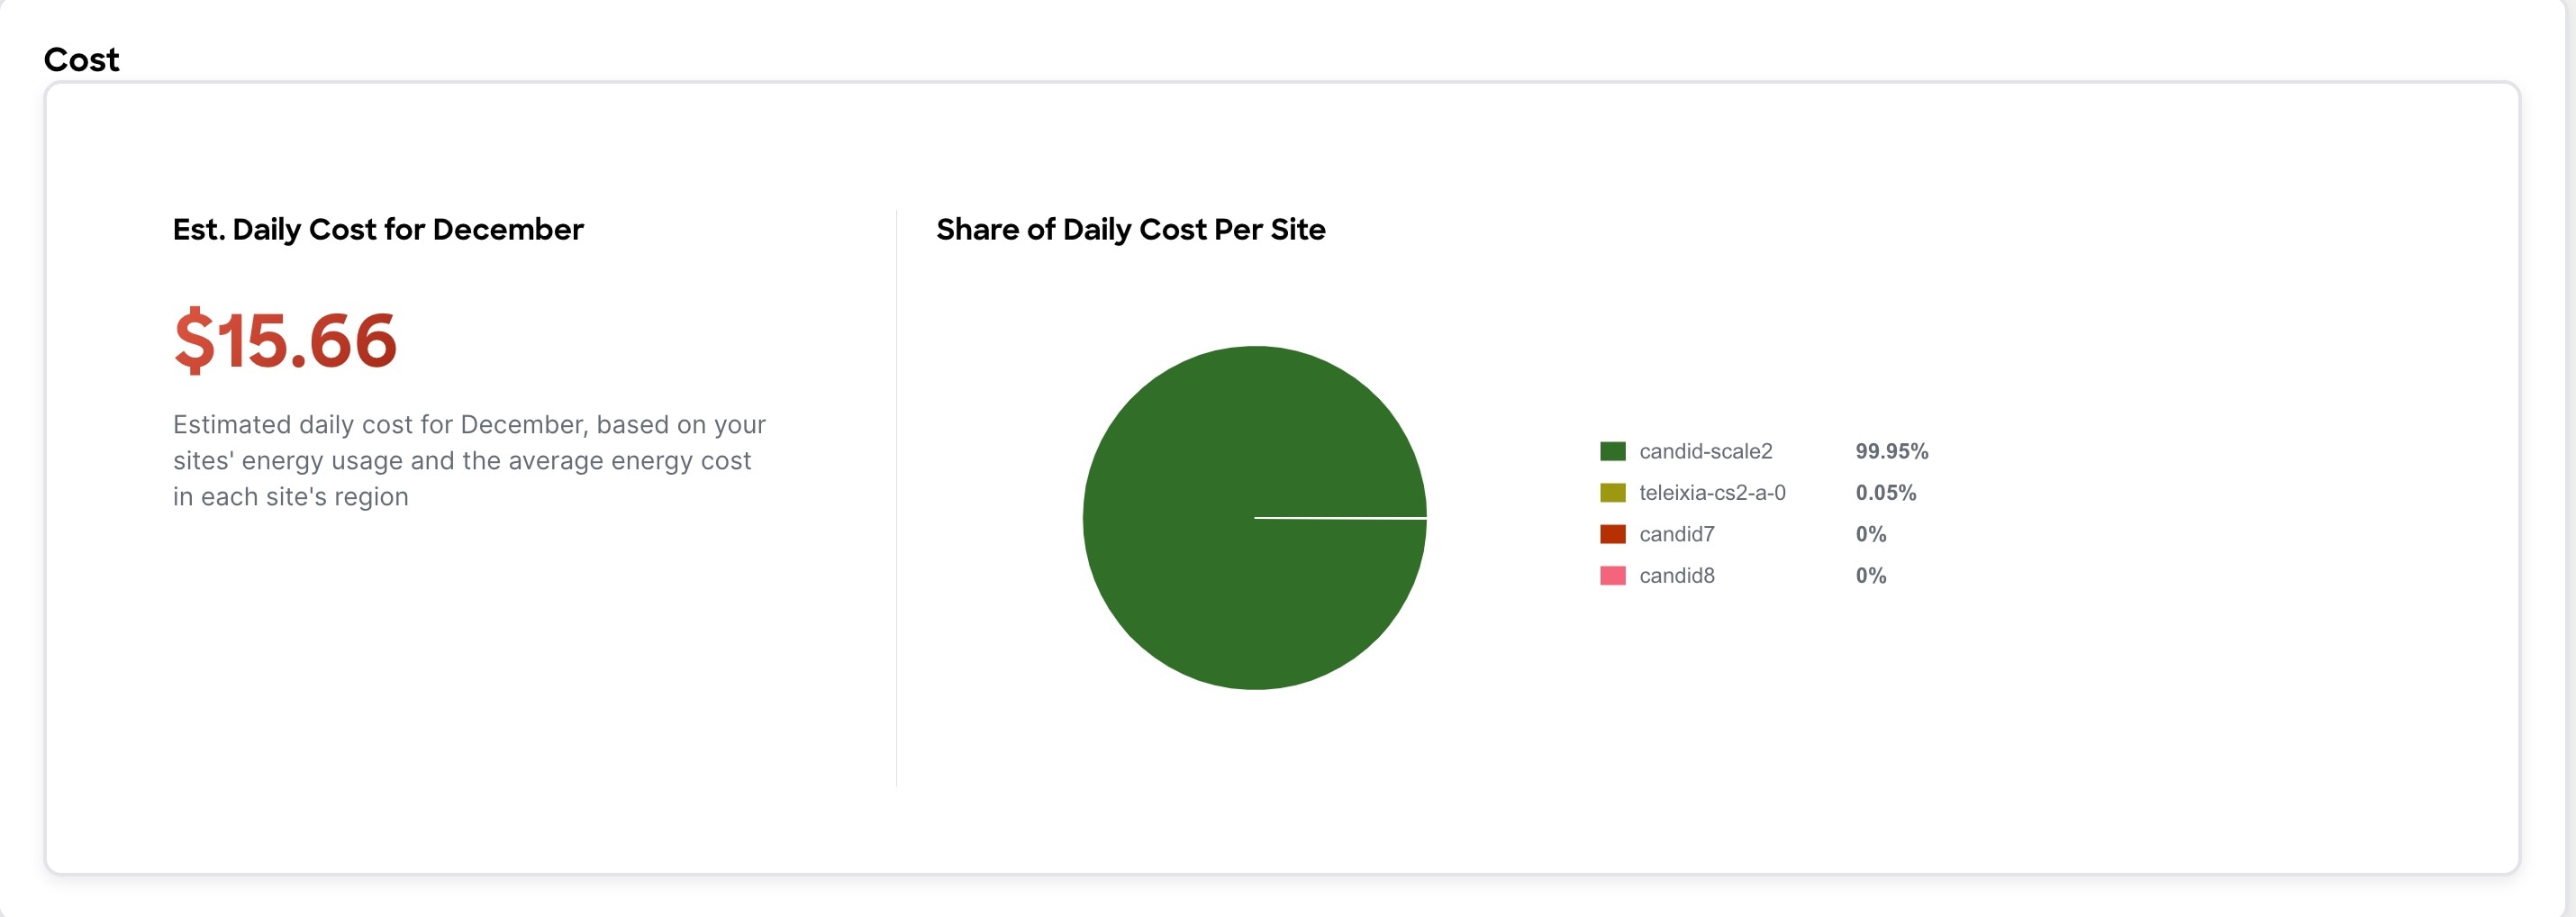
The Cost area displays the estimated daily cost in the selected month and share of daily cost per site.
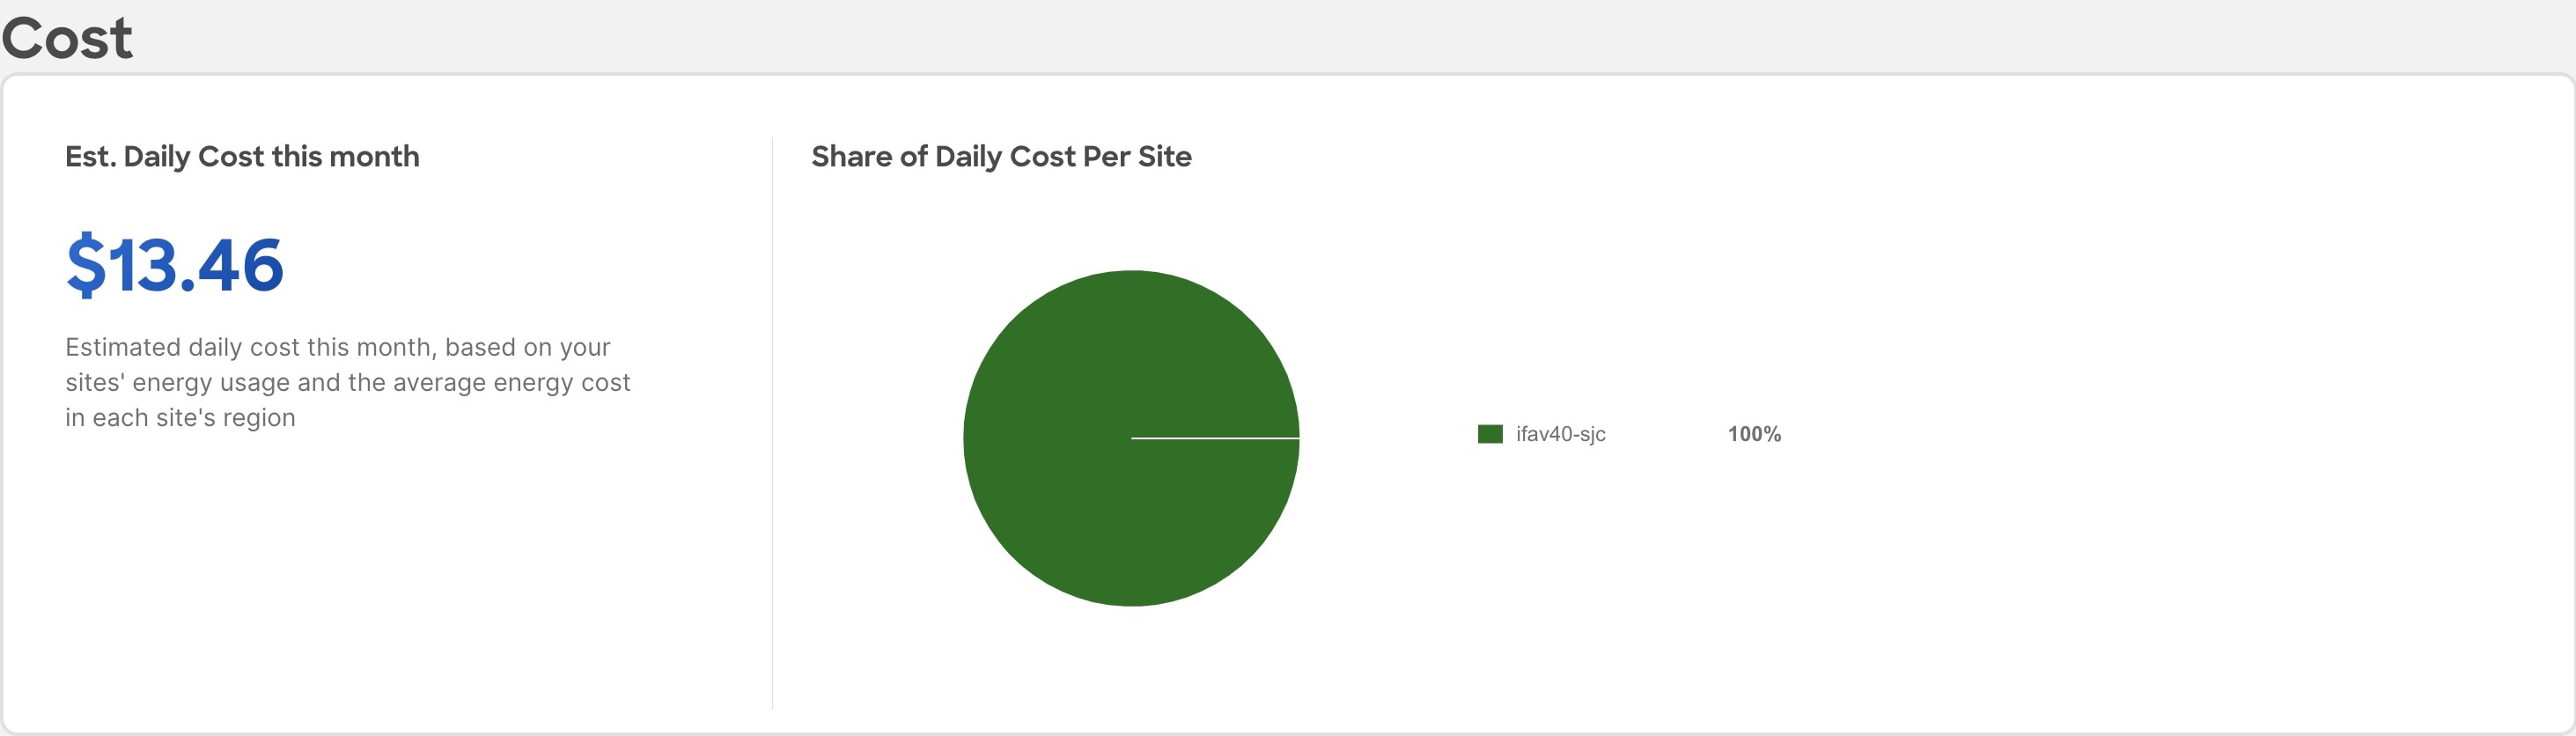
-
To calculate cost estimates Nexus Dashboard Insights uses values based on the average cost of grid energy for each region. From the Actions menu, select Site Energy Settings to customize your average cost for the current month for a more accurate estimate. In the Site Energy Settings page, you can update the cost for a particular site for the current month.
-
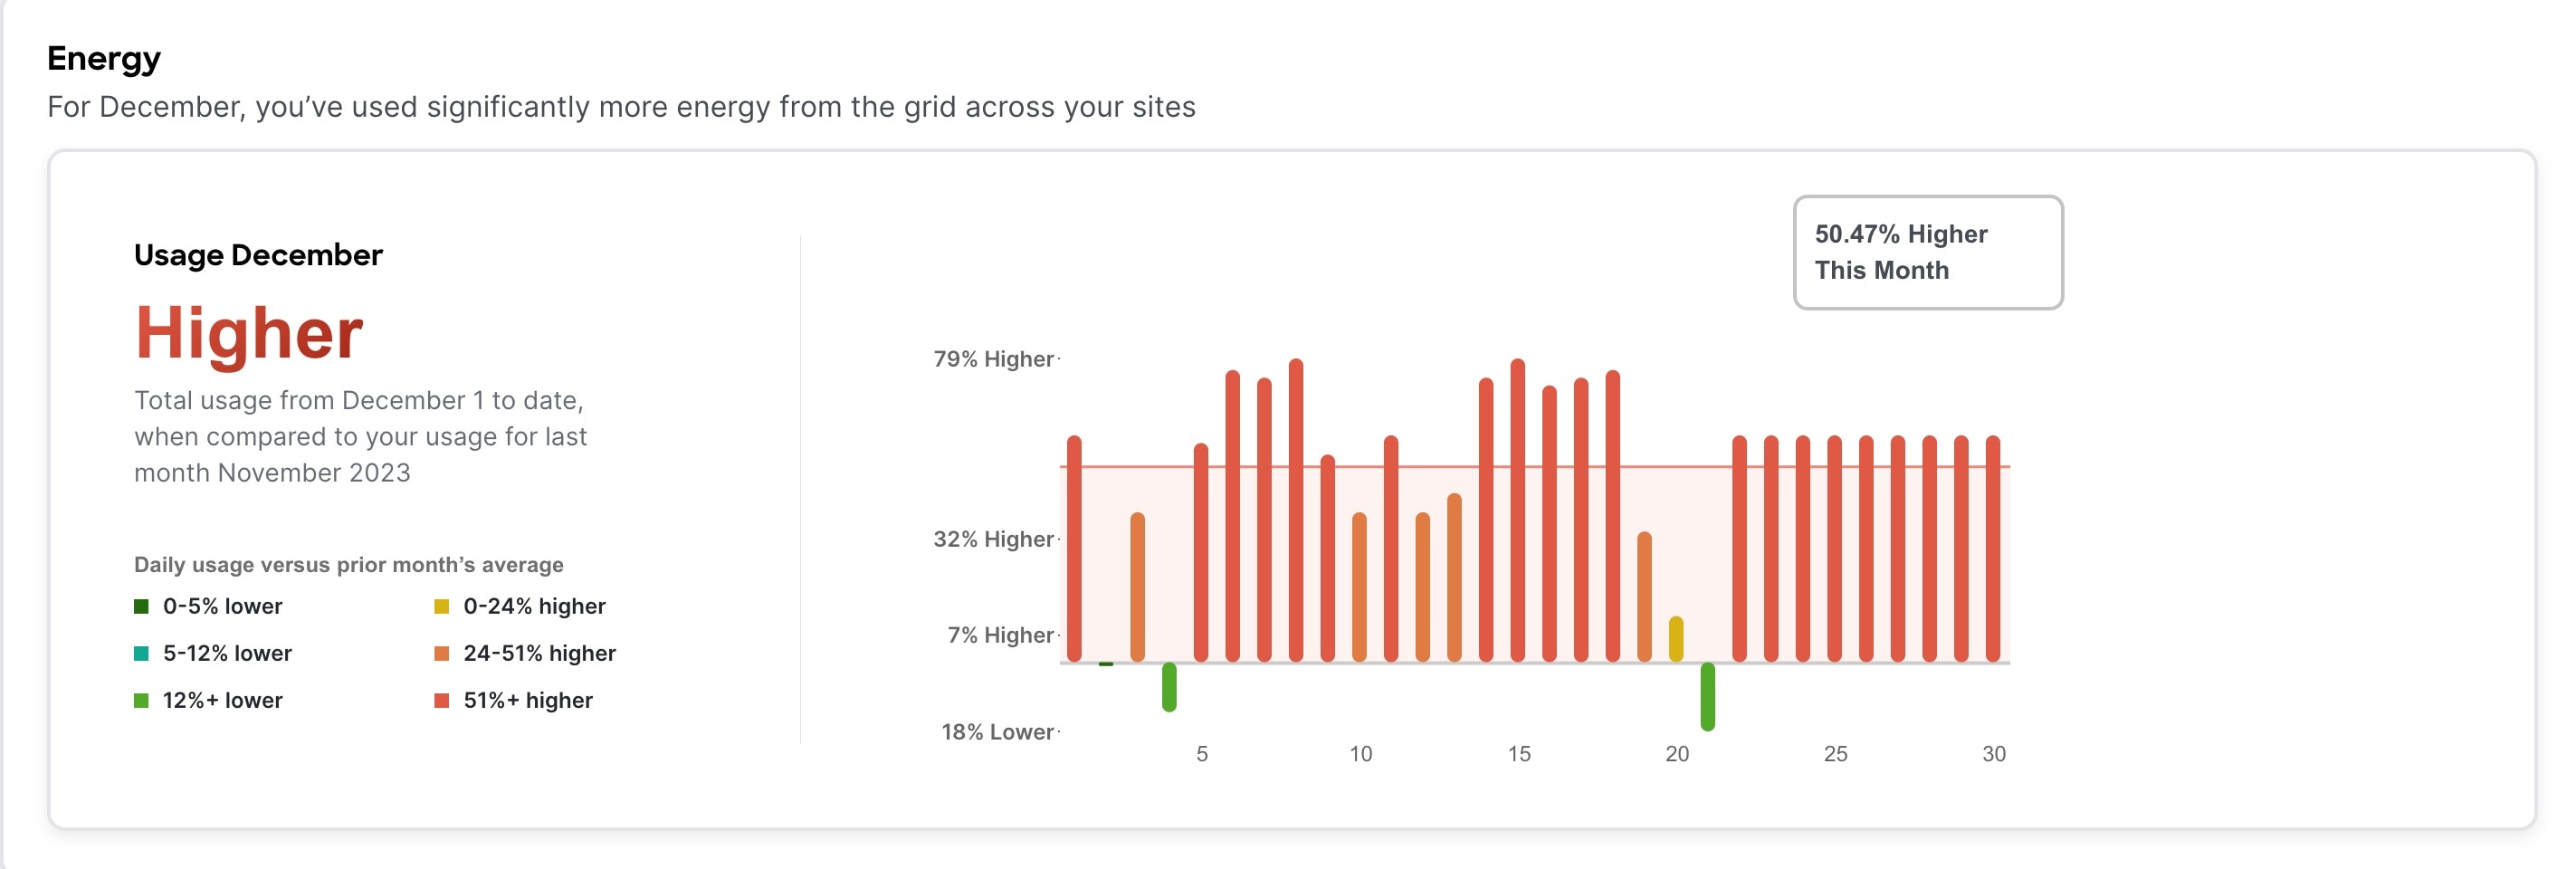
The Energy area displays the energy usage in the selected month in kWh.
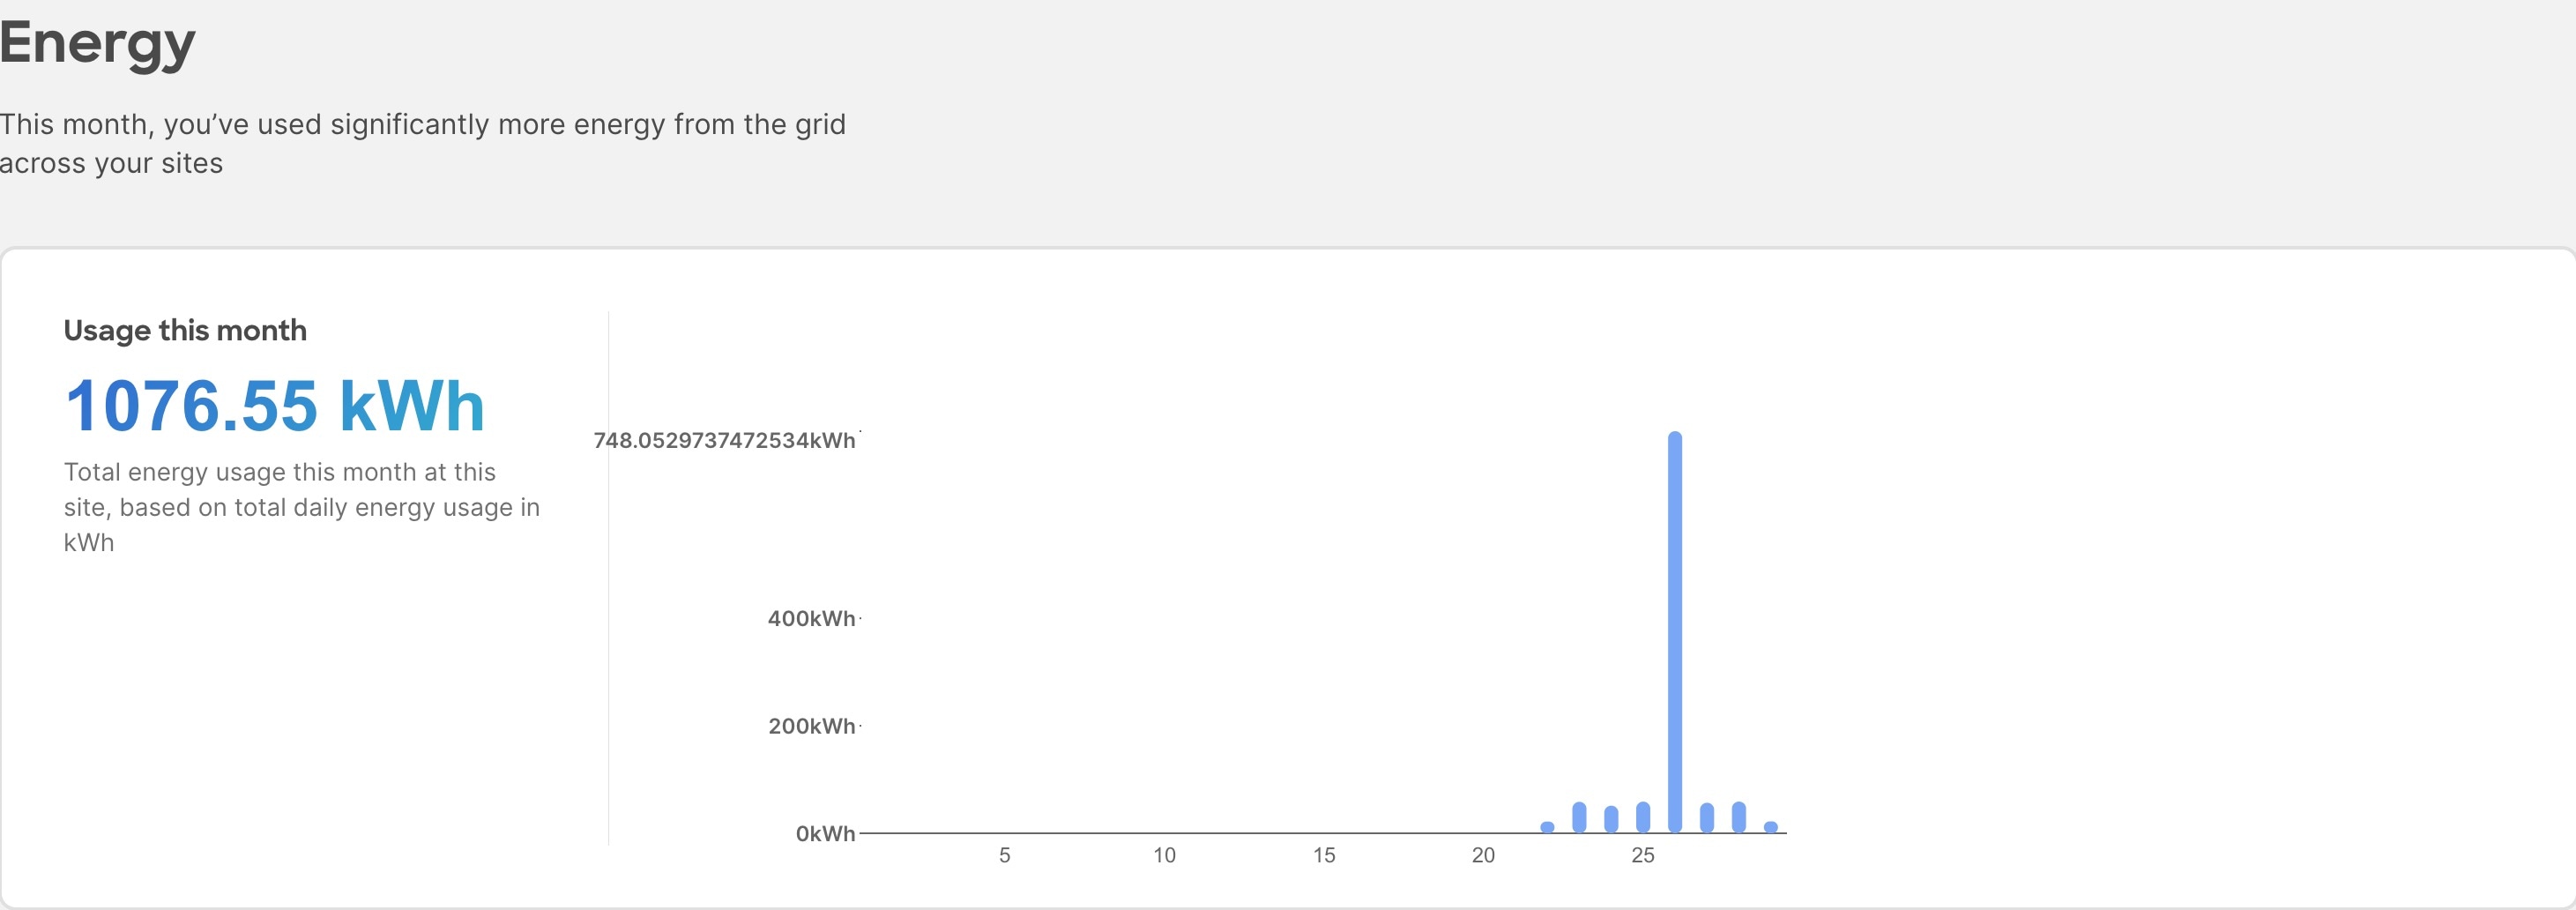
-
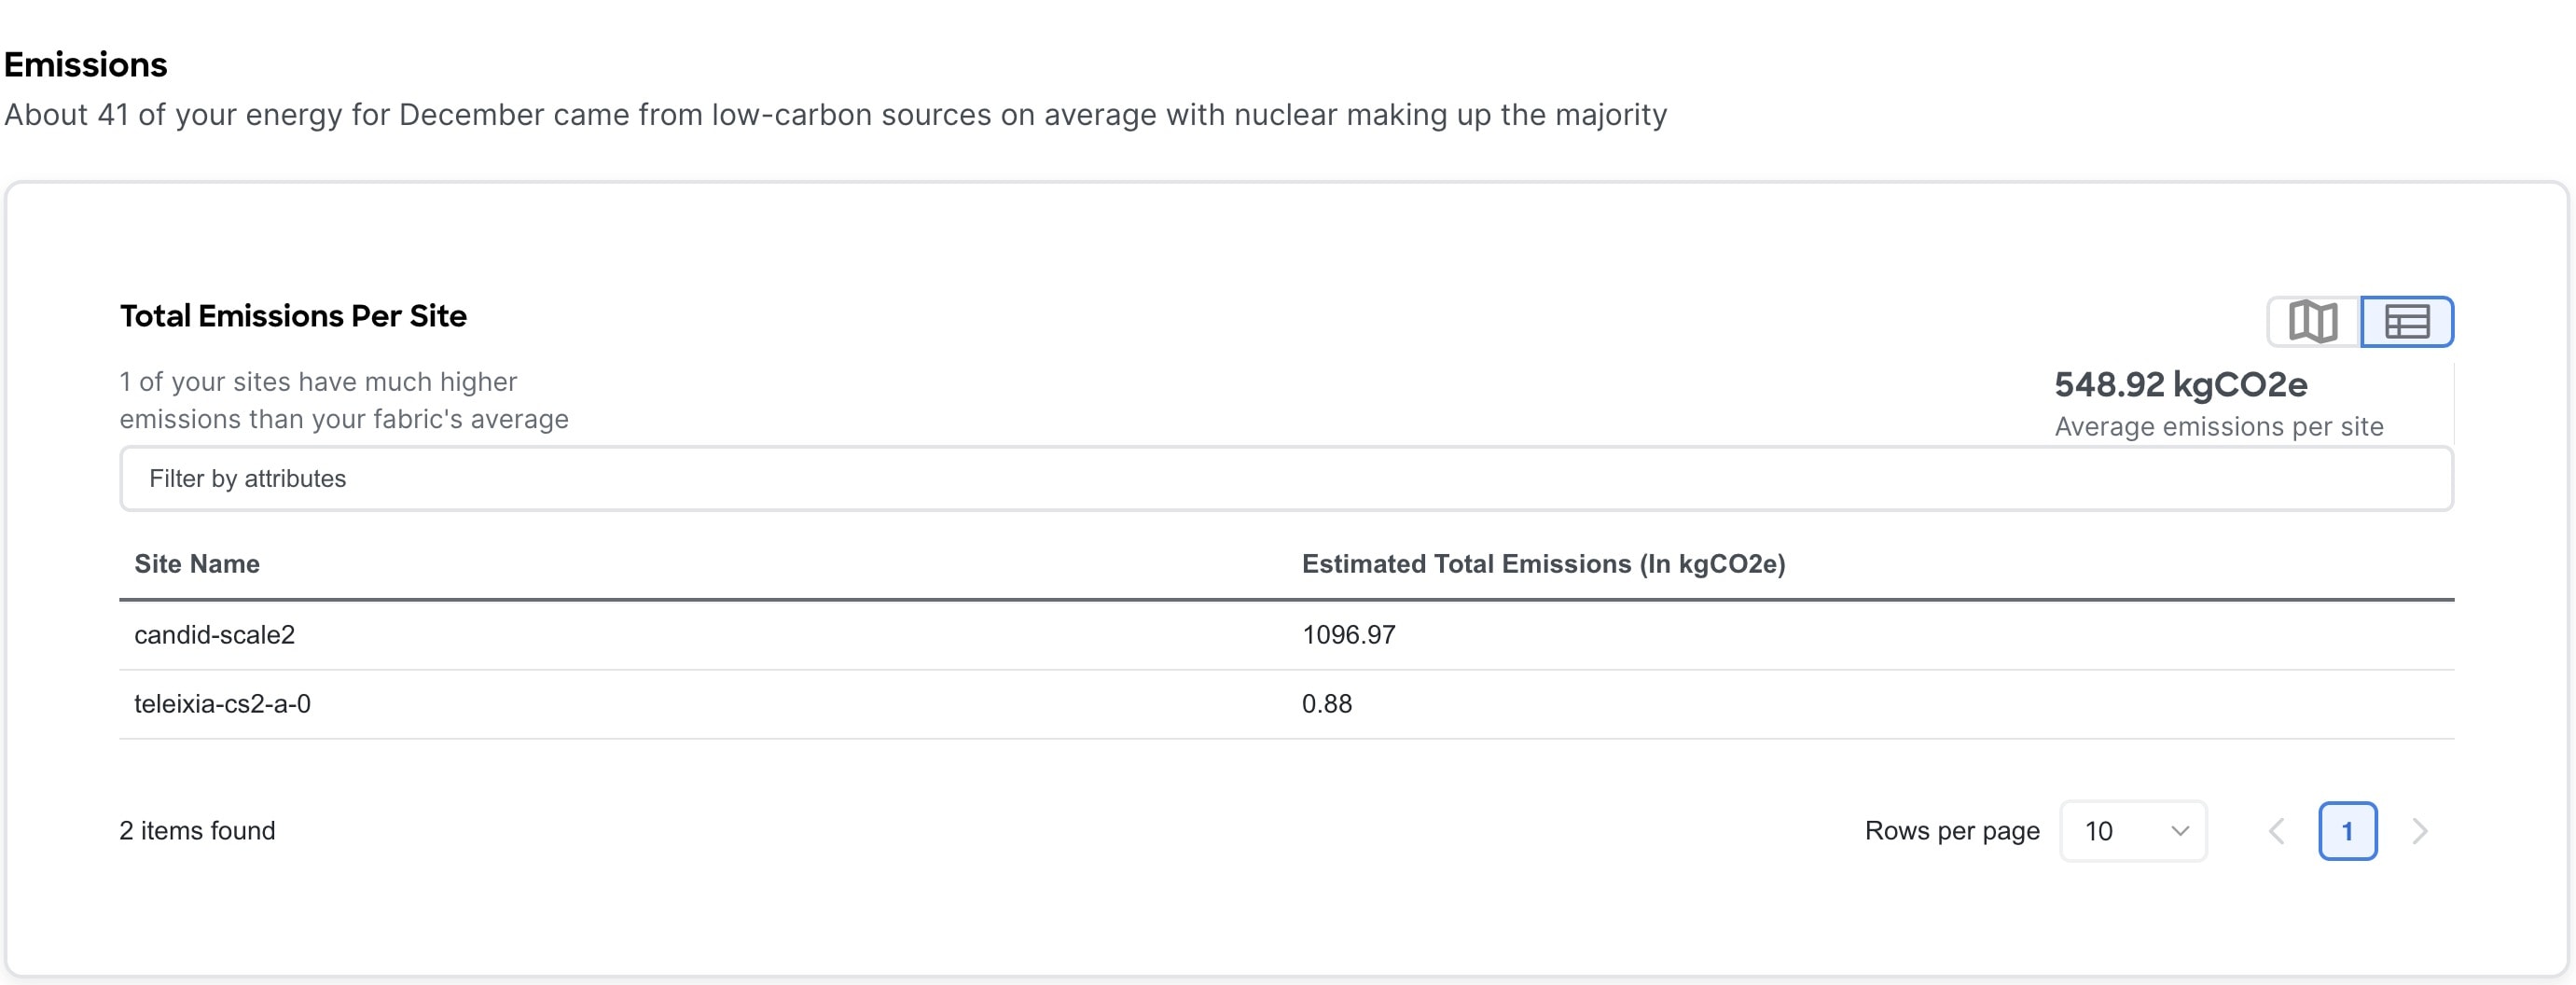
The Emissions area displays the Total emissions or Efficiency Index per site, estimated monthly carbon dioxide equivalent emissions, average percentage of energy from low-carbon sources and other sources, and percent of total energy used during each three-hour reporting period by source, over all of the days in the selected month.
For Total emissions or Efficiency Index per site use toggle to view the information in graphical format or tabular format.
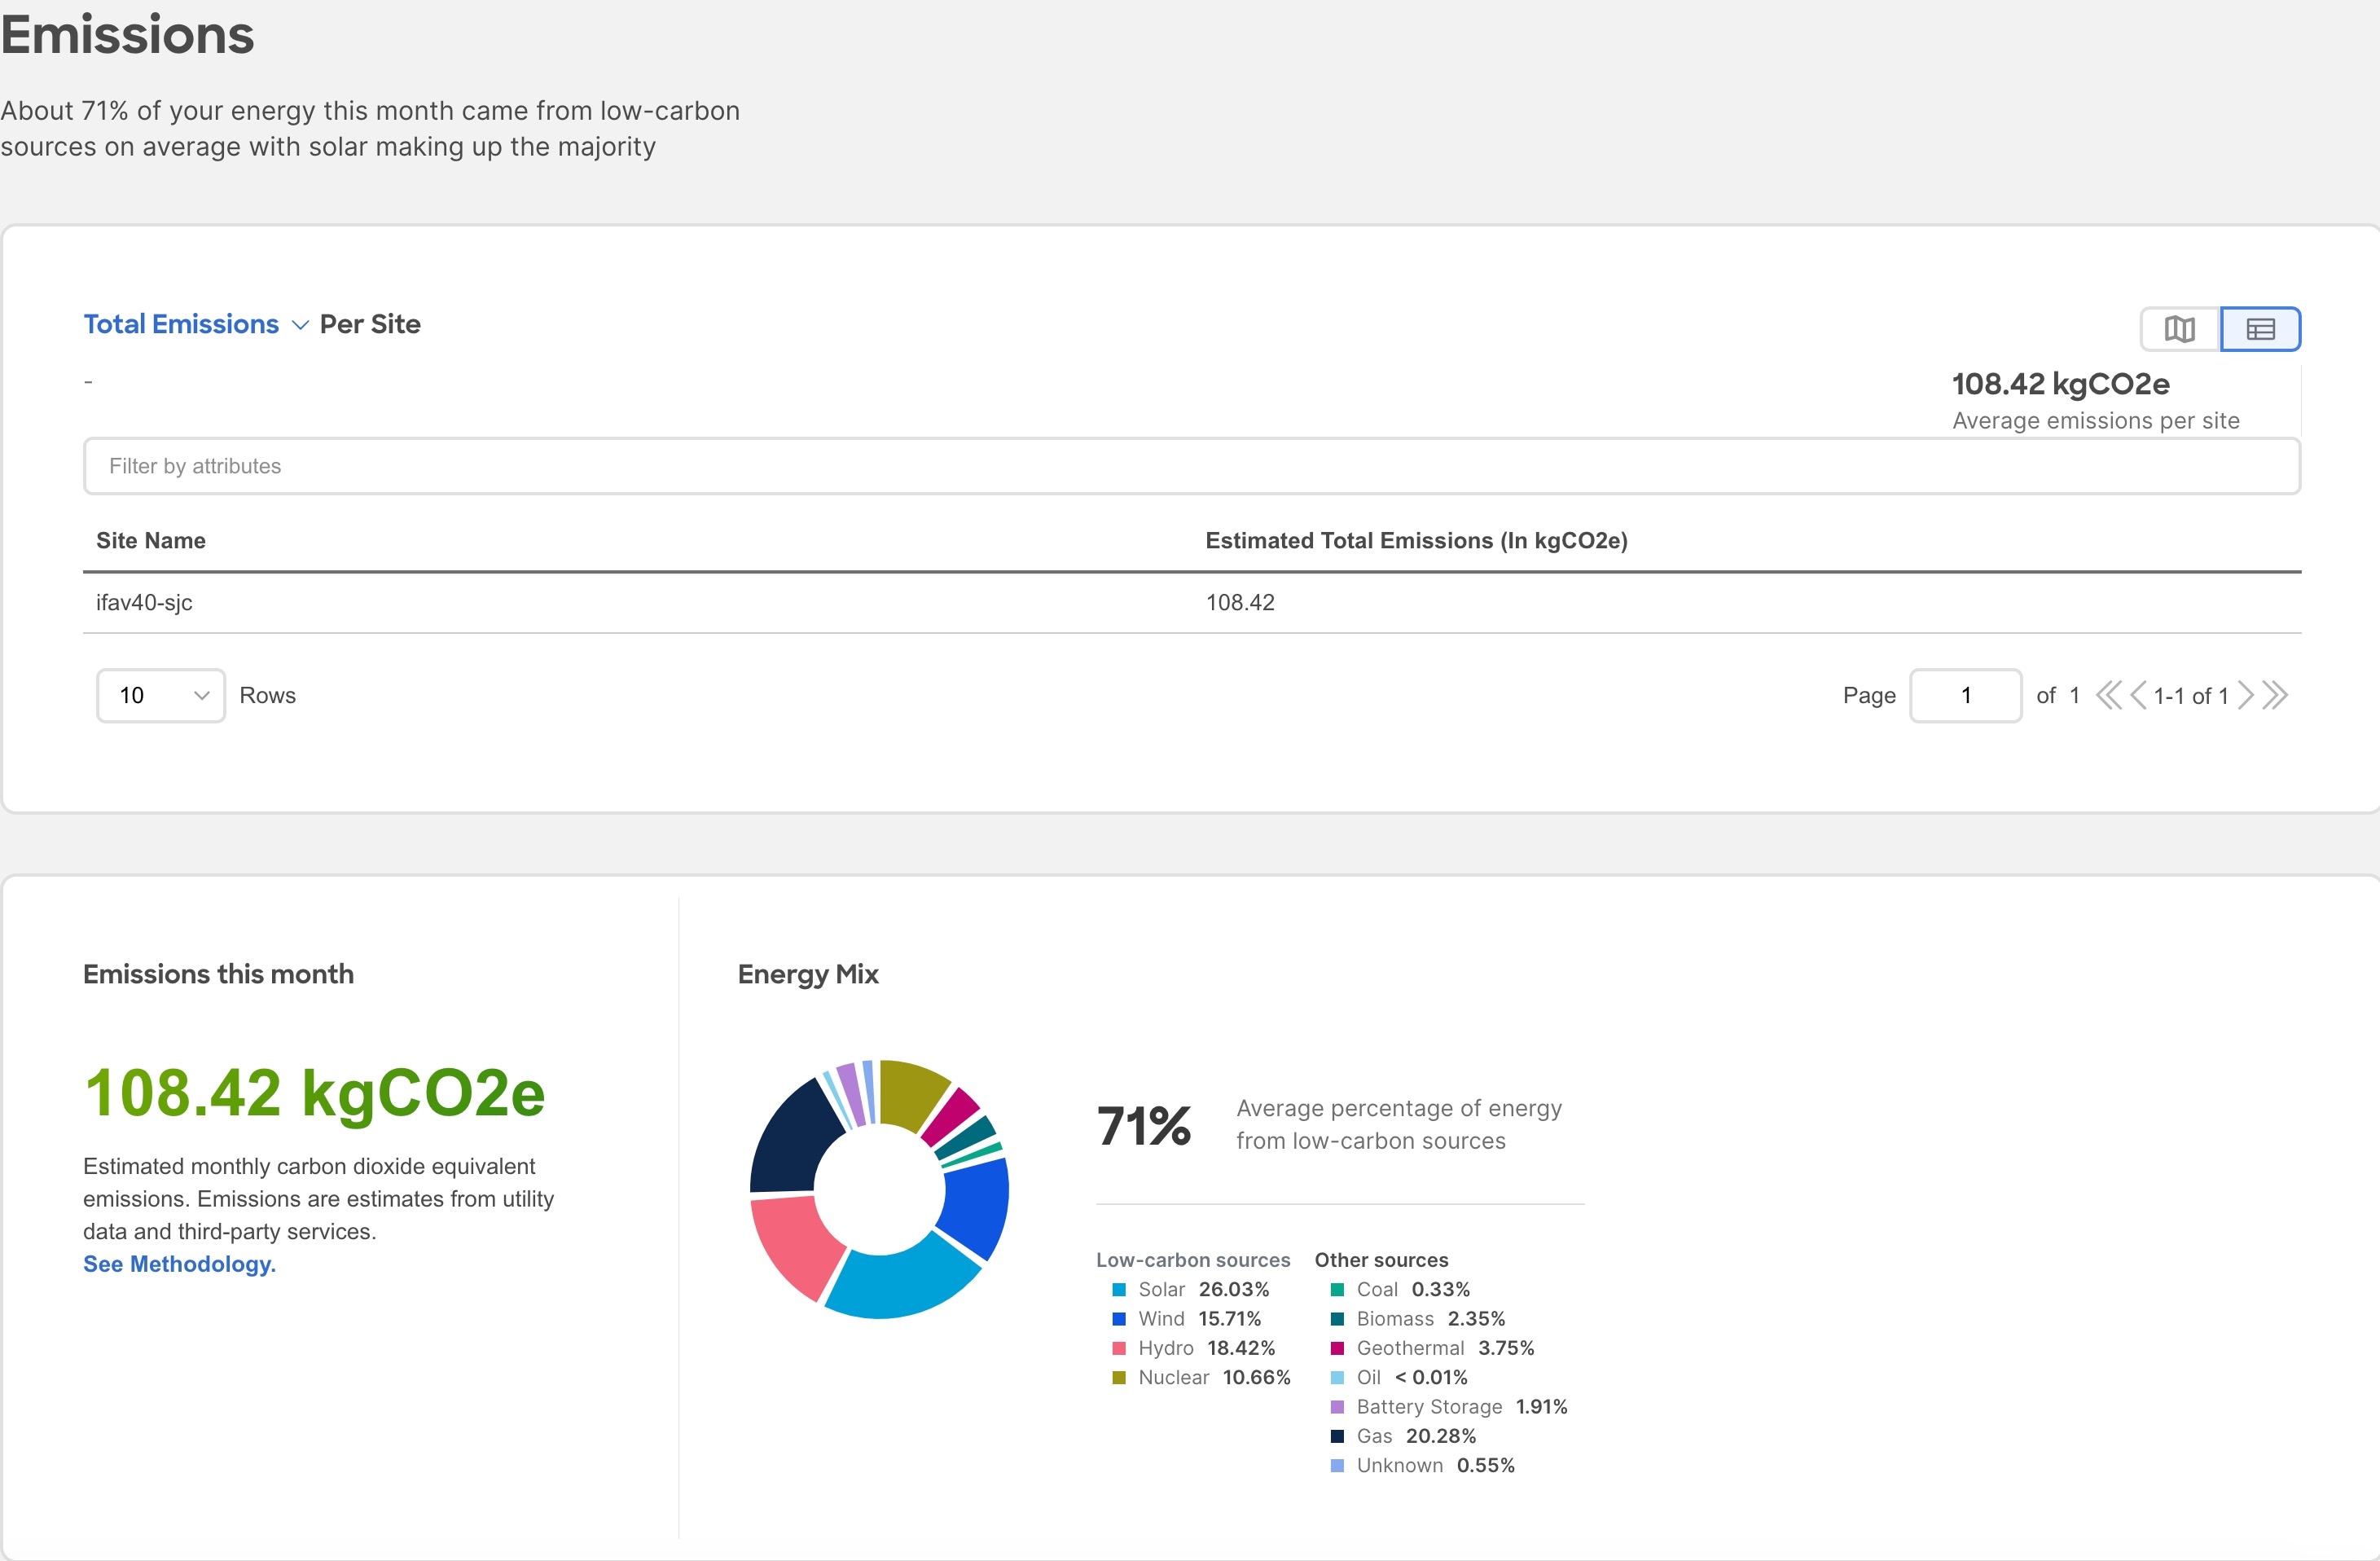
-
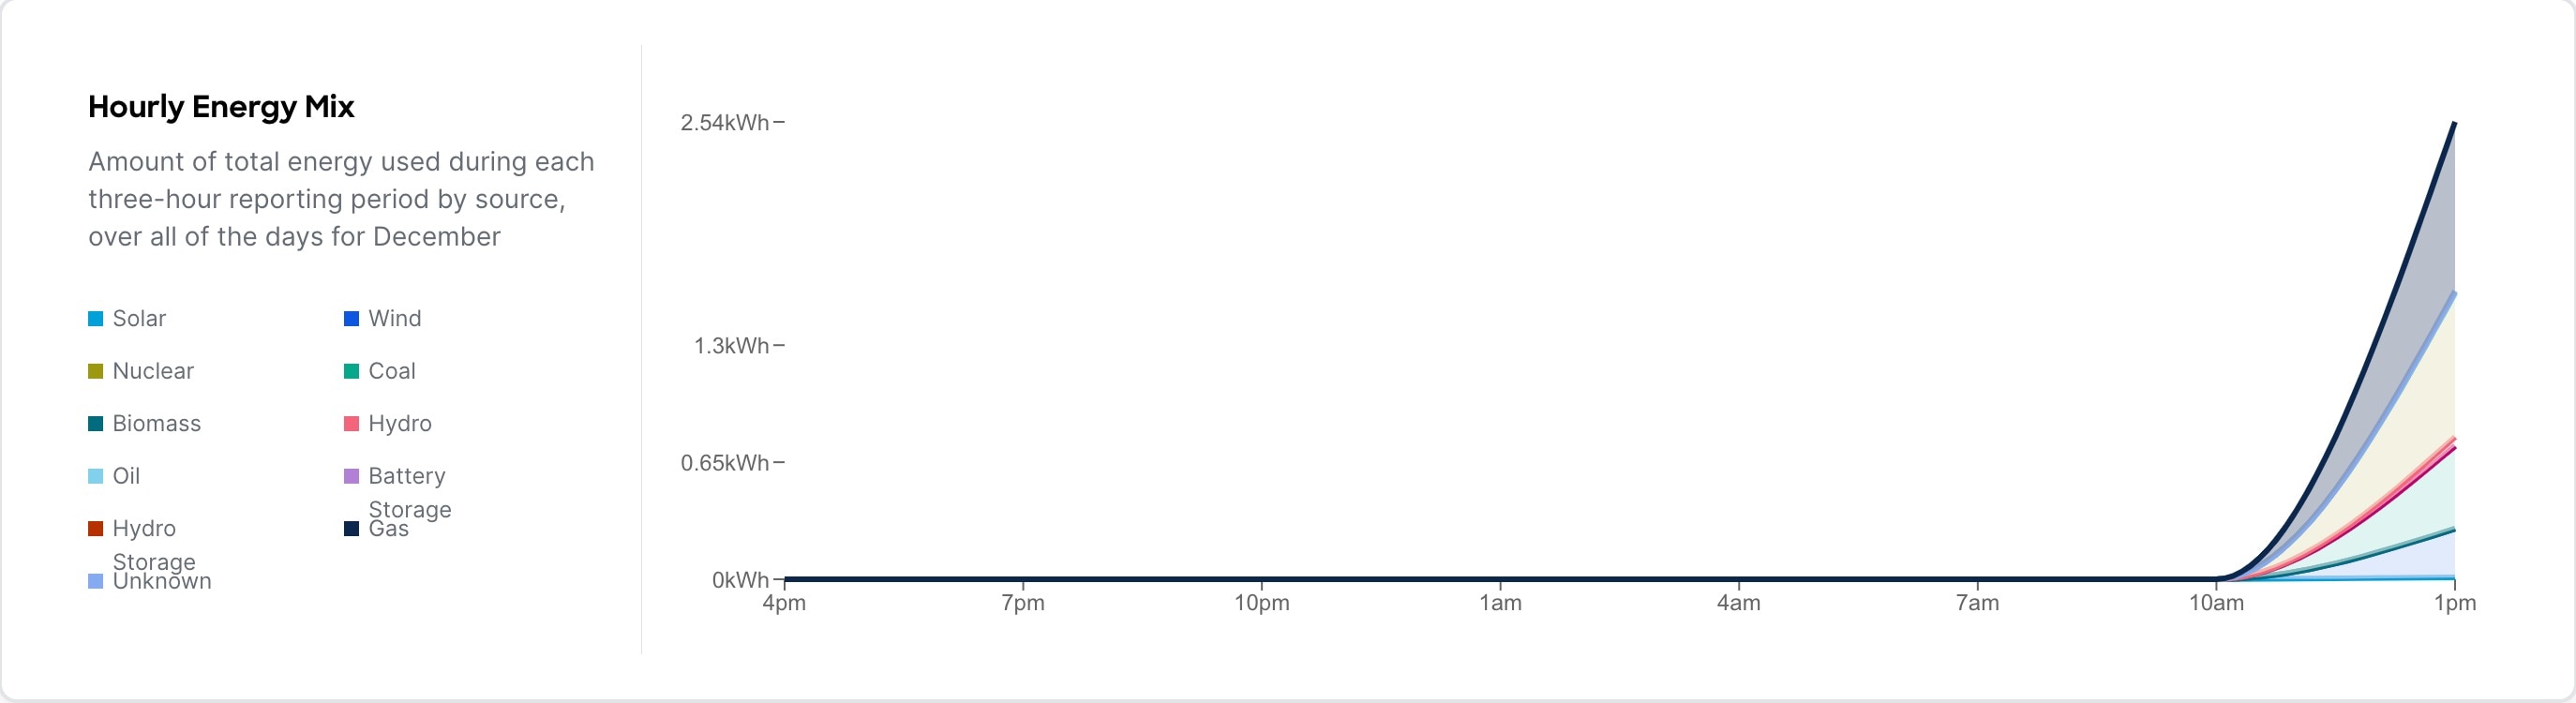
Select a site from the site dropdown menu to view the Hourly energy mix.
Hourly energy mix displays the amount of total energy used during each three-hour reporting period by source, over all of the days in the selected month. The minimum period before you can generate the next report is 3 hour.
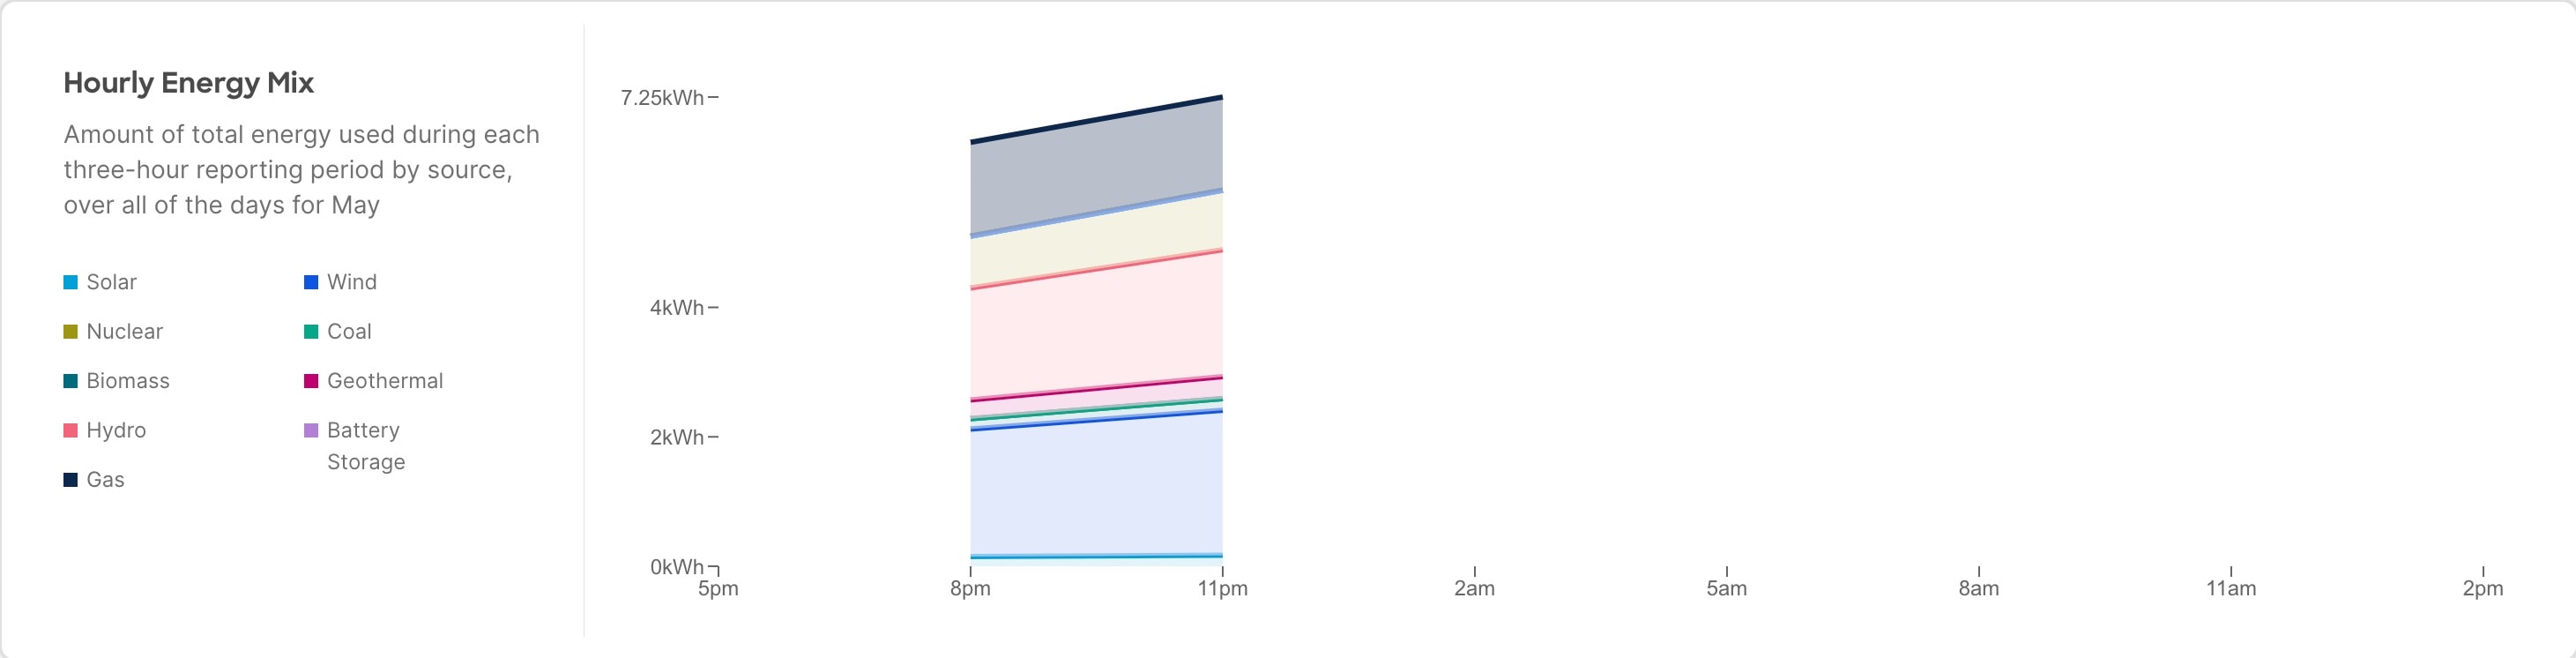
The minimum period before you can generate the next report is 3 hour.
View Sustainability Report for PDUs
-
Navigate to Analyze > Analysis Hub > Sustainability Report.
-
Select an online site or multiple online sites from the dropdown menu.
-
Select a time range from the dropdown menu.
-
Use the Data Source toggle to display data from PDUs.
-
Click Prepare Report.
Sustainability report displays At A Glance, Cost, Energy, and Emissions information for a particular site in the selected month.
-
The At A Glance area displays summary of the estimated cost, estimated switch power consumption, and estimated emissions in the selected month. Click the Learn More icon for more information.
-
The Cost area displays the estimated daily cost in the selected month and share of daily cost per site.
-
To calculate cost estimates Nexus Dashboard Insights uses values based on the average cost of grid energy for each region. From the Actions menu, select Site Energy Settings to customize your average cost for the current month for a more accurate estimate. In the Site Energy Settings page, you can update the cost for a particular site for the current month.
-
The Energy area displays the energy usage in the selected month in kWh.
-
The Emissions area displays the Total emissions per site, estimated monthly carbon dioxide equivalent emissions, average percentage of energy from low-carbon sources and other sources, and percent of total energy used during each three-hour reporting period by source, over all of the days in the selected month.
For Total emissions per site use toggle to view the information in graphical format or tabular format.
-
Select a site from the site dropdown menu to view the Hourly energy mix.
Hourly energy mix displays the amount of total energy used during each three-hour reporting period by source, over all of the days in the selected month. The minimum period before you can generate the next report is 3 hour.
Conformance Report
Conformance Report
Conformance report enables you to visualize and understand the lifecycle of your hardware and software in the network. This assists you in planning upgrades and hardware refresh. Conformance Report is generated everyday for each site for hardware and software conformance and weekly for each site for scale conformance. In the report you can view the conformance status of software, hardware, combination of both software and hardware, and scale conformance status for sites.
You can use Conformance Report to view current and project the future status of software and hardware inventory in your network against known EoS and EoL notices to ensure conformance. You can also monitor scale conformance status for onboarded sites.
Conformance Report displays the summary of conformance status for software, hardware, and scale for selected sites.
In the Conformance report, for hardware and software conformance switches are classified into 3 severities based on the software release or hardware platform EoL dates and end of PSIRT dates. The severities include:
The End of SW Maintenance Releases Date in the End-of-Sale and End-of-Life Announcement and the end of PSIRT date is used as reference milestone to classify the inventory into a category of Critical, Warning, or Healthy.
In the Conformance report, the scale conformance status for sites is based on Cisco’s Verified Scalability Guidelines for the software version running in switches and controllers when applicable. The severities include:
Access Conformance Report
Navigate to Analyze > Analysis Hub > Conformance.
Select a site from the dropdown menu.
OR
Navigate to Operate > Sites.
Select a Site.
In the General section, click Conformance.
Click View Report.
View Conformance Report
-
Navigate to a Conformance Report. See Access Conformance Report.
-
Select a site or All Sites from the dropdown menu.
-
Select a Current month or a previous month from the dropdown menu. You can select a previous month only if previous month reports are available.
Conformance Report displays conformance summary, hardware and software conformance, and scale conformance.
-
The Summary page displays devices by hardware conformance status, devices by software conformance status and scale conformance status for sites or switches. Click View Conformance Criteria to learn more.
-
The Hardware or Software page displays conformance status, conformance outlook, and device details.
-
In the Conformance Outlook section, click Overall, or Software, or Hardware to view the conformance for software and hardware, software only or hardware only.
-
The Device Details lists details for hardware and software.
-
The details for hardware include device name, site name, hardware conformance status, model, role, hardware end of vulnerability support for a particular device. Click device name to view additional details.
-
The details for software include device name, site name, software conformance status, model, software version, role, software end of vulnerability support for a particular device. Click device name to view additional details.
-
Use search to filter by attributes such as device, site, hardware conformance status, software conformance status, model, software version.
-
Use the gear icon to customize the columns in the table.
-
-
The Scale page displays all sites summary, scale conformance, and scale metrics.
-
The All Sites Summary section displays overall scale conformance level, top 5 switches by scalability metric violations, scalability metrics for controller and switches, and total scalability metrics violations.
-
Click View Conformance Criteria to learn more.
-
The Scale Conformance section displays the scale conformance for controller and switch in the last 6 months if the scale reports for previous months are available.
-
The All Scale Metrics section displays the scale metrics details for sites and switches. The All Scale Metrics section is displayed, if you select All sites from the drop-down menu.
-
The details for sites include site name, type, software version, controller metrics conformance, switch metrics conformance. Click site name to view additional details.
-
The details for switches include switch name, site name, software version, model, forward scale profile, metrics conformance. Click switch name to view additional details.
-
Use search to filter by attributes such as site, type, software version.
-
Use the gear icon to customize the columns in the table.
-
-
The Site Level Scale Metrics and Switch Level Scale Metrics displays the scale metrics details for a site and switches associated with the site. These sections are dispayed, if you select one site from the drop-down menu.
-
The details for a site include metric, conformance status, and resource usage,
-
The details for switches include switch name, site name, software version, model, forward scale profile, metrics conformance. Click switch name to view additional details.
-
-
-
From the Actions menu, click Run Report to run an on-demand report.
Connectivity Analysis
Connectivity Analysis
Connectivity Analysis is only supported for NDFC sites.
Connectivity Analysis feature enables you to run a quick or full analysis for a flow within a fabric. It is a micro-service launched through Nexus Dashboard Insights, used for tracing end-to-end forwarding path for a given flow and narrowing down the offending device on its path.
Connectivity Analysis detects and isolates offending nodes in the network for a given flow and includes the following functionalities:
-
Traces all possible forwarding paths for a given flow across source to destination endpoints.
-
Identifies the offending device with issue, resulting in the flow drop.
-
Helps troubleshoot to narrow down the root cause of the issue, including running forwarding path checks, software and hardware states programming consistencies through consistency-checks, and further details related to packets walkthrough.
The Cisco NX-OS standalone switch’s agent is a RPM based application service, which is pre-installed on the Cisco NX-OS. The Nexus Dashboard Insights agent gets the path for a specific flow. The job uses the active path returned to go to the next hop running the connectivity analysis job.
Connectivity analysis has added support for Layer 2 ToR devices connected within a NDFC onboarded Nexus fabric. Connectivity analysis will now rely on endpoint table to determine the first and last hop switches.
Earlier, if we had an access switch with ToR role, we would not onboard the ToR node, as an Layer 3 interface is needed to source telemetry information and a ToR role is a pure Layer 2. This has been worked around by creating an Layer 3 interface (SVI) in ToR and hence now we can onboard a ToR.
With Layer 2 ToR support, connectivity analysis (CA) offers the following capabilities:
-
Incorporate the device into the topology of a connectivity analysis job.
-
Provide detailed node-level flow information, including ingress interfaces and egress paths.
-
Initiate ELAM (Embedded Logic Analyzer Module) and capture packet details on ToR switches.
-
Conduct consistency-check validations on ToR switches.
Supported topologies:
-
ToR switch with port channel directly connected to leaf switch.
-
ToR switch connected to leaf switches in a vPC pair.
-
ToR switches with port channels connected to leaf switches individually. The leaf switches are in a vPC pair.
Guidelines and Limitations
-
At a time, you can submit up to 10 jobs per site.
-
At any point of time, you can run only 1 connectivity analysis job per site. You can stop a job in the queue and run another job.
-
Connectivity Analysis feature is supported on Cisco NX-OS release 9.3(7a) and later.
-
Whenever RPM is available, it is recommended to upgrade. Upgrading the RPM has no impact on traffic forwarding or on the switch.
-
Connectivity analysis job is not triggered if all onboraded devices are shown as incompatible.
Supported Topologies
-
Endpoint combinations:
-
EP-EP
-
-
Conversation types:
-
L2, L3, L4 (TCP/UDP)
-
V4 and V6 support
-
Transit and Proxy flows
-
Shared Service
-
-
Topologies:
-
VxLAN
-
vPC
-
Classic LAN
-
Schedule a Connectivity Analysis
Navigate to Analyze > Analysis Hub > Connectivity Analysis > Create Connectivity Analysis.
General
-
Enter a Connectivity Analysis Name and select a Site
Analysis Details
-
Choose L2 or L3 routed flow.
The Analysis details page shows a banner with the number of nodes that are compatible and up to date. You can click on View Nodes to view the list of nodes along with the following information:
Connectivity analysis job should not be triggered if all onboarded devices are shown as incompatible.
-
Name of the node
-
Serial Number
-
NX-OS image version
-
Current FSV version - Current version of NIA RPM running on the switch
-
Latest FSV version - Latest version of NIA RPM available for upgrade
-
Platform
-
Site
-
Compatibility - Denotes if current connectivity analysis is compatible with current NIA RPM version
-
Status - Status of the current NIA RPM on switch.
If an upgrade is available, it’s mandatory to be on that version to get the latest RPM installed in the switches.
-
Choose Classic or VxLAN fabric type. Enter the mandatory fields and optional fields to configure the job.
Connectivity Analysis Job Input Fields Classic LAN - L3 routed flow
Mandatory: Source IP address, Destination IP address, and VRF.
Optional: Source VLAN, Protocol, Source Port and Destination Port.
Classic LAN - L2 flow
Mandatory: Source MAC, Destination MAC, Source VLAN
Optional: Source Port, Destination Port, VRF, Protocol
VXLAN – L2 VNI switched flow
Mandatory: Source MAC, Destination MAC, Source VLAN
Optional: Source Port, Destination Port, VRF, Protocol
VXLAN – L3 VNI routed flow
Mandatory: Source IP address, Destination IP address, and VRF.
Optional: Source VLAN, Protocol, Source Port and Destination Port.
-
Toggle between the Mode - Quick or Full.
The Quick validator traces the network path using L2, L3, and VXLAN CLI for a specific flow to detect and isolate the offending nodes that result in the flow drop.
The Full validator runs a deeper analysis with consistency checker between software and hardware for programming consistencies. It also traces the network path using L2, L3, and VXLAN CLI for a specific flow.
-
Summary
This displays a summary of all the data entered to run the analysis job.
The post success screen comes up options to Create Another Connectivity Analysis or View Connectivity Analysis.
Connectivity Analysis Dashboard
The Connectivity Analysis Dashboard displays the list of connectivity analysis jobs along with a graph of the analyses by job and flow status. You can view the analyses based on any selected timeline. By default, the timeline is set to latest.
The Job and Flow Status are color coded. The following table lists the color along with the corresponding status.
| Color | Status |
|---|---|
|
Red |
Failed |
|
Green |
Complete |
|
Yellow |
Queued |
|
Blue |
In Progress |
|
Grey |
Status unknown |
The filter bar allows you to filters the analysis by the following objects:
-
Job status
-
Flow status
-
Name
-
SRC IP
-
DEST IP
-
Analyze Active path
-
Creation Time
-
End time
-
Source MAC
-
Destination MAC
-
Source port
-
Destination port
-
Protocol
See Filtering Information to view the available operators that can be used to filter the information.
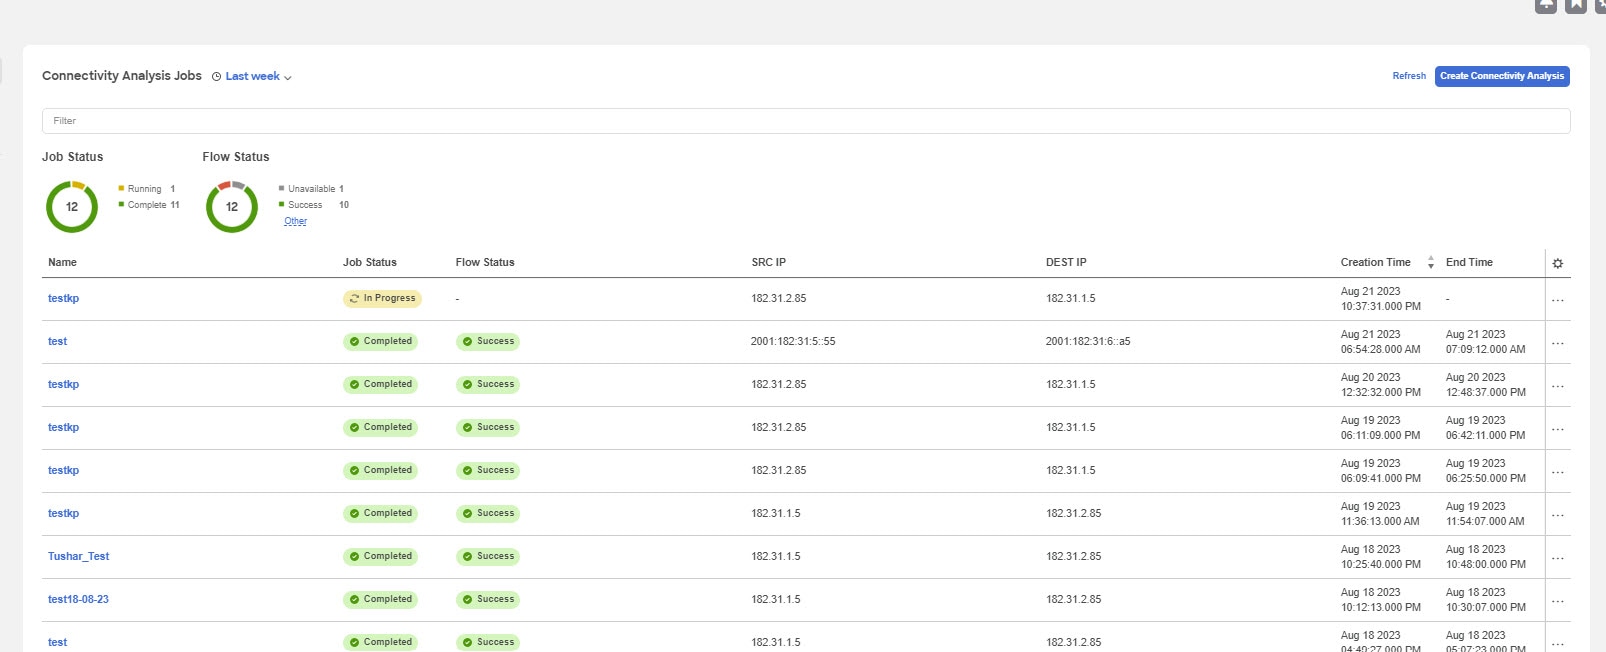
The page displays the Connectivity Analysis jobs in a tabular form and are sorted by status. You can customize the view by hiding/showing some of the columns of the table using the gear icon.
The following fields are available for each analysis:
-
Job status
-
Flow status
-
Name
-
SRC IP
-
DEST IP
-
Analyze Active path
-
Creation Time
-
End time
-
Source MAC
-
Destination MAC
-
Source port
-
Destination port
-
Protocol
The refresh button allows you to refresh the page to view any new analyses that have run in the background. The Create Connectivity Analysis button allows you to create a new analysis. Select any connectivity analysis job in the table to display additional details.
The Connectivity Analysis status displays the following information:
-
Analysis Results
-
Path Summary
Analysis Results
Analysis Results shows the Job and Path status of the node. It also displays the following details about the analysis:
-
Creation Time
-
End Time
-
Run Time
-
Source IP
-
Destination IP
-
Source VLAN
-
VRF Name
-
Source MAC
-
Destination MAC
-
Source Port
-
Destination Port
-
Protocol
-
Flow Type
-
Run Type
-
Analyze Active Path - This shows the active path status. Active path is the one where the actual traffic flows through the specific interfaces of all the available interfaces.
The time taken by the connectivity analysis jobs in the NX-OS fabrics has been reduced. The reduction percentages can differ based on your setup configurations with respect to number of ingress interfaces configured and which need to be processed on the Next Hop. The multi-processing approach helps manage the time better with larger number of ingress interfaces.
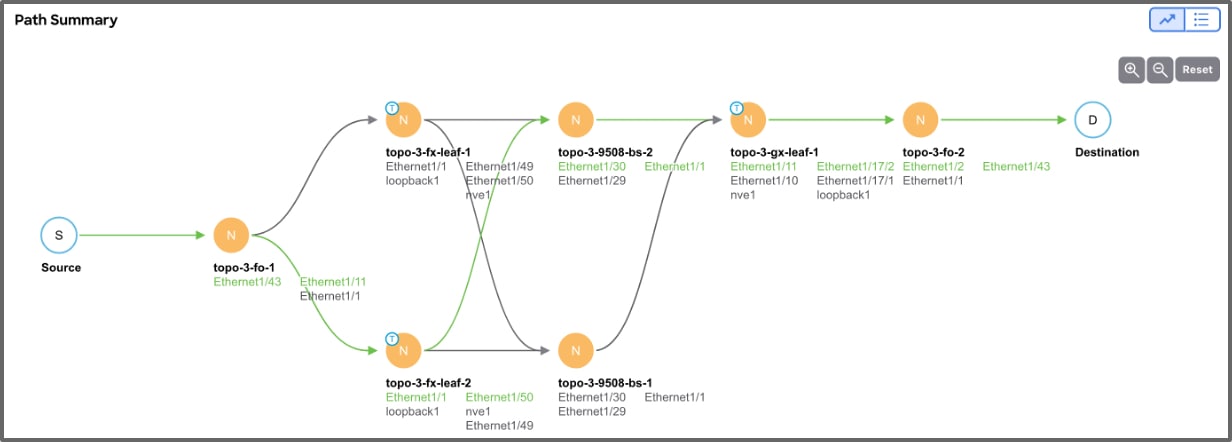
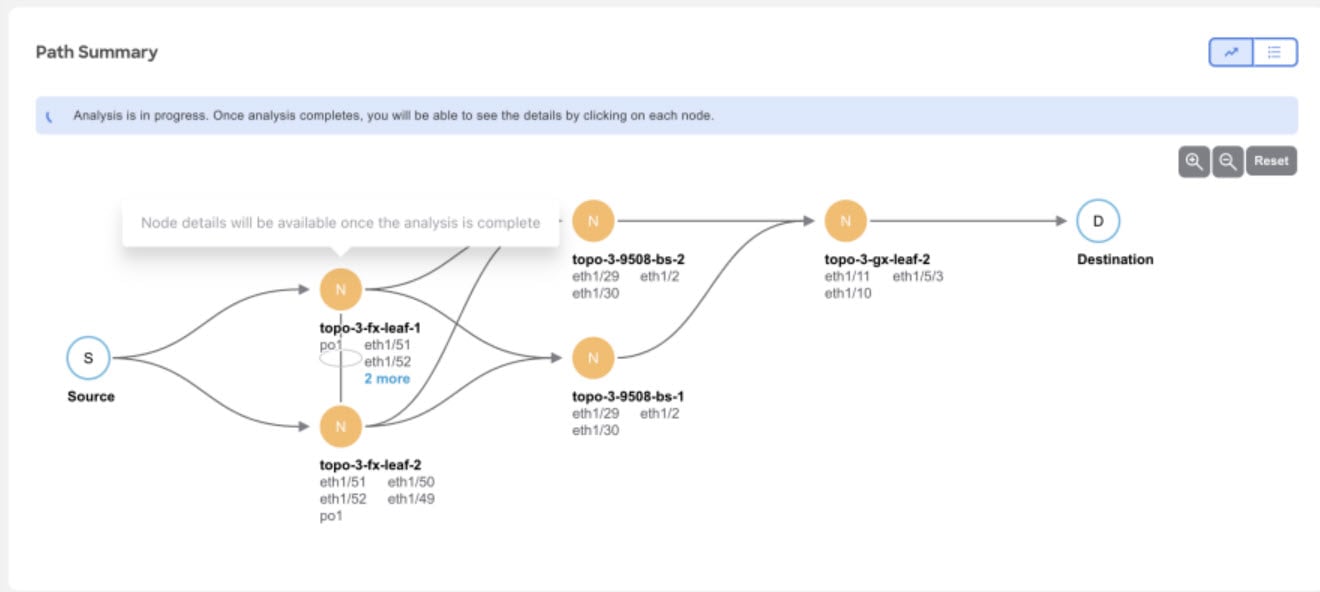
Path Summary
The path summary displays a workflow of the path where the traffic flows from the source port to the destination port. The green circle around each node signifies that the nodes are included in the active path. Double-click on a particular node to view the relevant details about it. The +, -, and the Reset allows you to zoom in, out and reset the size of the path summary.
Node Details
The following information is available for the nodes:
-
General
-
Job ID
-
Source Address
-
Destination Address
-
Source VLAN
-
VRF Name
-
Source MAC
-
Destination MAC
-
Source Port
-
Destination Port
-
Protocol
-
Flow Type
-
Run Type
-
Analyze Active Path
-
-
Details
-
Paths - Path details for the node. This displays the Ingress Interfaces and the Egress Paths available for the node.
-
Consistency Checks - This displays the list of consistency checks that are available for the node.
-
ELAM - ELAM details. If ELAM is triggered, then the report is available. To view the full report, click View Full Report. The ELAM report captures the following information:
-
Basic Information
-
Outer L2 Header
-
Outer L3 Header
-
Captured Packet
-
FPX Latch Results
-
Flood/ Multicast or Forwarding to Remote Leaf
-
Forwarding Lookup
-
Look Up Blocks Information
-
Rewrite Information
-
SUP-TCAM (ACX)
-
Table Lookup Results
-
Trigger/Basic Information
-
-
The path summary can also be displayed in a tabular form with the menu icon. The following fields are available for each hop of the node:
-
Hop Number
-
Node name
-
Node ID
-
Site
-
State Validator - This tells whether the current state is a success or not.
-
Forwarding - This tells whether the forwarding was successful or not.
-
Ingress paths
-
Egress paths
-
Tunnel Type
Click the Actions drop-down menu to:
-
Re-run analysis: To re-run the connectivity analysis.
-
Run Reverse Flow analysis: To run the reverse flow analysis.
-
Show Event log: To display the event log.
Connectivity Analysis Error Scenarios
A Connectivity Analysis job may fail if:
-
There is no active flow traffic in the fabric. Ensure that the traffic flows are active when enabling the active path analysis.
-
The destination address is not known in the VRF. Ensure that the destination endpoint is configured in VRF.
-
Traffic drops in ELAM. This is visible in the path summary.
-
The consistency checker fails.
-
Endpoint table fails to derive the correct end-point switch association.
Filtering Information
In some cases, you might be able to filter results to find information more easily.
For example, you might have a situation where there a large number of endpoints under a single leaf switch, but you are only interested in endpoints that have a certain VLAN value.
You could filter the information to show only those specific endpoints in this situation.
Use the following operators for the filter refinement:
| Operator | Description |
|---|---|
|
== |
With the initial filter type, this operator, and a subsequent value, returns an exact match. |
|
!= |
With the initial filter type, this operator, and a subsequent value, returns all that do not have the same value. |
|
contains |
With the initial filter type, this operator, and a subsequent value, returns all that contain the value. |
|
!contains |
With the initial filter type, this operator, and a subsequent value, returns all that do not contain the value. |
|
< |
With the initial filter type, this operator, and a subsequent value, returns a match less than the value. |
|
< = |
With the initial filter type, this operator, and a subsequent value, returns a match less than or equal to the value. |
|
> |
With the initial filter type, this operator, and a subsequent value, returns a match greater than the value. |
|
> = |
With the initial filter type, this operator, and a subsequent value, returns a match greater than or equal to the value. |
Delta Analysis
Delta Analysis
Nexus Dashboard Insights performs analysis of sites at regular intervals and the data is collected at an interval depending on the number of nodes.
| Number of nodes | Interval |
|---|---|
|
Fewer than 100 |
2 hours |
|
100 to 400 |
3 hours |
|
Greater than 400 |
12 hours |
At each interval, Nexus Dashboard Insights captures a snapshot of the controller policies and the fabric run time state, performs analysis, and generates anomalies. The anomalies generated describe the health of the network at that snapshot.
Delta analysis enables you to analyze the difference in the policy, run time state, and the health of the network between two snapshots.
Create Delta Analysis enables you to create a new delta analysis and manage existing analysis. See Create Delta Analysis.
Health Delta
Health Delta analyses the difference in the health of the fabric across the two snapshots.
See View Health Delta Analysis for more details.
Policy Delta for NDFC
Policy Delta for NDFC sites analyzes the changed nodes or switches across two snapshots and obtains a co-related view of what has changed in the NX-OS switches.
See View Policy Delta Analysis for more details.
Guidelines and Limitations
-
The Delta Analysis functionality currently supports the local authentication domain only.
-
While you are currently allowed to create more than one Delta Analyses at any given time, we recommend that you do not queue more than one Delta Analysis at any given time. In addition, we recommend that you wait for some time (approximately 10 minutes) between creating new analyses to avoid the risk of adversely impacting the run time of the concurrent online site analysis.
The interdependency arises because the Delta Analysis results in an increased load on the database. Sustained high-database load from multiple back-to-back Delta Analyses may affect the run-time of the online analysis.
-
When you choose a switch in the Changed Nodes area, in Policy Delta, the difference in the configuration between the two snapshots is displayed.
-
For Policy Delta, Audit Logs is not currently supported.
Create Delta Analysis
Choose Analyze > Analysis Hub > Delta Analysis > Create Delta Analysis.
-
In the Delta Analysis Name field, enter the name. The name must be unique across all the analyses.
-
Click Site to select the site.
-
Click Select Earlier Snapshot and choose the first snapshot for the delta analysis. Click Apply.
-
Click Select Later Snapshot and choose the second snapshot for the delta analysis. Click Apply.
The two snapshots selected for the delta analysis must belong to the same site.
-
View the Summary of the Delta Analysis created in Summary.
-
Click Save. The status of the delta analysis is displayed in the Delta Analysis table. Post completion, you can View Delta Analysis or Create another Delta Analysis.
You can perform one delta analysis at a time. To perform another delta analysis, you must stop the current delta analysis and then start the another delta analysis.
-
(Optional) From the Status column, select an In Progress or Scheduled analysis and click STOP in the "…" option to stop the delta analysis.
-
The Delete in the "…" allows you to delete the analysis created.
If there are any errors in the creation of a delta rule, it will be displayed on the summary page of the rule creation as a banner.
View Delta Analysis
The delta analysis page displays the analysis in a tabular form. The analysis are sorted by status. The Create Delta Analysis button lets you create a new delta analysis. Click any delta analysis to view more details.
The status of analysis can be either Aborted, Pending, Scheduled, Stopped, Stopping, Success, Failed, Partially Failed, Queued, Completed or In progress.
The filter bar allows you to filters the analysis by the following factors:
-
status
-
name
-
submitter id
-
site
The delta analysis dashboard displays general information along with health and policy delta.
-
To view the results of health delta analysis, see View Health Delta Analysis.
-
To view the results of policy delta analysis, see View Policy Delta Analysis.
View Health Delta Analysis
Health Delta analyses the difference in the health of the fabric across the two snapshots. The results are displayed in the following areas:
-
Anomaly Count: Displays the difference in anomaly count per severity across the snapshots.
The first count represents the anomalies found only in the earlier snapshot. The second count represents the anomalies found only in the later snapshot.
Delta analysis now performs an object delta rather than a count delta. So along with the count, you can now view how many anomalies were cleared, how many are unchanged and how many are new anomalies.
The anomaly count also displays the difference for the different types of anomalies. It is displayed for Critical, Major and Warning.
-
Delta by Resources: Displays the count of resources by type that are new, lost or unchanged. You can also specifically view the resources who’s count has changed by clicking the View Changed Only toggle. The filter bar allows you to filter the data by resource. The gear icon allows you to customize the columns as per your view. The table also shows the count delta and the health delta. Count delta includes both healthy and unhealthy resources. Healthy resources will not have any anomalies associated with it if filtered. Health delta shows only unhealthy resources and will return anomalies if filtered by anomalies.
The analysis is available for the following resources :
-
Interfaces
-
Endpoints
-
Spines
-
Border Gateways
-
Leafs
-
Border Leafs
-
VLANs
-
VRFs
-
SVIs
-
L2VNIs
-
L3VNIs
-
VNIs
-
VPCs
If you click any of the counts for the Count and Health Delta resources, you can view the list of resources along with the node information. For SVI, the node column provides the VNI association.
-
All Anomalies: The Grouped by title view displays the delta status for grouped anomalies across the snapshots. The Ungrouped by title view displays the delta status for each anomaly across the snapshots.
The Anomalies can be listed for the following types:
-
New
-
Unchanged
-
Cleared
-
From Earlier Snapshot
-
From Later Snapshot
The anomalies are displayed in a tabular form with the following fields:
-
Title
-
Level
-
Category
-
Count
You can filter the results based on the following attributes:
-
Border Gateways (Leaf)
-
Border Leafs (Leaf)
-
Interfaces
-
L2VNIs
-
L3VNIs
-
Leafs
-
Spines
-
SVIs
-
VLANs
-
VNIs
-
VPCs
-
VRFs
Select an anomaly to view the anomaly details.
View Policy Delta Analysis
Click Policy Delta to view the policy changes across the two snapshots.
Policy Delta includes 2 sections: Changed Policy Objects and Policy Viewer
-
Changed Policy Objects displays the changed objects across the two snapshots.
-
Policy Viewer displays the configuration across the earlier and later snapshots. The switch configuration for the earlier snapshot is called the earlier snapshot policy. The switch configuration for the later snapshot is called the later snapshot policy.
-
Click Show More Code Above or Show More Code Below to display more content.
-
Click the download icon to export the snapshot policy.
-
You can also view the only the changed configuration by clicking the View Changed Only toggle.
-
Log Collector
Log Collector
The Log Collector feature enables you to collect and upload the logs for the devices in your network to Cisco Intersight Cloud. It also enables Cisco TAC to trigger on-demand collection of logs for devices on the site and pulls the logs from Cisco Intersight Cloud.
The Log Collector has two modes:
-
User initiated - The user collects the logs for devices on the site and then uploads the collected logs to Cisco Intersight Cloud after the log collection job is completed. You can automatically upload the log files to Cisco Intersight Cloud after the log collection job is completed.
-
TAC initiated - Cisco TAC triggers on-demand collection of logs for specified devices and pulls the logs from Cisco Intersight Cloud.
Device Connectivity Notifier for TAC Initiated Collector
Nexus Dashboard Insights uses the device connectivity issue notifier on Cisco Nexus Dashboard to communicate with the devices. The notifier checks for TAC triggered on-demand collection of logs. In case the fabric is not configured properly to communicate with the device, Nexus Dashboard Insights notifies the following:
-
The device is not configured for node interaction.
-
You can not run a Log Collector job on the device.
-
Nexus Dashboard Insights cannot connect to the device.
If the node interaction is not healthy on the device, you cannot select the device for Log Collector to collect logs. In the GUI, the device is greyed out.
Uploading logs to Cisco Intersight Cloud
-
Ensure that Nexus Dashboard Insights is connected to Cisco Intersight Cloud.
-
Ensure that Nexus Dashboard Insights is connected to Cisco Intersight Device Connector.
Choose Analyze > Analysis Hub > Log Collector > Create Log Collector Job.
-
Enter the name.
-
Click Select Site to select a site.
-
(Optional) Check Auto Upload Log Files to automatically upload the log files to Cisco Intersight Cloud after the log collection job is completed.
-
Click Next.
-
Click Add Nodes and then select the nodes from the Select Nodes menu.
-
Click Add. The nodes are displayed in the Select Nodes table.
-
Click Start Collection to initiate the log collection process.
-
Click the job in the table to display additional job details.
-
Click the
 icon to display Log Collection status.
 -
Select the node and click
 icon.
icon. -
Click Upload File to TAC Assist to upload a single file for the selected node manually.
-
Click Upload to upload all the log files generated for the selected node manually.
The status of the upload is displayed in the Selected Nodes table.
Guidelines and Limitations
-
If the upload logs fails for some of the nodes and succeeds for the rest of the nodes, then in the Selected Nodes table, the status is displayed as Completed.
-
If the collection fails for some of the nodes, then the collection will continue for other nodes. After the collection is completed, the upload will start. In the Selected Nodes table, the combined status is displayed in the Status column.
-
If the collection succeeds for some of the nodes, but the upload fails, then in the Selected Nodes table, the status is displayed as Failed.
-
Auto Upload Log Files can be performed only on one node at a time.
Log Collector Dashboard
Navigate to Analyze > Analysis Hub > Log Collector.
The Log Collector Dashboard displays a graph of Logs by Job status for a particular site and displays the latest log collections.
The filter bar allows you to filters the logs by status, name, type, node, start time, and end time.
Use the following operators for the filter refinement:
| Operator | Description |
|---|---|
|
== |
With the initial filter type, this operator, and a subsequent value, returns an exact match. |
|
!= |
With the initial filter type, this operator, and a subsequent value, returns all that do not have the same value. |
|
contains |
With the initial filter type, this operator, and a subsequent value, returns all that contain the value. |
|
!contains |
With the initial filter type, this operator, and a subsequent value, returns all that do not contain the value. |
The page also displays the log collection jobs in a tabular format. The jobs are sorted by status. Select the log collection job in the table to view additional details.
General
This displays the status of the job along with a graph showing the number of devices by status.
Details
The following information is listed:
-
Creation Time
-
End Time
-
Nodes
-
Job ID
Selected Nodes
This displays the list of nodes in a tabular form along with the status of each job and the upload status for the files uploaded.
Upload All Files allows you to upload all the files.
TAC Initiated Log Collector
The TAC initiated log collector enables Cisco TAC to trigger on-demand collection of logs for specified user devices in the Cisco Intersight Cloud to the Device Connector.
When the TAC assist job is complete, the new job appears in the Log Collector table. Select the log collection job in the table to display additional details. The Log Collection status displays information such as status, general information, and node details.
Copyright
THE SPECIFICATIONS AND INFORMATION REGARDING THE PRODUCTS IN THIS MANUAL ARE SUBJECT TO CHANGE WITHOUT NOTICE. ALL STATEMENTS, INFORMATION, AND RECOMMENDATIONS IN THIS MANUAL ARE BELIEVED TO BE ACCURATE BUT ARE PRESENTED WITHOUT WARRANTY OF ANY KIND, EXPRESS OR IMPLIED. USERS MUST TAKE FULL RESPONSIBILITY FOR THEIR APPLICATION OF ANY PRODUCTS.
THE SOFTWARE LICENSE AND LIMITED WARRANTY FOR THE ACCOMPANYING PRODUCT ARE SET FORTH IN THE INFORMATION PACKET THAT SHIPPED WITH THE PRODUCT AND ARE INCORPORATED HEREIN BY THIS REFERENCE. IF YOU ARE UNABLE TO LOCATE THE SOFTWARE LICENSE OR LIMITED WARRANTY, CONTACT YOUR CISCO REPRESENTATIVE FOR A COPY.
The Cisco implementation of TCP header compression is an adaptation of a program developed by the University of California, Berkeley (UCB) as part of UCB’s public domain version of the UNIX operating system. All rights reserved. Copyright © 1981, Regents of the University of California.
NOTWITHSTANDING ANY OTHER WARRANTY HEREIN, ALL DOCUMENT FILES AND SOFTWARE OF THESE SUPPLIERS ARE PROVIDED “AS IS" WITH ALL FAULTS. CISCO AND THE ABOVE-NAMED SUPPLIERS DISCLAIM ALL WARRANTIES, EXPRESSED OR IMPLIED, INCLUDING, WITHOUT LIMITATION, THOSE OF MERCHANTABILITY, FITNESS FOR A PARTICULAR PURPOSE AND NONINFRINGEMENT OR ARISING FROM A COURSE OF DEALING, USAGE, OR TRADE PRACTICE.
IN NO EVENT SHALL CISCO OR ITS SUPPLIERS BE LIABLE FOR ANY INDIRECT, SPECIAL, CONSEQUENTIAL, OR INCIDENTAL DAMAGES, INCLUDING, WITHOUT LIMITATION, LOST PROFITS OR LOSS OR DAMAGE TO DATA ARISING OUT OF THE USE OR INABILITY TO USE THIS MANUAL, EVEN IF CISCO OR ITS SUPPLIERS HAVE BEEN ADVISED OF THE POSSIBILITY OF SUCH DAMAGES.
Any Internet Protocol (IP) addresses and phone numbers used in this document are not intended to be actual addresses and phone numbers. Any examples, command display output, network topology diagrams, and other figures included in the document are shown for illustrative purposes only. Any use of actual IP addresses or phone numbers in illustrative content is unintentional and coincidental.
The documentation set for this product strives to use bias-free language. For the purposes of this documentation set, bias-free is defined as language that does not imply discrimination based on age, disability, gender, racial identity, ethnic identity, sexual orientation, socioeconomic status, and intersectionality. Exceptions may be present in the documentation due to language that is hardcoded in the user interfaces of the product software, language used based on RFP documentation, or language that is used by a referenced third-party product.
Cisco and the Cisco logo are trademarks or registered trademarks of Cisco and/or its affiliates in the U.S. and other countries. To view a list of Cisco trademarks, go to this URL: http://www.cisco.com/go/trademarks. Third-party trademarks mentioned are the property of their respective owners. The use of the word partner does not imply a partnership relationship between Cisco and any other company. (1110R)
© 2017-2024 Cisco Systems, Inc. All rights reserved.