
New and changed information
The following table provides an overview of the significant changes up to this current release. The table does not provide an exhaustive list of all changes or of the new features up to this release.
| Release Version | Feature | Description |
|---|---|---|
|
Nexus Dashboard 4.3.1 |
Device Security Overview tab |
Beginning with release 4.3.1, Nexus Dashboard adds a new Overview tab on the Device Security page that provides a centralized dashboard to monitor security advisories, Live Protect deployment status, hit counts, and historical trends. For more information, see Overview. |
|
Nexus Dashboard 4.3.1 |
Live Protect status fields in the Devices table |
Beginning with Nexus Dashboard release 4.3.1, the Devices table under the Security advisories tab displays two separate status values for each switch such as the Live Protect config status and Live Protect operational status. These values distinguish between Live Protect configuration state and its runtime status on the device. For more information, see Security advisories. |
|
Nexus Dashboard 4.3.1 |
Cisco Nexus 9000 Series name change |
Cisco Nexus 9000 Series is now the Cisco N9000 Series. |
Device security overview
The Device Security page in Nexus Dashboard provides a unified interface for monitoring, evaluating, and responding to security advisories that affect your network devices. It allows you to efficiently manage vulnerabilities and enhance the protection of your Cisco Nexus environment.
You can view the security advisories that apply to your devices on the Device Security page by navigating to Manage > Device Security.

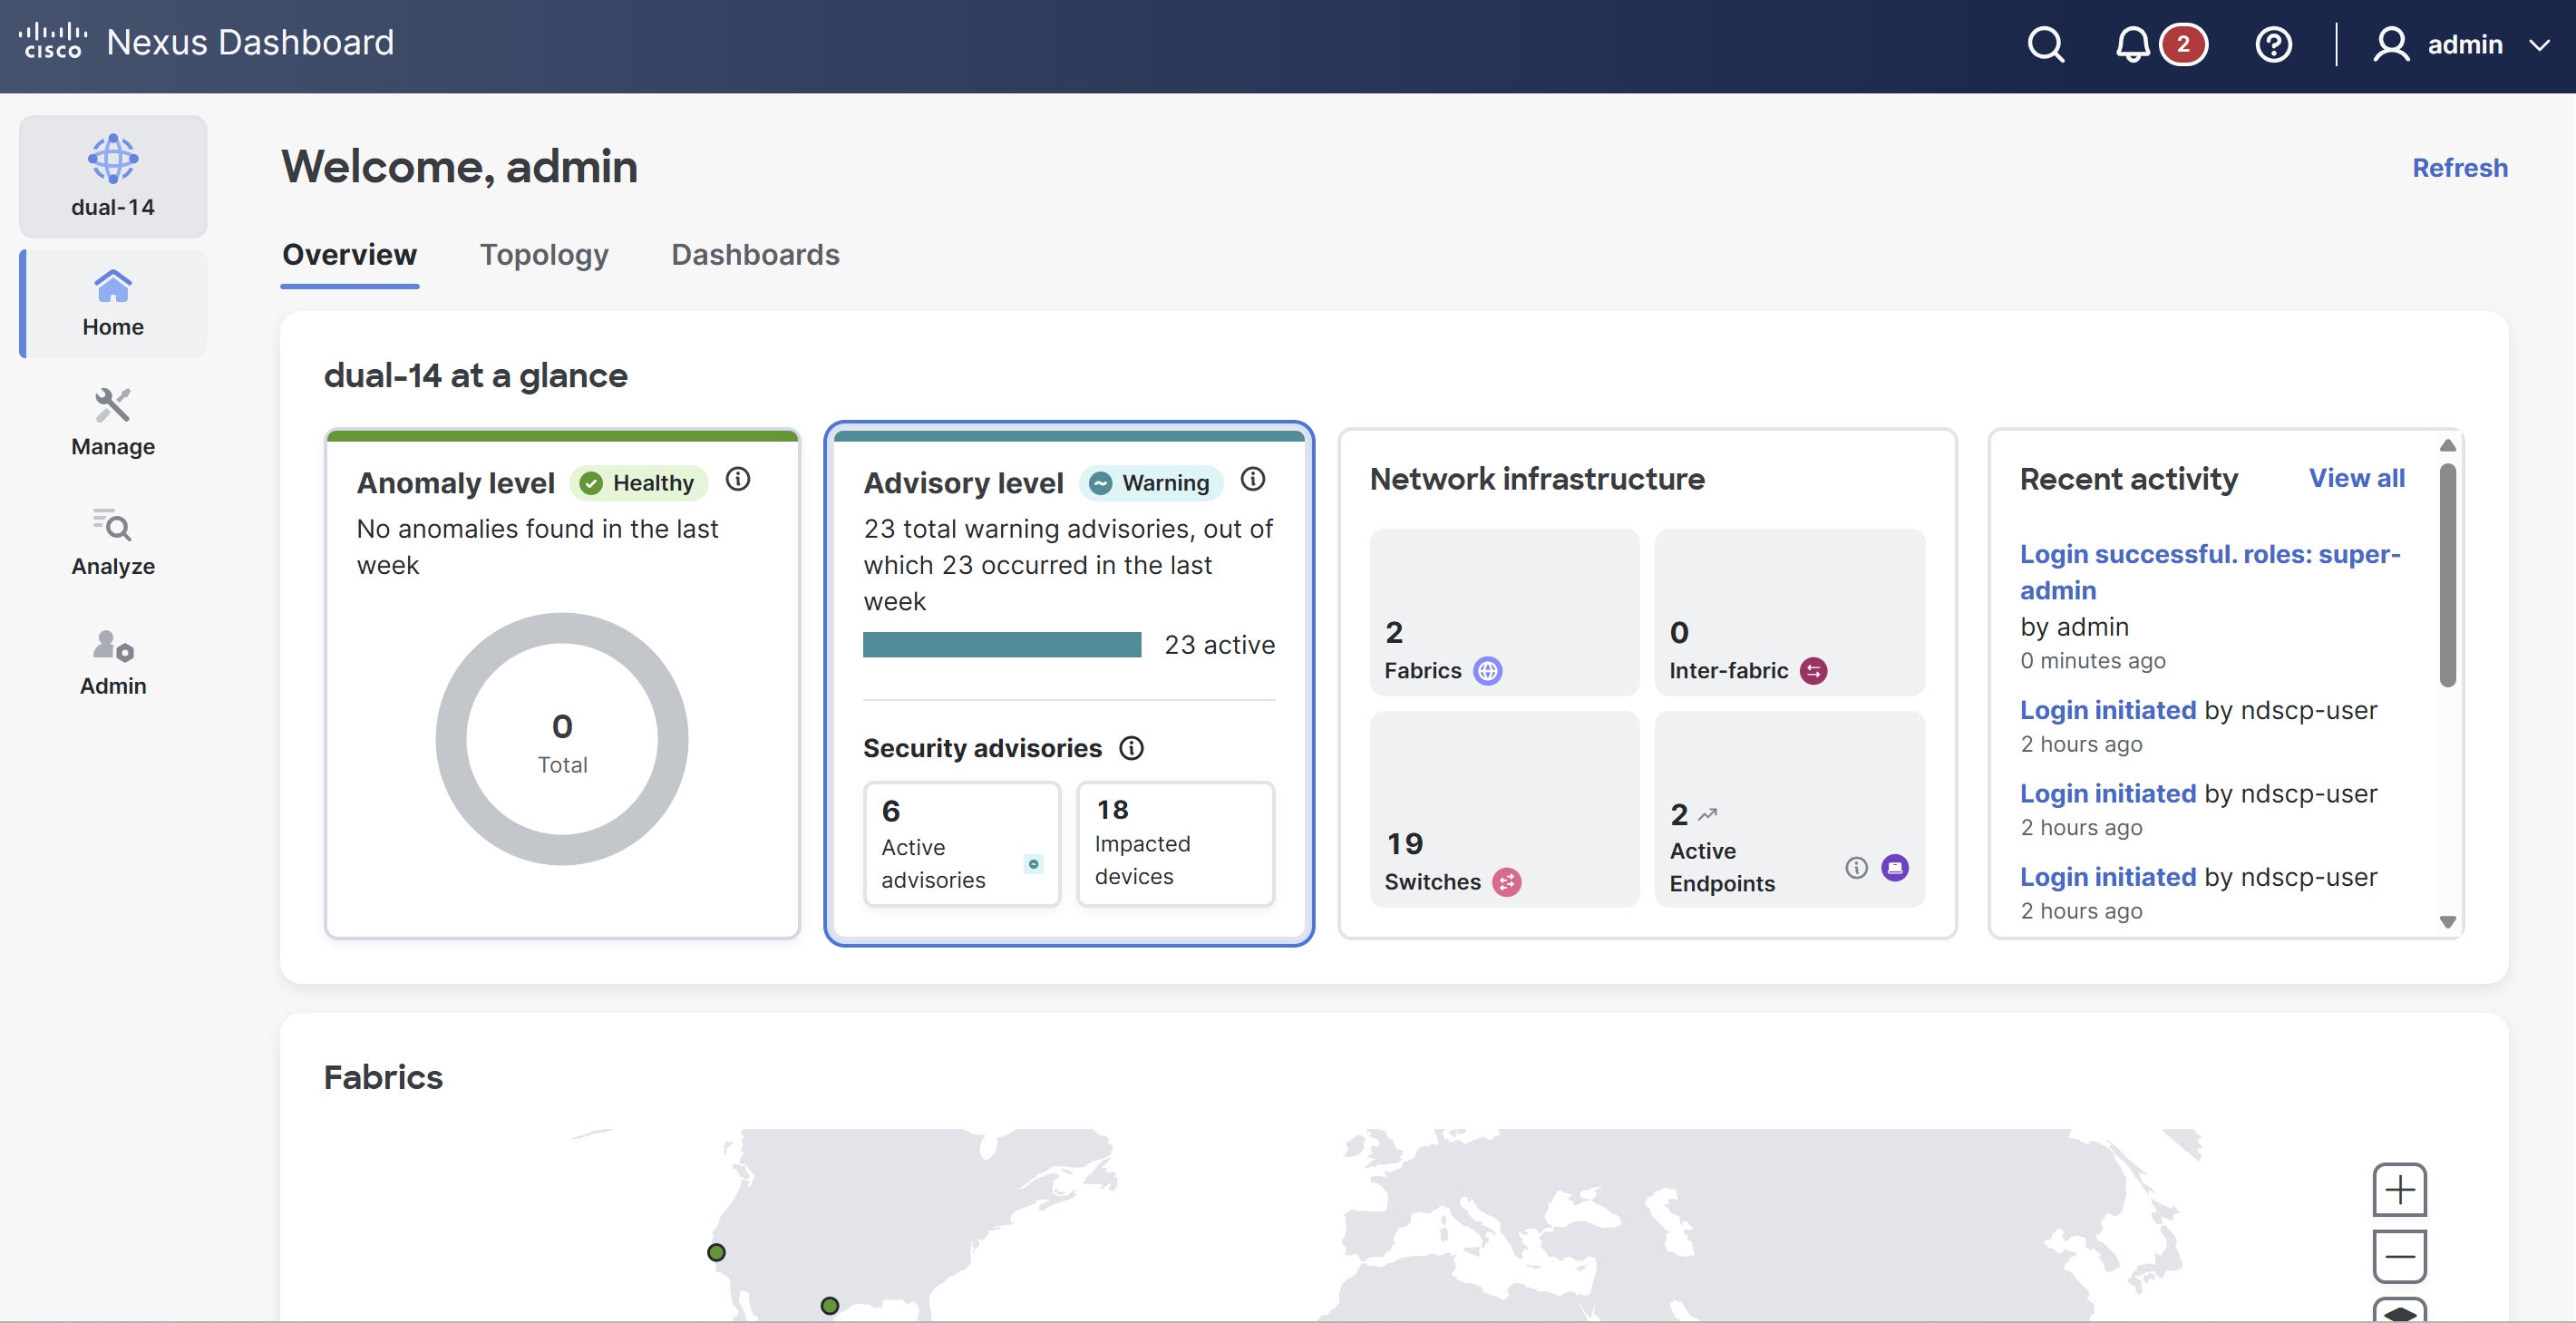
You can also view the Device Security page from the Nexus Dashboard Overview page. Click the number of active advisories or the impacted devices from the Advisory level card.
The Device Security page includes the following tabs.
-
Overview
-
Security advisories
-
Topology
Overview
The Overview tab serves as the centralized dashboard for the Device Security page. It provides a consolidated view of security advisory severity, Live Protect deployment status, and real-time hit telemetry. You can use this tab to quickly review the security status of your network, track historical trends, and identify the most critical or actively targeted vulnerabilities without reviewing each advisory individually.
You can view the Overview tab by navigating to Manage > Device Security > Overview.
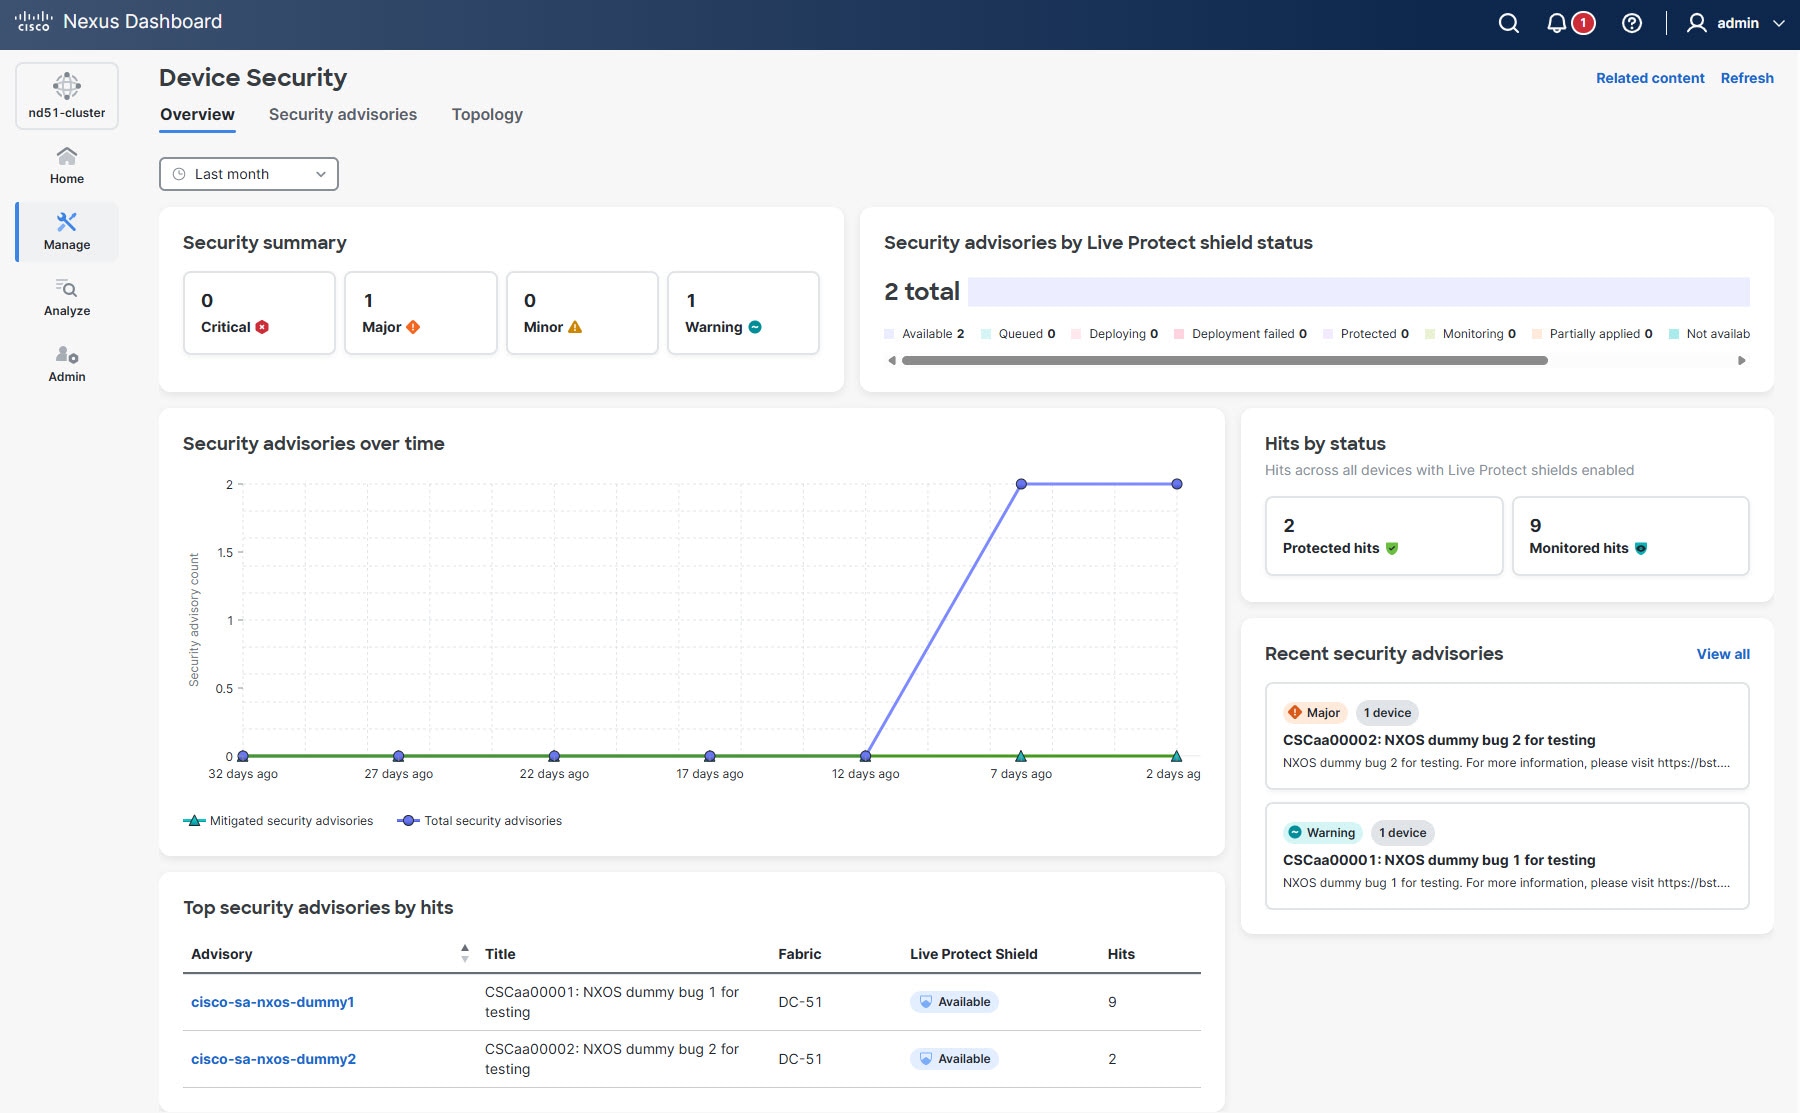
The Overview tab displays the following widgets.
You can use the time range drop-down list at the top of the Overview tab to filter time-based widgets such as Security advisories over time and Top security advisories by hits. Supported ranges include Last 24 Hours, 7 Days, 14 Days, and Last month.
Security summary
The Security summary widget displays the total count of active security advisories on your network, categorized by severity level. You can use this widget to quickly identify the volume of advisories that require attention and prioritize remediation efforts based on severity. The severity level of each advisory matches the severity of the underlying vulnerability.
The widget displays counts for the following severity levels.
-
Critical (Sev1) — Advisories that pose the highest risk and require immediate attention.
-
Major (Sev2) — Advisories that pose a significant risk and require prompt action.
-
Minor (Sev3) — Advisories that pose a lower risk and can be addressed as part of routine maintenance.
-
Warning (Sev4) — Advisories that highlight potential issues to monitor but do not require immediate action.
Security advisories by Live Protect shield status
The Security advisories by Live Protect shield status widget displays the distribution of advisories by their Live Protect shield status.
Displays the distribution of advisories by their Live Protect shield status. Use this widget to track which advisories are protected, which require action, and which are not eligible for Live Protect.
The widget displays the following statuses.
| Status | Description |
|---|---|
|
Available |
Live Protect shield exists but has not been deployed. |
|
Deployment failed |
Live Protect shield deployment failed. |
|
Protected |
All impacted devices have the control deployed in Protect mode. |
|
Monitoring |
All impacted devices have the control deployed in Monitor mode. |
|
Partially applied |
A Live Protect shield is deployed on a subset of the affected devices, but not on all of them. |
|
Not available |
No Live Protect shield exists for the advisory. |
|
Not supported |
The affected device does not meet the hardware or software requirements for Live Protect. |
|
Disabled |
Live Protect is disabled for the advisory or device. |
Security advisories over time
The Security advisories over time widget displays a time-series graph showing the trend of total security advisories compared to mitigated advisories over the chosen time range. You can use this widget to monitor how the security status of your network changes over time and to evaluate the effectiveness of your mitigation efforts.
The graph plots the following two data lines.
-
Total security advisories — The total number of active advisories detected during the chosen time range.
-
Mitigated security advisories — The number of advisories with Live Protect shields deployed in Protect mode during the chosen time range.
The Mitigated security advisories include only advisories with Live Protect shields deployed in Protect mode. Advisories in Monitor mode are not counted as mitigated because
Monitormode logs exploit attempts but does not actively block them.
Nexus Dashboard captures data points every 15 minutes. You can adjust the time range using the drop-down list at the top of the Overview tab.
Hits by status
The Hits by status widget displays the total number of exploit attempts (hits) detected across all devices with Live Protect enabled. Hits are categorized by the deployment mode of Live Protect shield that detected them.
The widget displays the following counts:
-
Protected hits — The number of times the Live Protect shield blocked a vulnerability attempt in Protect mode.
-
Monitored hits — The number of times the Live Protect shield logged a vulnerability attempt in Monitor mode.
You can use this widget to gauge the volume of active threats targeting your network and to evaluate the impact of your Live Protect policies.
Top security advisories by hits
The Top security advisories by hits widget lists the security advisories with the highest number of exploit attempts across your network. You can use this widget to identify the most actively targeted vulnerabilities and prioritize your response.
The widget displays the following details for each advisory:
-
Advisory — The unique identifier of the advisory.
-
Title — A brief summary of the advisory and the affected vulnerability.
-
Fabric — The network fabric impacted by the advisory.
-
Live Protect shield status — The current deployment status of the Live Protect shield (for example, Protected, Monitored).
-
Hits — The total number of exploit attempts detected for the advisory within the chosen time range.
You can sort the list by any of these columns, and filter the data using the time range drop-down list at the top of the Overview tab.
Recent security advisories
The Recent security advisories widget displays a list of the most recently detected security advisories in your network. You can use this widget to stay informed about new threats as they emerge.
The widget displays the following details for each advisory.
-
Severity — The severity level of the advisory (for example, Critical, Major, Minor).
-
Number of impacted devices — The number of devices affected by the advisory.
-
Advisory ID — The unique identifier of the advisory.
-
Description — A brief summary of the advisory and the affected vulnerability.
Click View all to navigate to the Security advisories tab to view the complete list of advisories.
Role-based access control (RBAC)
All widgets on the Overview tab display data only for the fabrics that you are authorized to access. Data aggregations, snapshots, and trend calculations are filtered per fabric based on your assigned roles and permissions. As a result, two users with different access levels see different counts, trends, and hit telemetry on the Overview tab.
Upgrade considerations
After you upgrade Nexus Dashboard from release 4.2.1 to 4.3.1, some widgets on the Overview tab might not immediately display historical data. The data sources that support these widgets are introduced in the current version and begin collecting data only after the upgrade completes.
Note the following data visibility behaviors after an upgrade.
-
Security advisories over time — The widget begins plotting data points after the upgrade completes and the first 30-minute snapshot job runs. Trends that you view immediately after the upgrade show data starting from the upgrade timestamp. You can view the full 30-day historical data only after Nexus Dashboard runs on current version for at least 30 days.
-
Top security advisories by hits — The widget does not display data for any time range before the upgrade date. You can view the full 30-day historical data only after Nexus Dashboard runs on current version for at least 30 days.
-
Hits by status — Total hit counts remain accurate for data collected before the upgrade. However, hit attribution to specific advisories is available only for data collected after the upgrade.
If you choose a time range that extends before the upgrade, the affected widgets display No data available for the unsupported portion of the range.
Security advisories
The Security advisories tab displays Cisco security advisories that affect your managed devices and the corresponding mitigation state for each device.
To view the Security advisories tab, navigate to Manage > Device Security > Security advisories.
The Security advisories tab includes the following sub-tabs.
For more information on aggregated, fabric-wide view of advisory exposure and Live Protect coverage, see Overview. To deploy or manage shields, see Live Protect overview.
Advisories
The Advisories sub-tab displays all Cisco Security Advisories detected across the devices managed by Nexus Dashboard.
You can use the Advisories sub-tab to assess potential risks and prioritize remediation, deploy Live Protect shields for one or more advisories, and track the mitigation state of each advisory across affected devices.
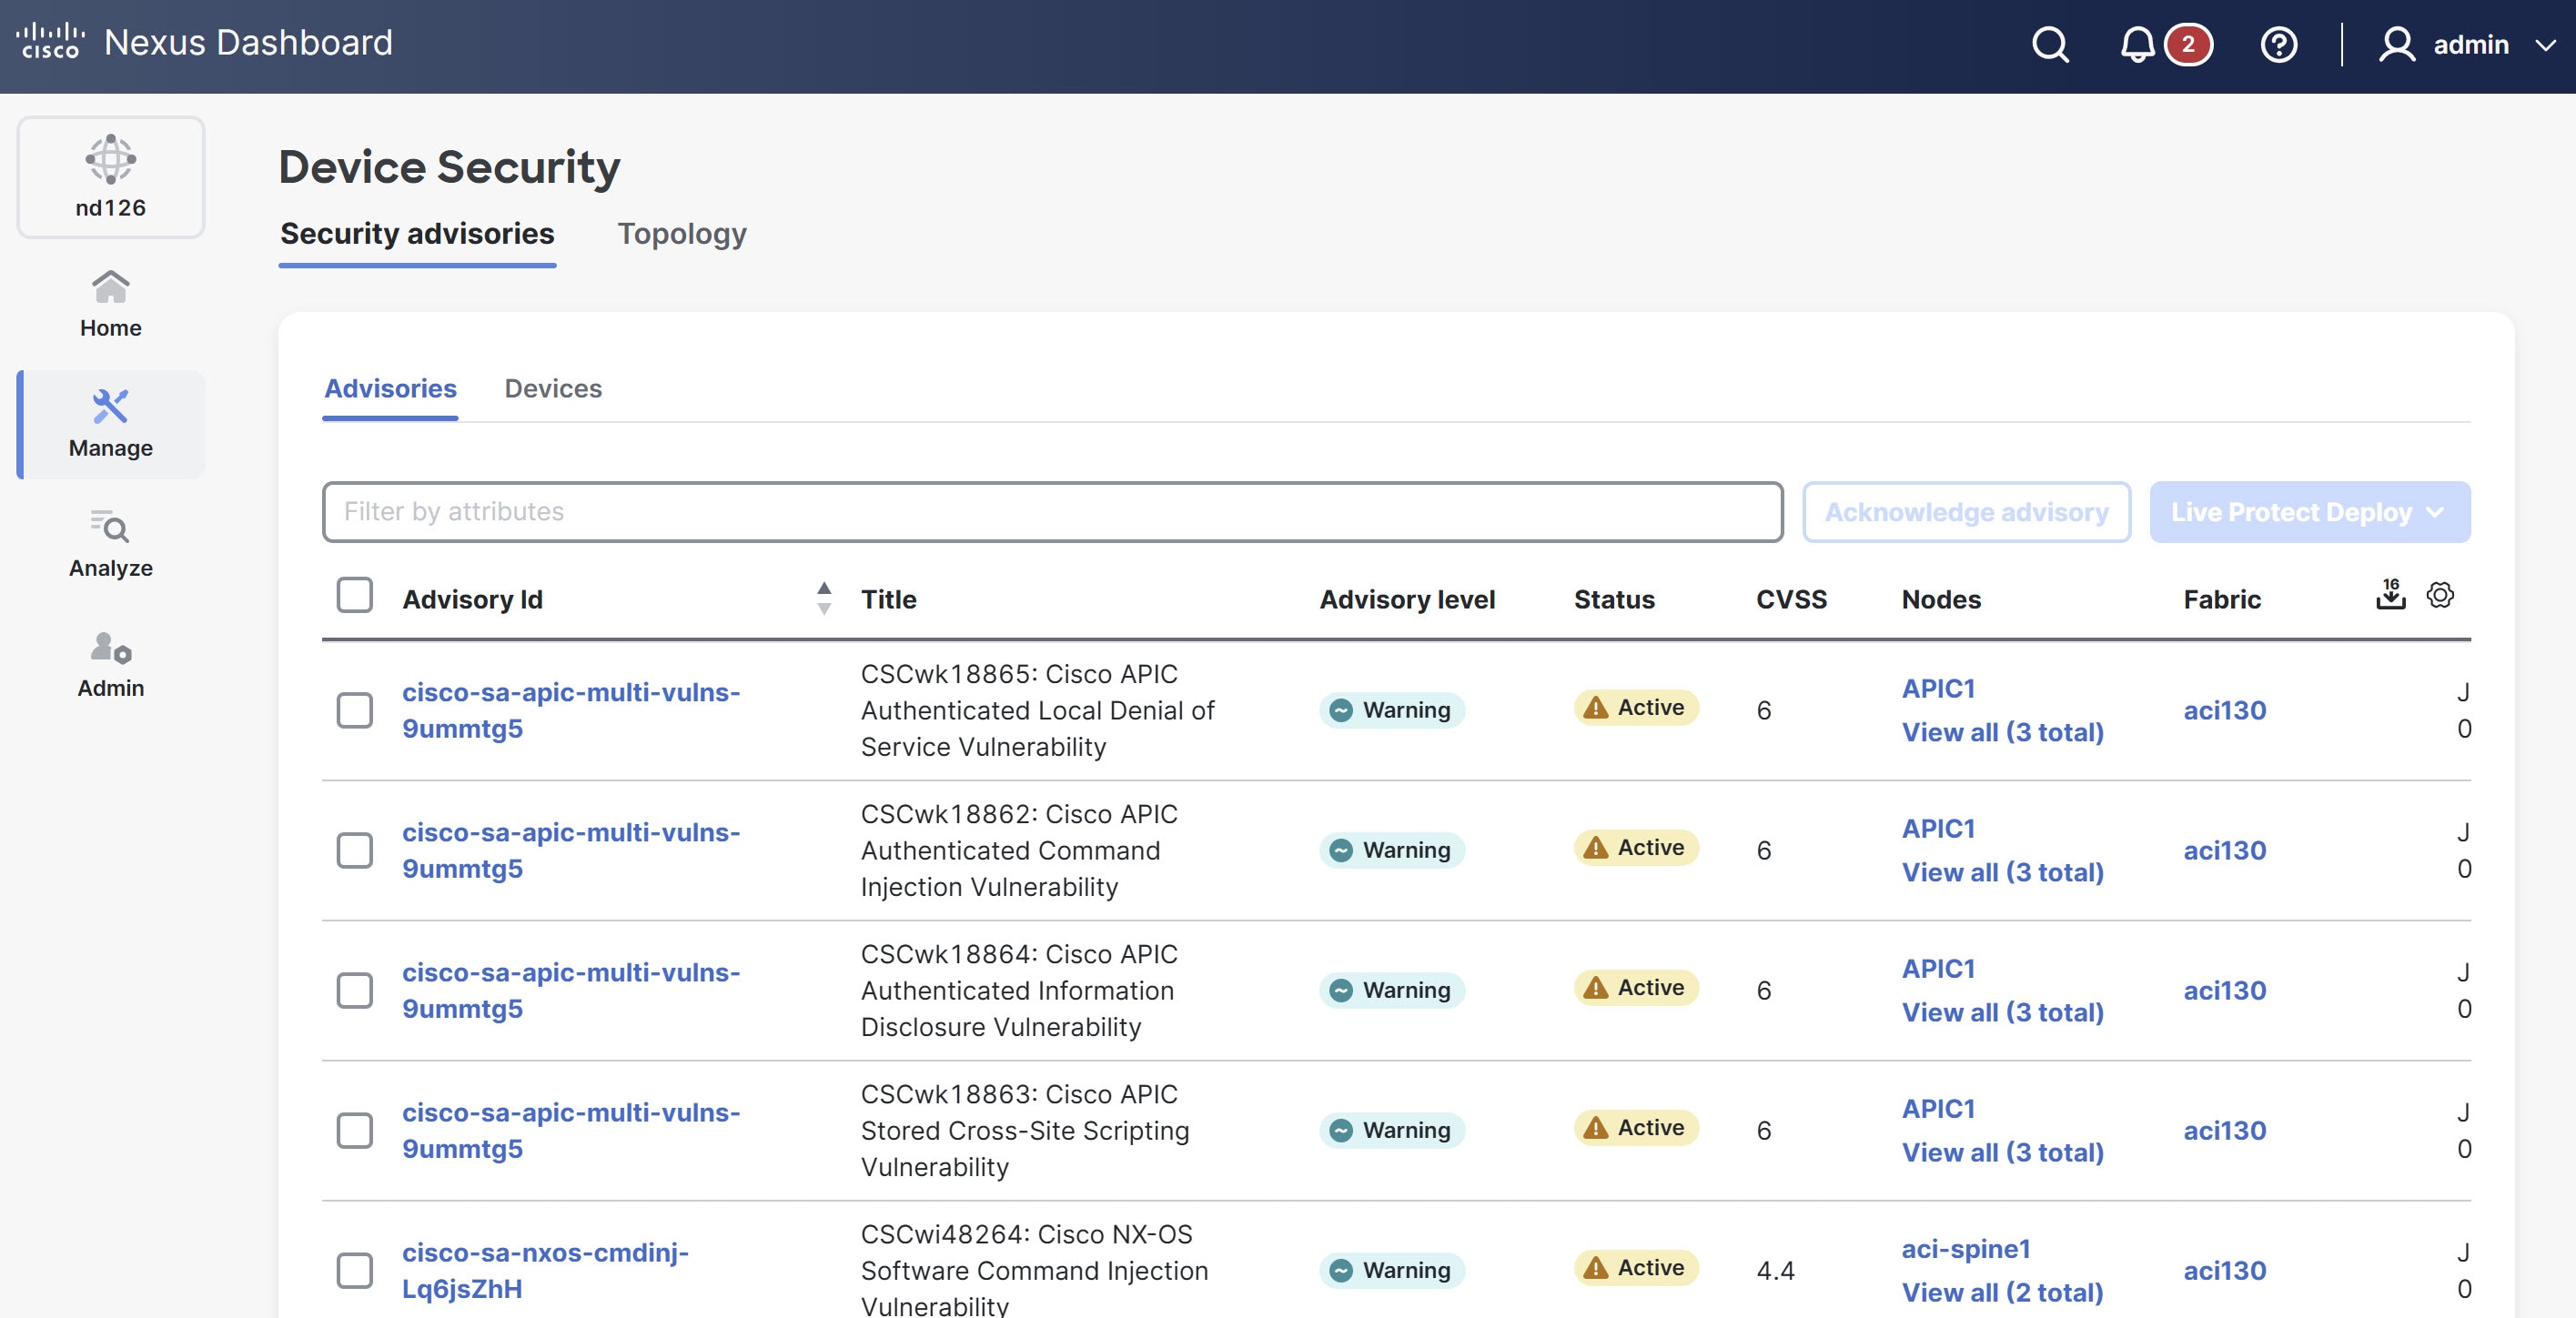
The Advisories table includes the following details.
| Field | Description |
|---|---|
|
Advisory ID |
Specifies a unique identifier for the advisory |
|
Title |
Provides a brief summary of the advisory and affected vulnerability. |
|
Advisory level |
Indicates the severity or priority of the advisory. |
|
Status |
Indicates the current state of the advisory. |
|
CVE |
Specifies the Common Vulnerabilities and Exposures (CVE) identifier assigned to the vulnerability. |
|
CVSS |
Indicates the Common Vulnerability Scoring System (CVSS) value that represents the severity of the vulnerability. |
|
Nodes |
Indicates the devices or endpoints affected by the advisory. Click the node name to view device details. |
|
Fabric |
Specifies the network fabric or logical domain impacted by the advisory. |
|
Detection time |
Indicates when the advisory was first detected. |
|
Last scan time |
Specifies the date and time when the system most recently scanned for this advisory. |
|
Live Protect shield status |
Specifies the aggregate mitigation state across all affected nodes for this advisory. Possible values include the following.
|
Devices
The Devices sub-tab lists all managed devices that Nexus Dashboard has scanned for security advisories. Each row represents a single device and shows its overall exposure, Live Protect configuration, and runtime mitigation state.
You can use the Devices sub-tab to determine which devices are exposed and how many advisories affect each device, verify that Live Protect is correctly configured and running on each device, identify devices where the config status does not match the operational status, and review the shield status of the device.
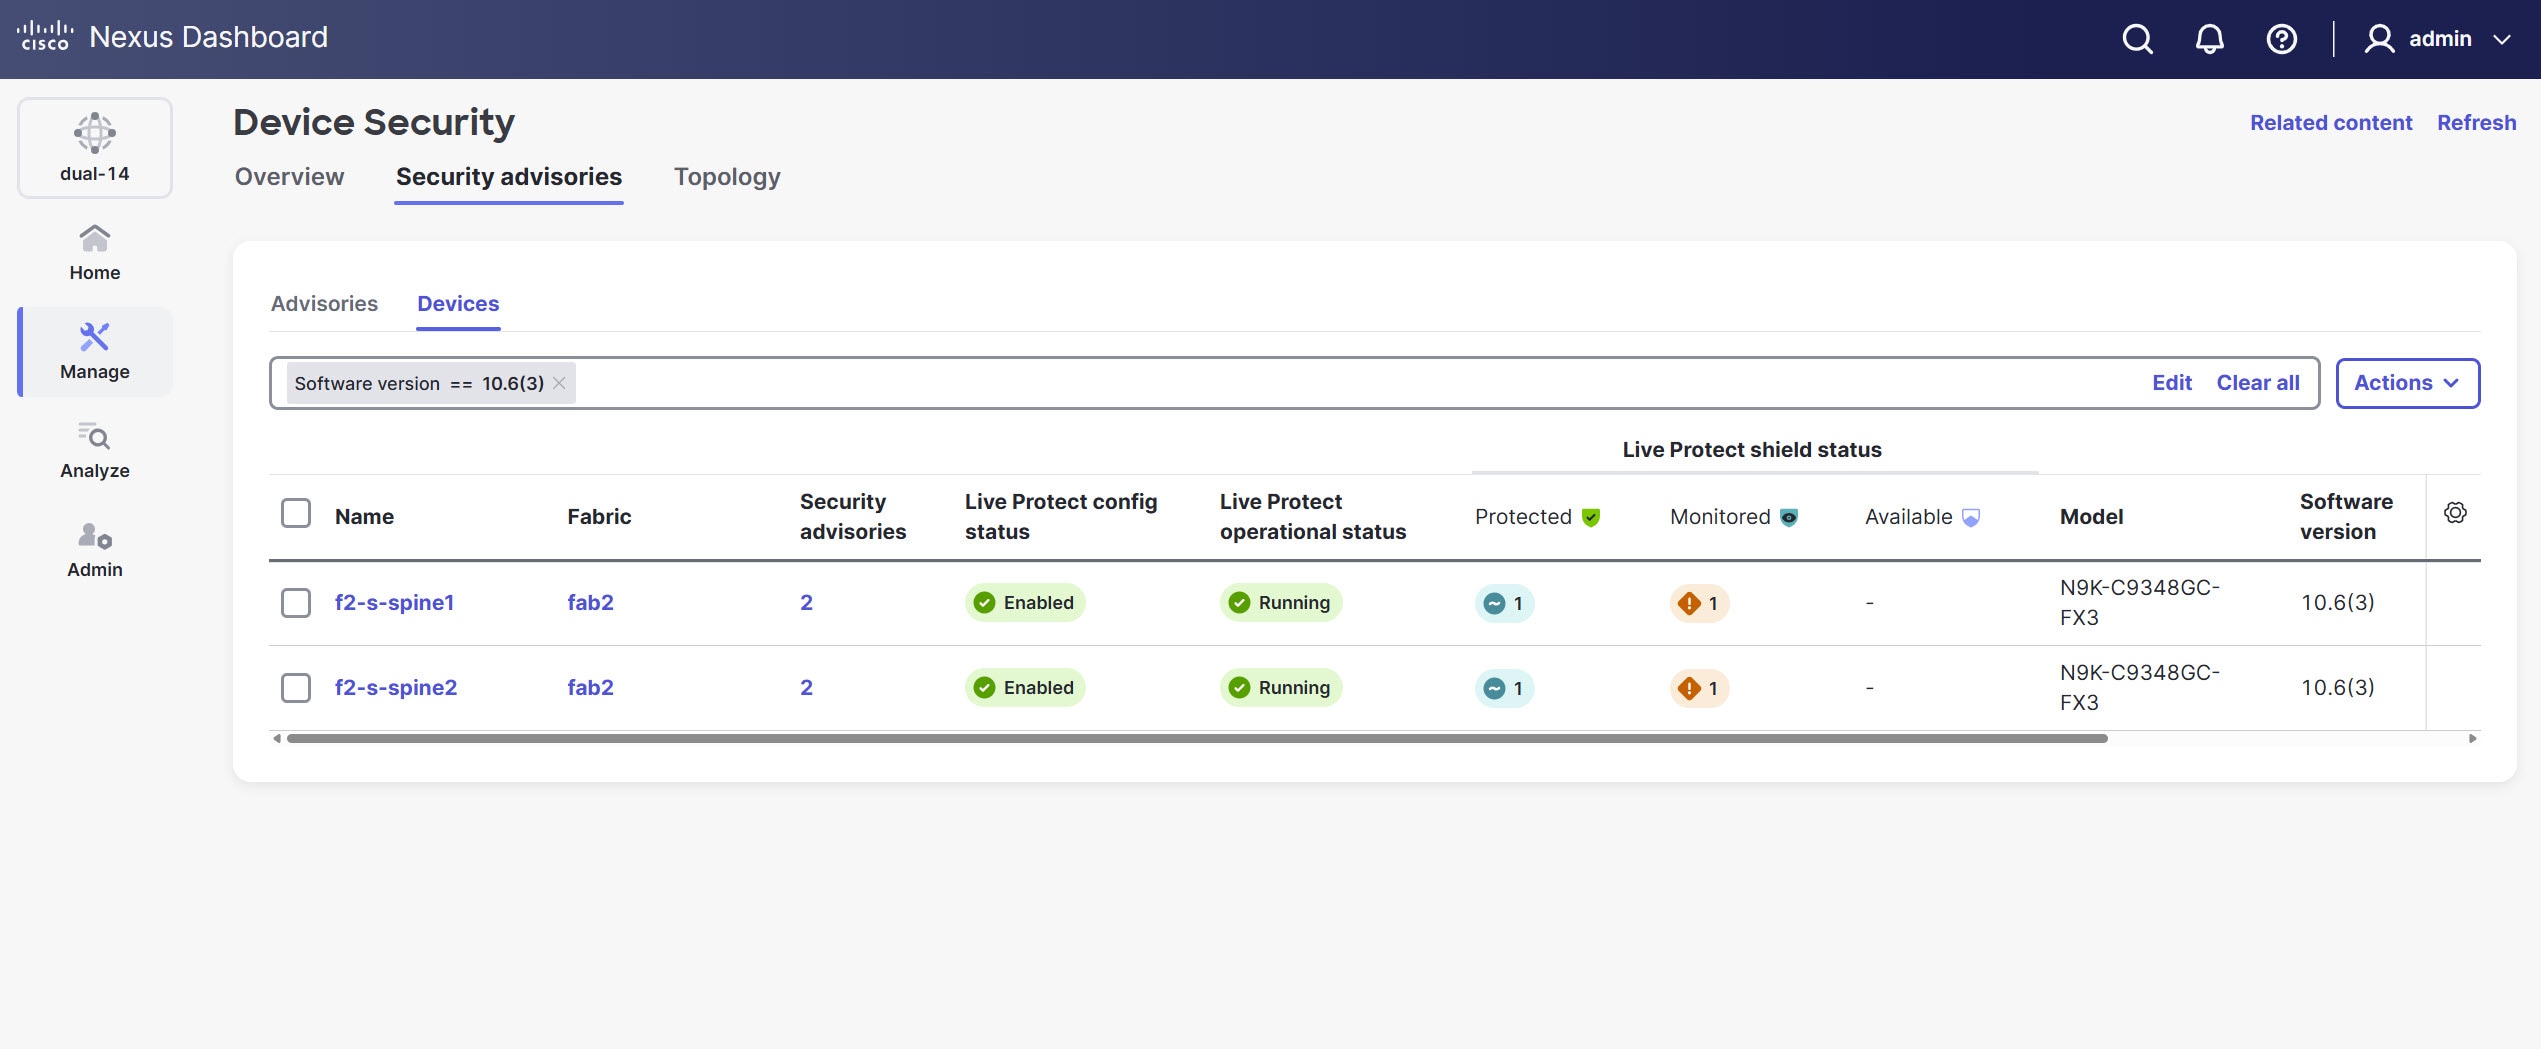
The Devices table includes the following details.
| Field | Description |
|---|---|
|
Name |
Specifies the hostname of the managed device. |
|
Fabric |
Indicates the network fabric or logical domain to which the device belongs. |
|
Security advisories |
Specifies the total number of active security advisories that affect this device. |
|
Live Protect config status |
Represents the Live Protect intent configured from Nexus Dashboard and pushed to the switch. It indicates the configured state of the Live Protect feature. Possible values include the following.
|
|
Live Protect operational status |
Represents the actual runtime state reported by the switch. It indicates whether Live Protect is currently running successfully on the device. Possible values include the following.
|
|
Live Protect shield status |
Provides a grouped count of shields applied to this device, broken down by state as follows:
|
|
Model |
Specifies the hardware model of the device. |
|
Software version |
Specifies the NX-OS software version currently running on the device. |
|
Total hit count |
Provides the cumulative number of times Live Protect shields have detected attempts to exploit vulnerabilities on this device. |
The Live Protect config status and Live Protect operational status are independent values.
-
Use config status to understand the intended state configured from Nexus Dashboard.
-
Use operational status to understand the actual running state on the switch.
For example, a device can have a config status of Enabled while the operational status as Failed, indicating that the configuration was pushed successfully but the runtime encountered an error. Always check both values when troubleshooting Live Protect coverage on a device.
Topology
The Topology tab provides a visual representation of the managed fabrics within your network. It allows you to quickly assess the security status of various fabrics and view details for specific devices to view their security status and Live Protect availability.
Follow these steps to view the Topology page.
-
Navigate to Manage > Device Security.
The Device Security page displays.
-
Click the Topology tab.
Nexus Dashboard displays the graphical view of all managed fabrics and their security status.
-
(Optional) To view specific device details within a fabric, click a fabric icon in the topology map.
The Topology page displays the following details.
-
Fabric map — provides a high-level overview of the network hierarchy.
-
Security Overview — provides details about specific devices and Live Protect availability.
Live Protect overview
Live Protect is a Cisco Nexus feature that enables rapid mitigation of certain security advisories on eligible Cisco N9000 Series switches. By deploying Live Protect shields directly to switches, you can protect your network from active threats without requiring a maintenance window or immediate software upgrade.
For more information, see Cisco N9000 Series NX-OS Security Configuration Guide.
Live Protect identifies security advisories affecting your devices. If an advisory can be mitigated, the system provides a signed Live Protect shield (Tetragon policy) in the form of an RPM package. You can deploy these shields to eligible switches in either monitor or protect mode. Live Protect tracks the status and impact of each shield, providing visibility through the Cisco Nexus user interface.
-
Protect mode — Policy actively blocks threat attempts, enforcing protection on the device.
-
Monitor mode — Policy logs exploit attempts but does not enforce protection.
-
Disable mode — Disables specific policy on the switch without removing the policy.
Live Protect shield deployment state and hit-count history are not backed up or restored in Nexus Dashboard, although shields may continue running on the switches. To learn about Live Protect restore capabilities, see Backing Up and Restoring Your Nexus Dashboard.
Prerequisites
-
Live Protect requires either connectivity from Nexus Dashboard to Cisco Intersight or a manual upload of the security advisory metadata using the air-gapped process. Ensure you provide one of these methods to fetch the latest security advisory metadata.
-
Ensure that telemetry is enabled and operational on all relevant devices.
-
Ensure that you enable Live Protect on devices. For more information, see Enable Live Protect.
Enable Live Protect
Follow these steps to enable Live Protect.
-
Navigate to Manage > Device Security.
The Device Security page displays.
-
Click the Security advisories tab and then click the Devices sub-tab.
-
In the Devices table, under Live Protect config status column, locate devices with a status of Not Enabled.
-
Choose device(s) you want to include.
-
From the Actions drop-down list, choose Enable Live Protect.
The Live Protect config status for the chosen devices transitions to Enabling, and then to Enabled when the configuration is successfully pushed to the switch. Once the switch reports the runtime state, the Live Protect operational status transitions to Initializing and then to Running.
Live Protect workflow
The Live Protect workflow guides you through mitigating security advisories on eligible Cisco N9000 Series switches. It includes detecting advisories, assessing device impact, deploying Live Protect shields, monitoring status, and clearing advisories after software updates. This process helps ensure your network remains protected from active threats with minimal operational disruption.
-
Detect advisories: Nexus Dashboard identifies active security advisories affecting your managed devices.
-
Assess impact: Review the devices impacted by advisories and eligible for Live Protect in the Security advisories table.
-
Deploy Live Protect shield: Choose the advisory and impacted devices. Choose Monitor (observe only) or Protect (block exploits) mode, then deploy the shield.
-
Monitor status: Track deployment progress, policy status, and exploit hit counts directly in Nexus Dashboard.
-
Upgrade and clear: When a software fix becomes available, upgrade your devices. Nexus Dashboard automatically clears the advisory and removes the Live Protect shield.
Deploy Live Protect shield
You can deploy a Live Protect shield from either the Advisories sub-tab (go to Manage > Device Security > Security advisories) or the Topology tab (go to Manage > Device Security > Topology).
You can deploy Live Protect shields only for detected security advisories. Certain security advisories are detected as part of Bug scan. To detect these advisories, run an on-demand Bug scan or wait for the next timer-based Bug scan. A Bug scan is attempted for each device approximately every 7 to 14 days, depending on the number of nodes and fabrics in the Nexus Dashboard cluster. For information about Bug scan, refer to the "Collecting information on bugs that might affect your network using Bug scan" section in Analyzing and Troubleshooting Your Network.
Deploy Live Protect shield from the Advisories sub-tab
Follow these steps to deploy the Live Protect shield from Advisories sub-tab.
-
Navigate to Manage > Device Security.
The Device Security page displays.
-
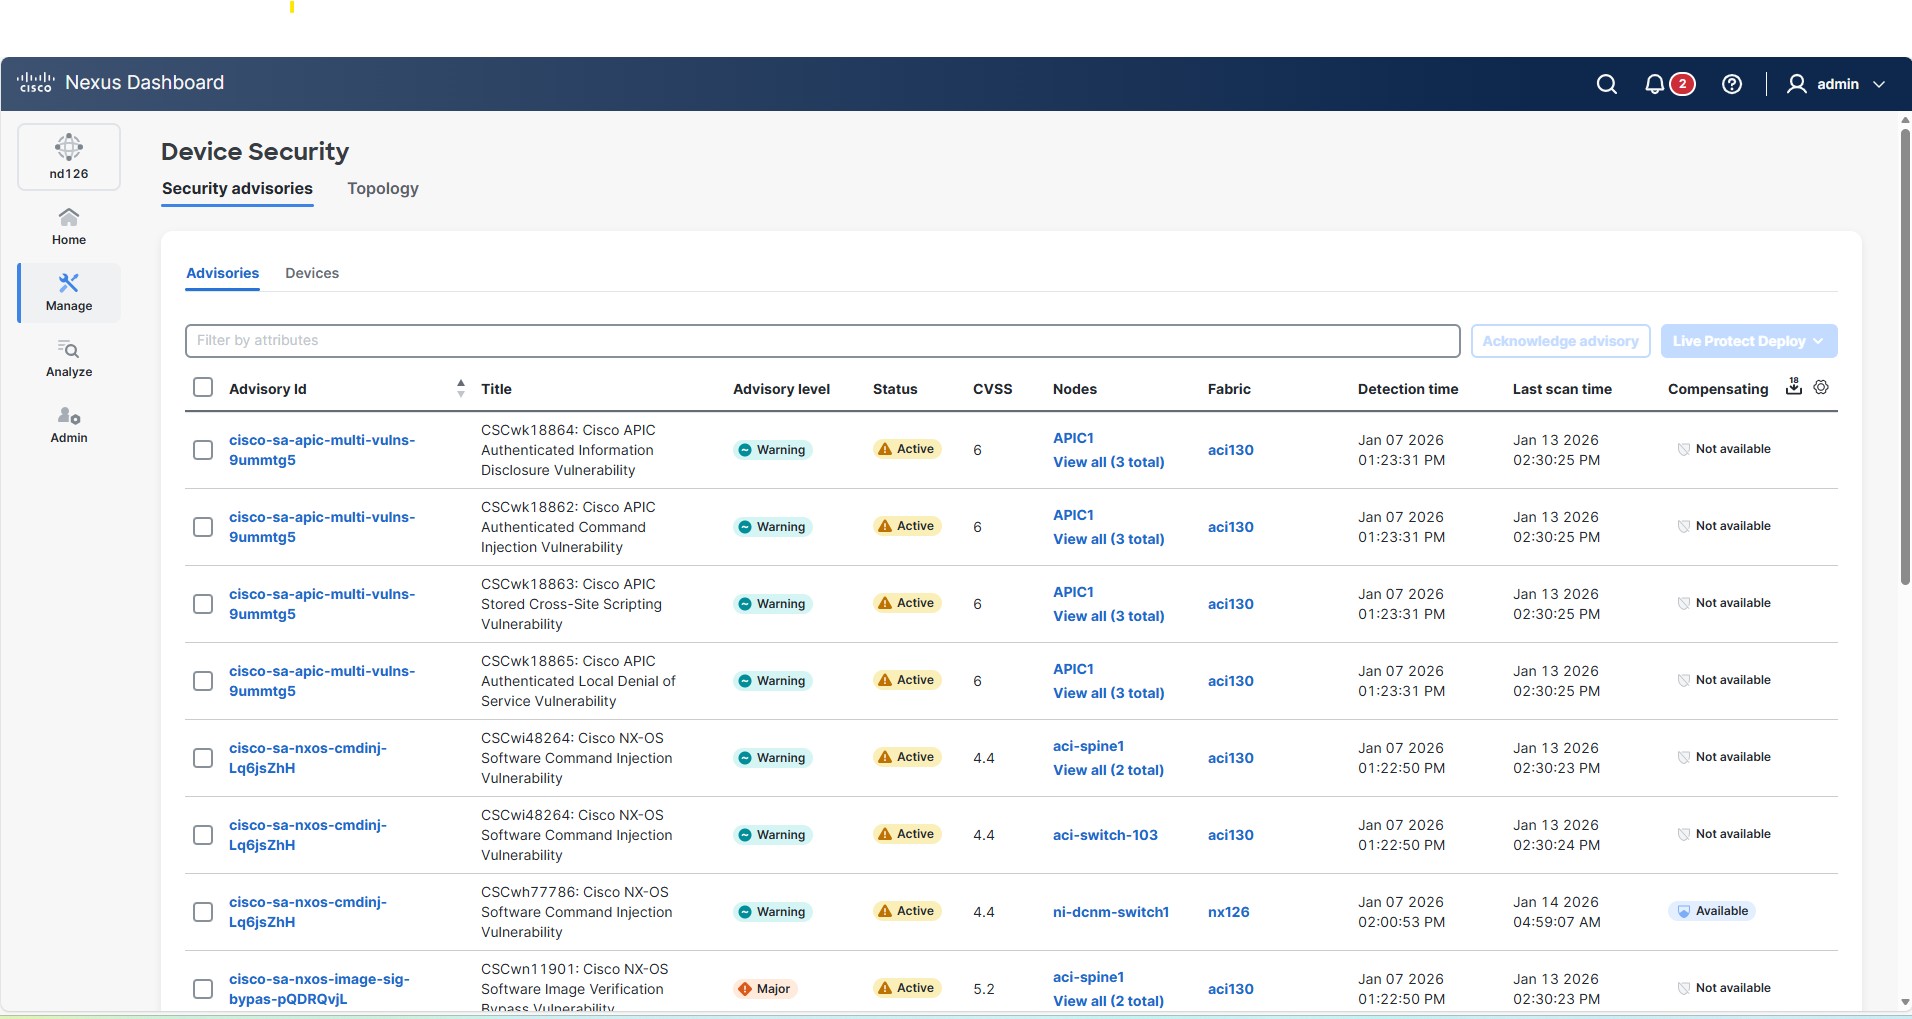
Click the Security advisories tab and then click the Advisories tab.
-
Under the Advisories tab, identify a security advisory that has the Live Protect shield status as Available.
Following are the live Protect shield statuses.
-
Protected — All impacted devices have a Live Protect shield in protection mode.
-
Monitoring — All impacted devices have a Live Protect shield in monitoring mode.
-
Partially applied — Some devices are protected, others are not.
-
Available — A Live Protect shield exists but is not deployed.
-
Not available — No Live Protect shield exists.
-
-
Click the check box next to the Advisory ID.
-
From the Actions drop-down list, choose Deploy in protect mode.
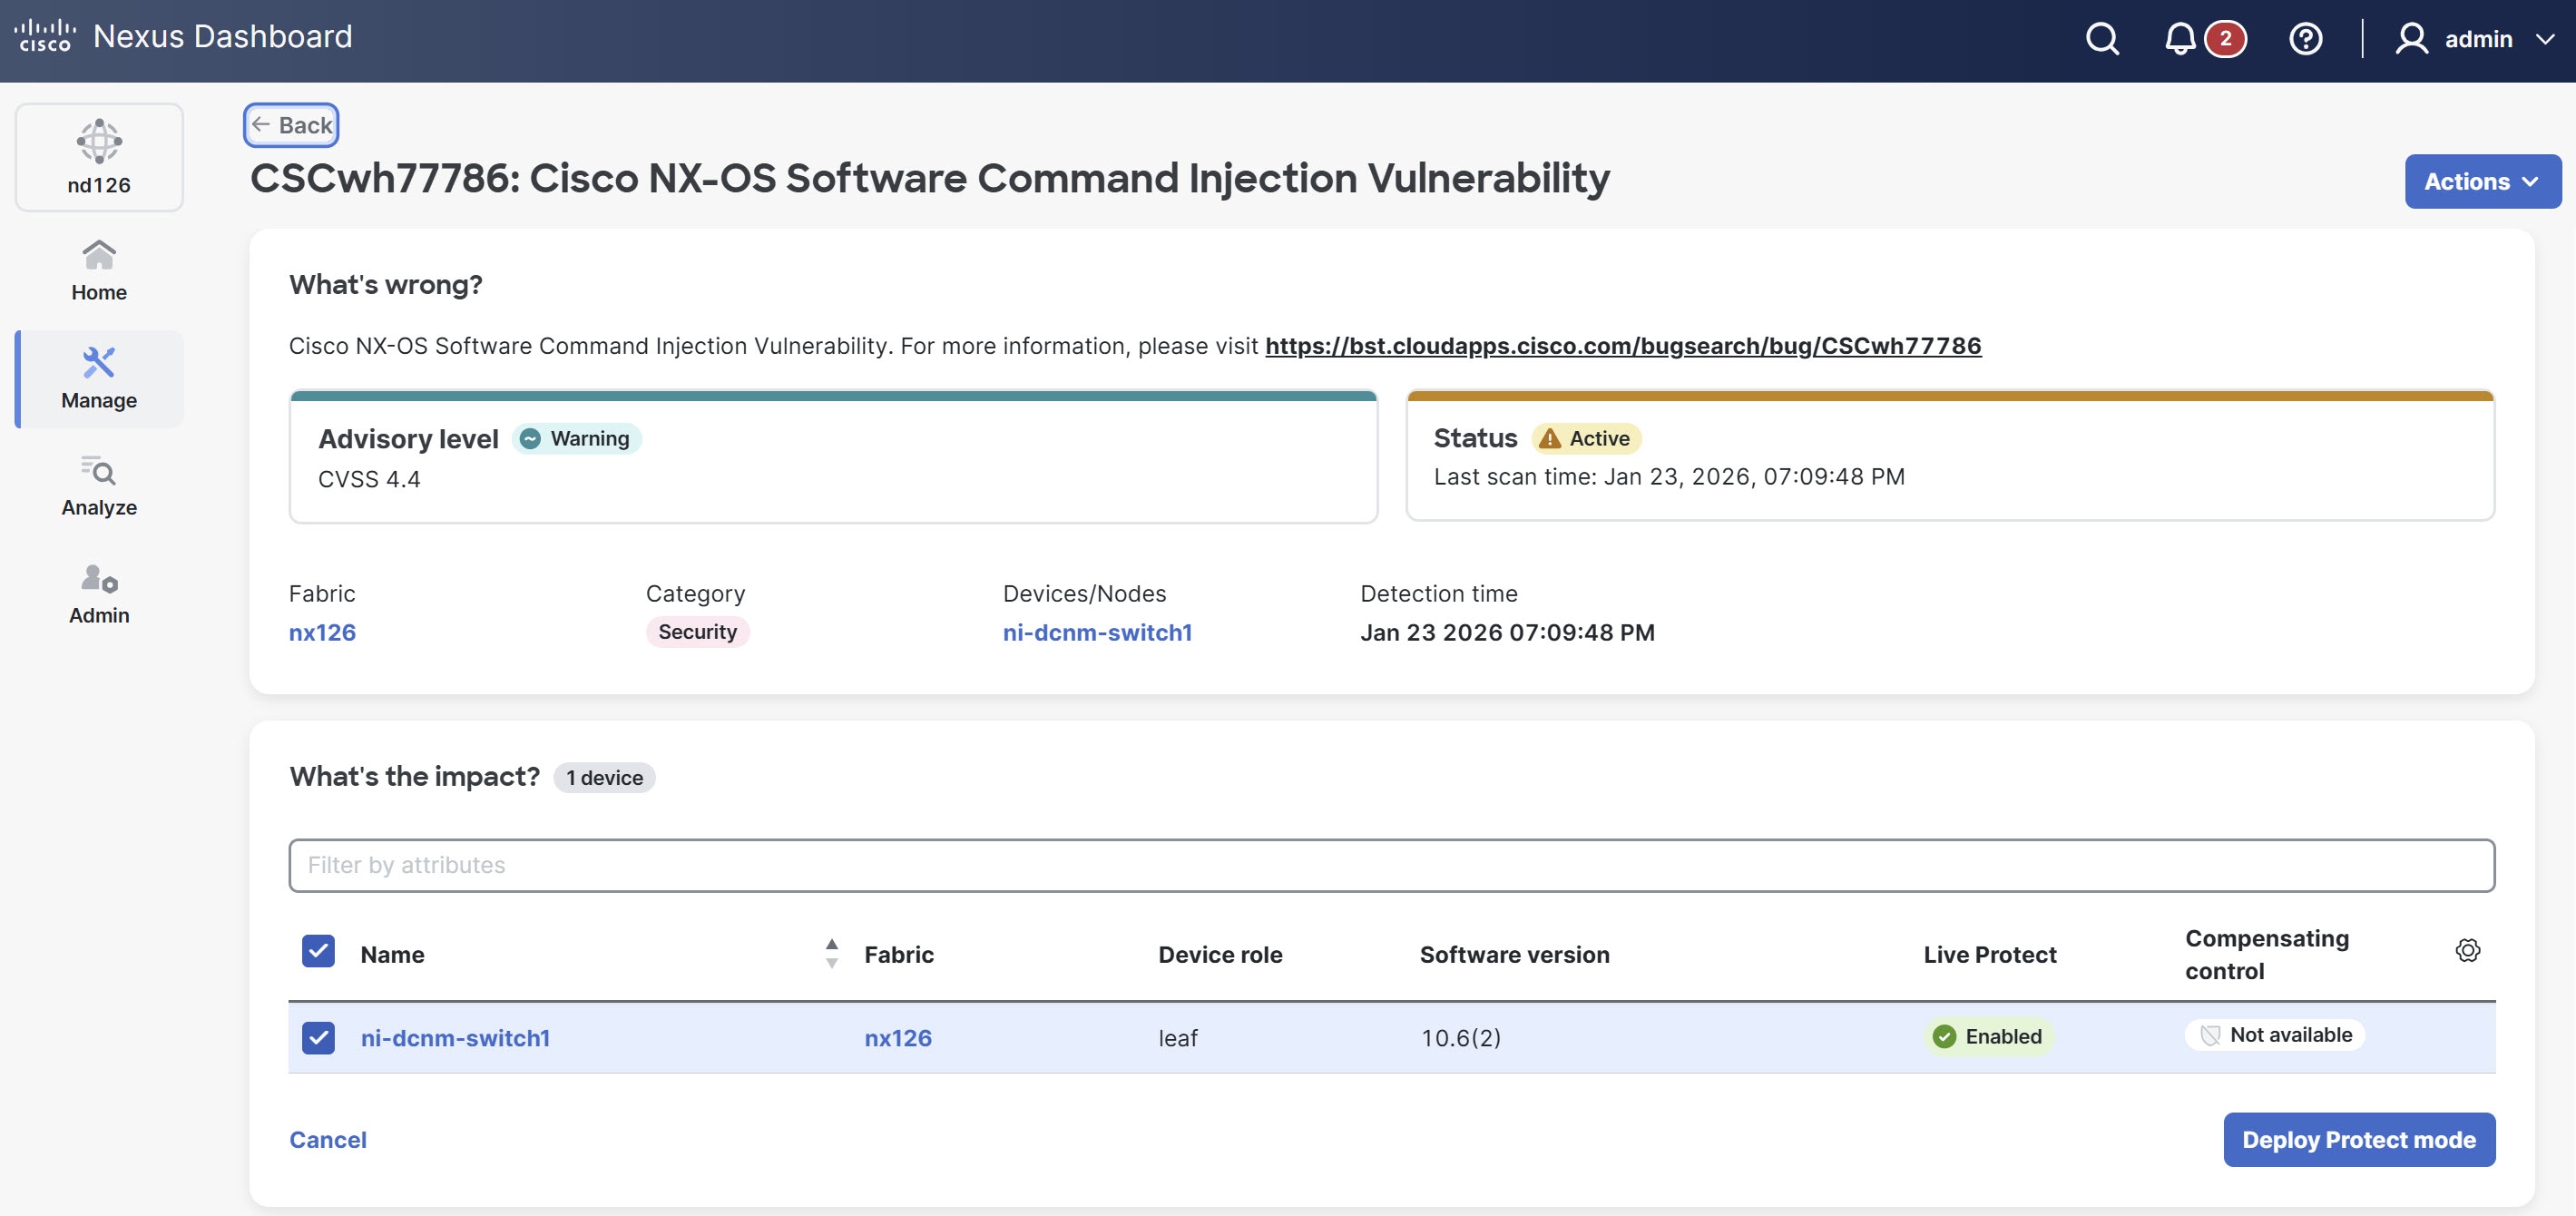
The advisory details page displays.
-
Under What’s the impact, choose the affected devices.
-
From the Actions drop-down list, choose Deploy in protect mode.
The status of the advisory changes to Protected in the Advisories table when all devices report successful deployment.
You can view the following statuses for the security advisories.
-
Active — No Live Protect shield applied (Red).
-
Protected — All impacted devices have a Live Protect shield in protection mode (Green).
-
Partially protected — Some devices protected, others monitoring or not deployed (Orange).
-
Monitoring — Nexus Dashboard deploys a Live Protect shield in monitor mode on all impacted devices, logging threat attempts without enforcing protection.
-
Cleared — Displayed when advisory is cleared (SW version upgrade).
-
Deploy Live Protect shield from the Topology tab
Follow these steps to deploy the Live Protect shield from the Topology tab
-
Navigate to Manage > Device Security.
The Device Security page displays.
-
Click the Topology tab
-
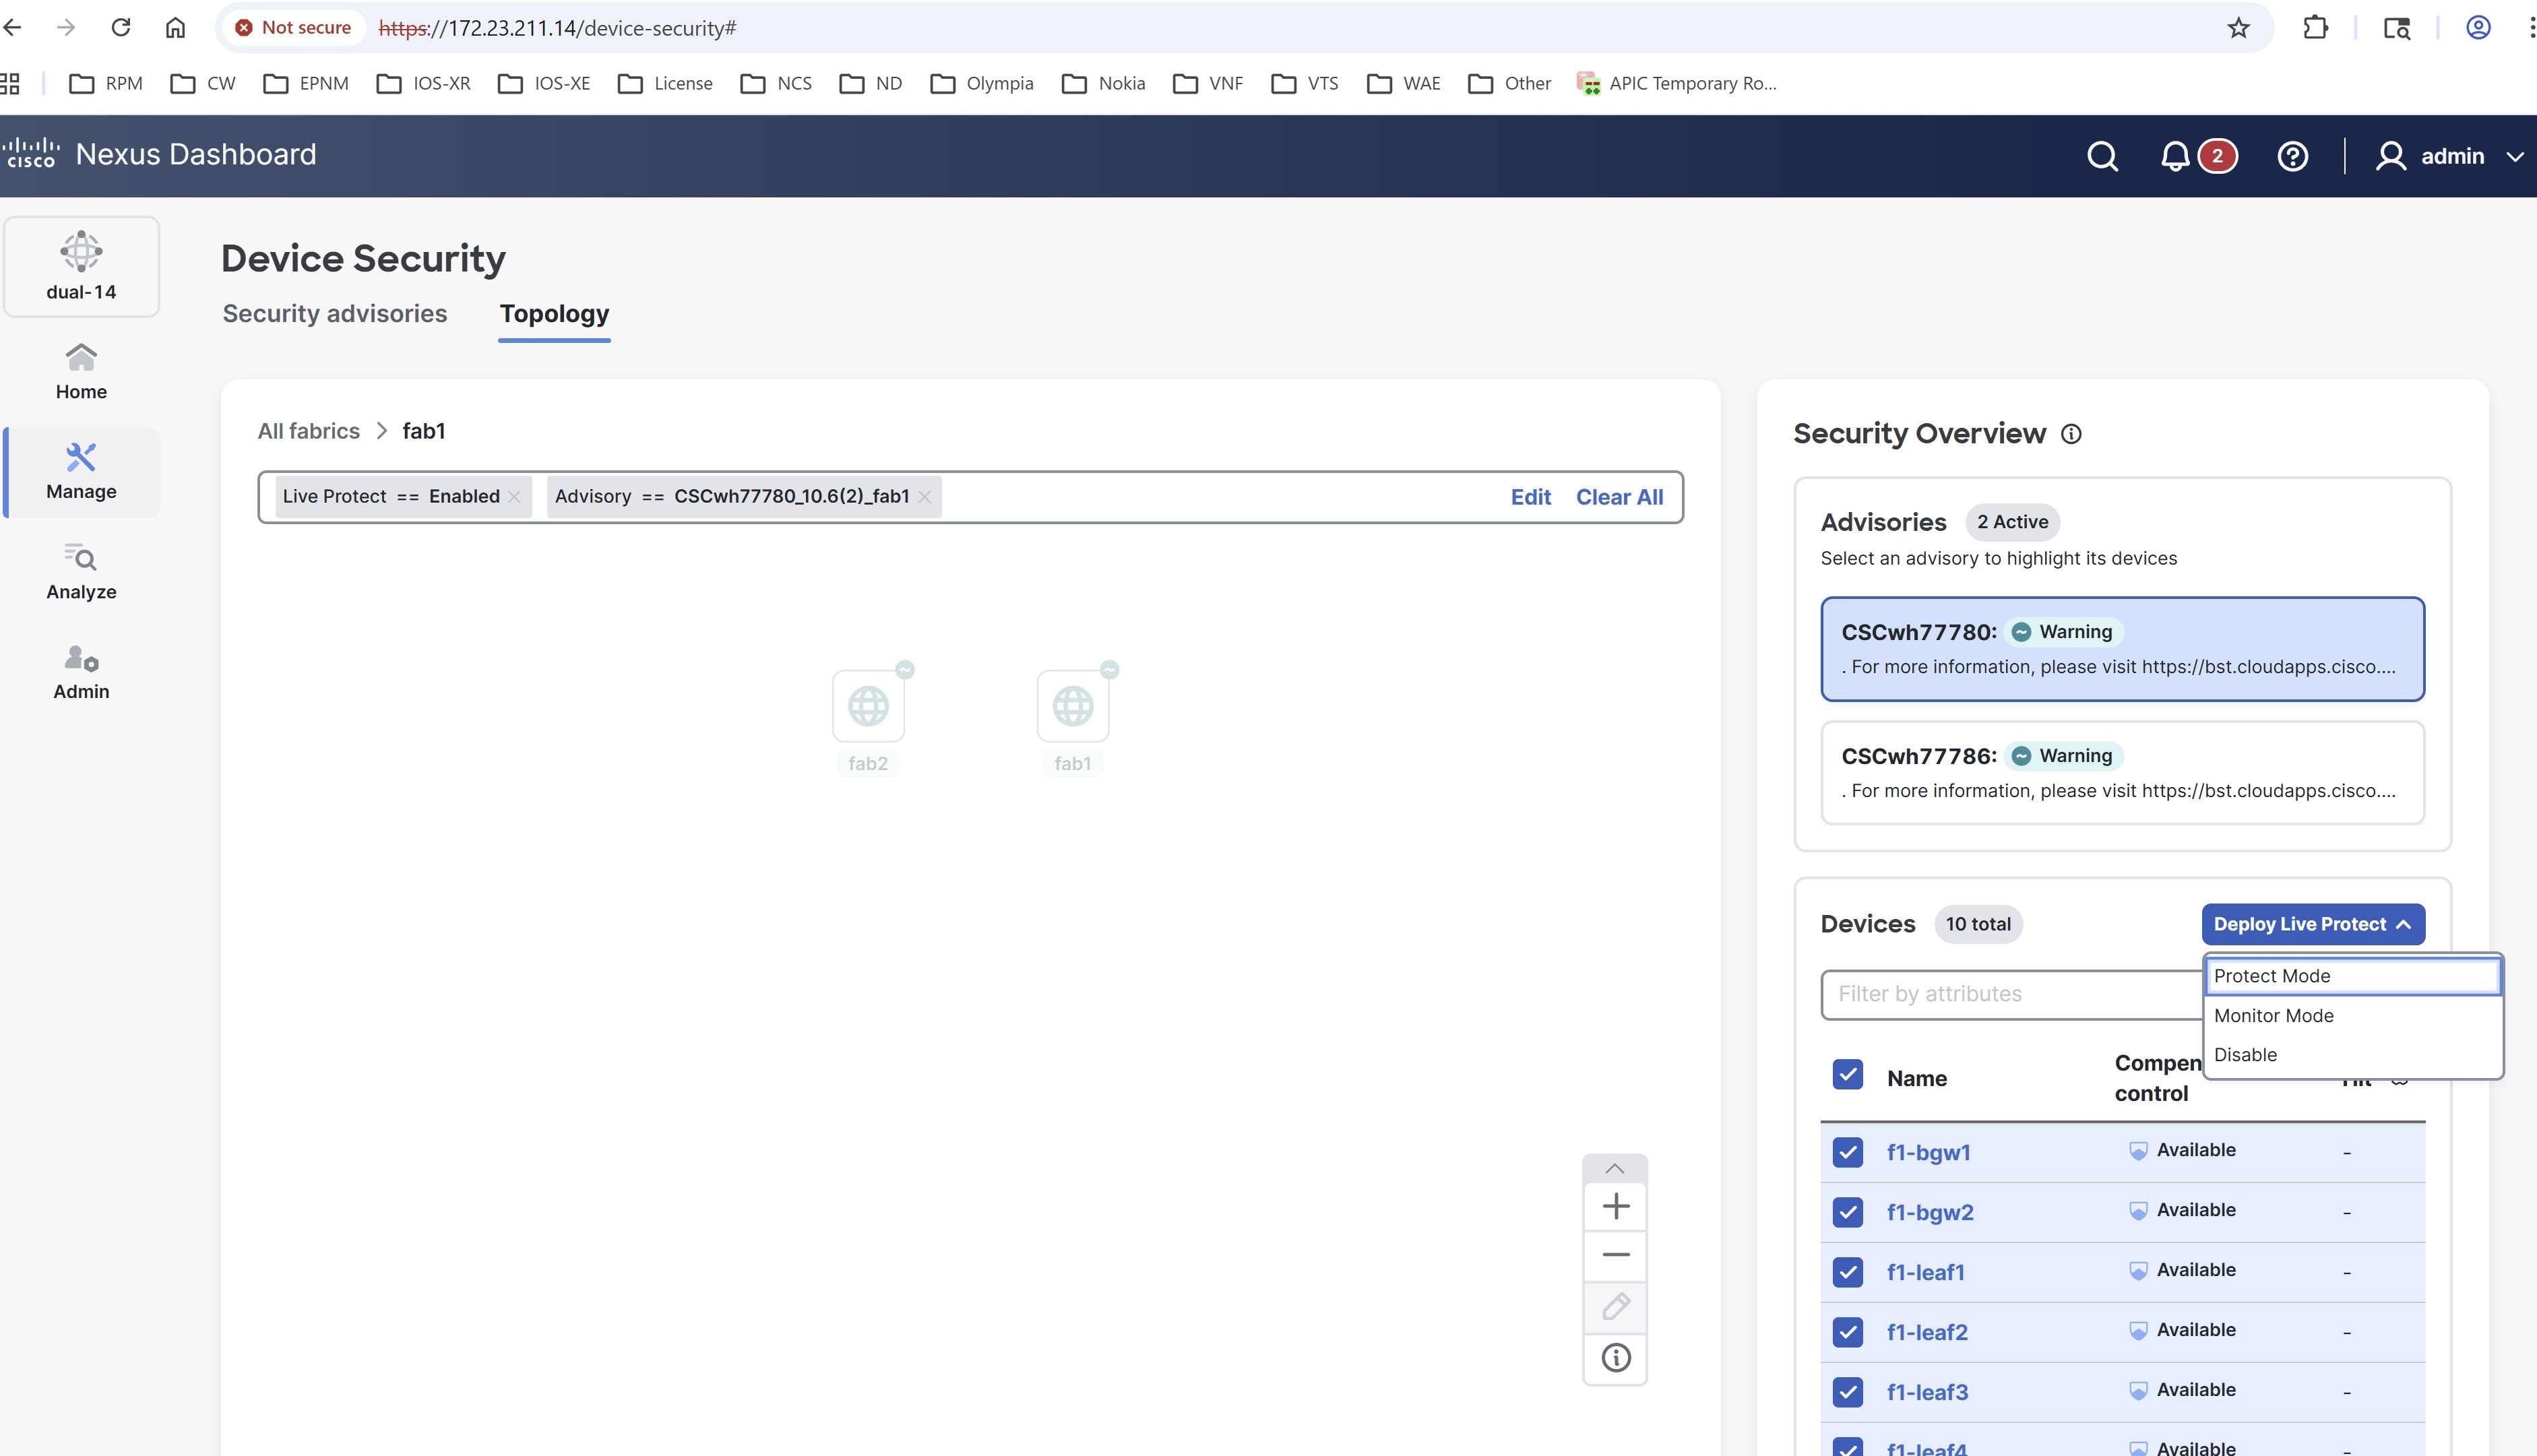
Double-click the fabric to view the switches with security advisories.
-
In the Security overview pane on the right, under Advisories, you can view the current advisories for the switch and under Devices, you can view the affected devices.
-
Choose the advisory.
-
Click the check box next to Name to choose one or more devices.
-
From the Actions drop-down list, choose Deploy in protect mode.
Copyright
THE SPECIFICATIONS AND INFORMATION REGARDING THE PRODUCTS IN THIS MANUAL ARE SUBJECT TO CHANGE WITHOUT NOTICE. ALL STATEMENTS, INFORMATION, AND RECOMMENDATIONS IN THIS MANUAL ARE BELIEVED TO BE ACCURATE BUT ARE PRESENTED WITHOUT WARRANTY OF ANY KIND, EXPRESS OR IMPLIED. USERS MUST TAKE FULL RESPONSIBILITY FOR THEIR APPLICATION OF ANY PRODUCTS.
THE SOFTWARE LICENSE AND LIMITED WARRANTY FOR THE ACCOMPANYING PRODUCT ARE SET FORTH IN THE INFORMATION PACKET THAT SHIPPED WITH THE PRODUCT AND ARE INCORPORATED HEREIN BY THIS REFERENCE. IF YOU ARE UNABLE TO LOCATE THE SOFTWARE LICENSE OR LIMITED WARRANTY, CONTACT YOUR CISCO REPRESENTATIVE FOR A COPY.
The Cisco implementation of TCP header compression is an adaptation of a program developed by the University of California, Berkeley (UCB) as part of UCB’s public domain version of the UNIX operating system. All rights reserved. Copyright © 1981, Regents of the University of California.
NOTWITHSTANDING ANY OTHER WARRANTY HEREIN, ALL DOCUMENT FILES AND SOFTWARE OF THESE SUPPLIERS ARE PROVIDED “AS IS" WITH ALL FAULTS. CISCO AND THE ABOVE-NAMED SUPPLIERS DISCLAIM ALL WARRANTIES, EXPRESSED OR IMPLIED, INCLUDING, WITHOUT LIMITATION, THOSE OF MERCHANTABILITY, FITNESS FOR A PARTICULAR PURPOSE AND NONINFRINGEMENT OR ARISING FROM A COURSE OF DEALING, USAGE, OR TRADE PRACTICE.
IN NO EVENT SHALL CISCO OR ITS SUPPLIERS BE LIABLE FOR ANY INDIRECT, SPECIAL, CONSEQUENTIAL, OR INCIDENTAL DAMAGES, INCLUDING, WITHOUT LIMITATION, LOST PROFITS OR LOSS OR DAMAGE TO DATA ARISING OUT OF THE USE OR INABILITY TO USE THIS MANUAL, EVEN IF CISCO OR ITS SUPPLIERS HAVE BEEN ADVISED OF THE POSSIBILITY OF SUCH DAMAGES.
Any Internet Protocol (IP) addresses and phone numbers used in this document are not intended to be actual addresses and phone numbers. Any examples, command display output, network topology diagrams, and other figures included in the document are shown for illustrative purposes only. Any use of actual IP addresses or phone numbers in illustrative content is unintentional and coincidental.
The documentation set for this product strives to use bias-free language. For the purposes of this documentation set, bias-free is defined as language that does not imply discrimination based on age, disability, gender, racial identity, ethnic identity, sexual orientation, socioeconomic status, and intersectionality. Exceptions may be present in the documentation due to language that is hardcoded in the user interfaces of the product software, language used based on RFP documentation, or language that is used by a referenced third-party product.
Cisco and the Cisco logo are trademarks or registered trademarks of Cisco and/or its affiliates in the U.S. and other countries. To view a list of Cisco trademarks, go to this URL: https://www.cisco.com/go/trademarks. Third-party trademarks mentioned are the property of their respective owners. The use of the word partner does not imply a partnership relationship between Cisco and any other company. (1110R)
© 2017-2026 Cisco Systems, Inc. All rights reserved.
Americas Headquarters
Cisco Systems, Inc.
170 West Tasman Drive
San Jose, CA 95134-1706
USA
https://www.cisco.com
Tel: 408 526-4000
800 553-NETS (6387)
Fax: 408 527-0883