
New and changed information
The following table provides an overview of the significant changes up to this current release. The table does not provide an exhaustive list of all changes or of the new features up to this release.
| Release Version | Feature | Description |
|---|---|---|
|
Nexus Dashboard 4.2.1 |
Dark mode support |
Beginning with release 4.2.1, Nexus Dashboard allows you to customize color themes to personalize the visual appearance based on your preference. For more information, see Customize color themes. |
|
Nexus Dashboard 4.2.1 |
System update notifications |
Beginning with release 4.2.1, Nexus Dashboard provides automated alerts to notify you when a new recommended software version is available. For more information, see System update notifications. |
Nexus Dashboard platform overview
Cisco Nexus Dashboard is a unified management platform for data center fabrics, providing a central console for real-time analytics, visibility, assurance of network policies, and policy orchestration across multiple data center fabrics such as Cisco ACI and NX-OS.
Nexus Dashboard provides a common platform and modern technology stack, simplifying the life cycle management of the different modern applications and reducing the operational overhead to run and maintain these applications. It also provides a central integration point for external 3rd party applications with the locally-hosted applications.
Nexus Dashboard is the comprehensive management solution for ACI as well as NX-OS deployments spanning LAN fabric, SAN fabric, and IP Fabric for Media (IPFM) networks in data centers powered by Cisco. Nexus Dashboard also supports other devices, such as IOS-XE switches, IOS-XR routers, and non-Cisco devices. Being a multi-fabric controller, Nexus Dashboard manages multiple deployment models such as VXLAN EVPN, classic 3-tier, FabricPath, and routed-based fabrics for LAN while providing ready-to-use control, management, monitoring, and automation capabilities for all these environments. In addition, Nexus Dashboard, when you select SAN installation, Cisco Nexus Dashboard automates Cisco MDS switches and Cisco Nexus-family infrastructure in NX-OS mode with a focus on storage-specific features and analytics capabilities.
For more information about deployment, available form factors, and scale and cluster sizing guidelines and limitations, see Nexus Dashboard Deployment and Upgrade Guide.
GUI overview
After you deploy the Nexus Dashboard cluster, you can use the GUI to perform all remaining actions. To access the Nexus Dashboard GUI, open a web browser and navigate to the management IP address of any cluster node.
https://<node-mgmt-ip>

Nexus Dashboard GUI displays only the objects and settings that the logged-in user has permission to access. The following sections describe all GUI elements as visible to an admin user. For more information on user configuration and permissions, see Configuring Users and Security.
Navigation bar and user preferences
As you navigate through the Nexus Dashboard UI, the top right navigation bar includes the following menu options.
-
The magnifying glass icon allows you to search for specific information, features, or data within the Nexus Dashboard.
-
The bell icon alerts you to system updates, messages, or activities relevant to your account. see System update notifications.
-
The question icon includes the following options.
-
What’s new — provides information on the new features available in the current release.
-
Journey — offers a step-by-step workflow to guide you through setting up your Nexus Dashboard and highlights key features to explore.
-
Help Center — provides comprehensive documentation and support articles for Nexus Dashboard.
-
REST API Tool — Provides tools for integrating with Nexus Dashboard using REST APIs and link to API documentation.
-
About Nexus Dashboard — displays information such as the software version, build number, and copyright details.
-
-
The Admin drop-down list includes the following options.
-
Log out — allows you to log out of Nexus Dashboard.
-
User preferences — enables you to specify your Time zone preference. This feature is particularly useful for multiple users across different geographic locations, allowing them to conveniently view any time-specific information in the UI according to their local time.
-
When you set the option to
Automatic, your browser uses your local time zone by default. -
When you set the option to
Manual, you choose a geographic location from the map, and Nexus Dashboard applies the closest time zone.
The time zone conversion is performed only in the UI. The backend and APIs continue to return timestamps in their saved format, which is typically UTC. This release supports global time zone configuration for Nexus Dashboard; if you have multiple fabrics across different geographic regions, all source time zones are mapped to the configured time zone.
-
-
-
Change password — allows you to update your password for enhanced security. For more information, see Updates to password management.
-
Manage API keys — provides functionality to manage your API keys.
-
Color theme — allows you to customize the visual appearance of the Nexus Dashboard UI.
For more information, see Customize color themes.
System update notifications
Beginning with release 4.2.1, Nexus Dashboard provides automated alerts to notify you when a new recommended software version is available.
To receive these alerts, Nexus Dashboard must retrieve version metadata through an Intersight connection or an air-gapped update process. You must maintain an Intersight connection to receive the latest software update notifications automatically. For more information, see Upload metadata using air-gapped mechanism.
You can view the system update notifications in the following locations.
-
Notification banner
A yellow banner appears at the top of the GUI for users with the super-admin role. Click Snooze for 1 week to hide the banner for 1 week. Nexus Dashboard removes the banner once you update the system to the latest software version. The banner reappears automatically if you do not update the system before the snooze period expires.
Click View it on cisco.com to view the release details.
-
Notifications pane
Click the Bell icon in the top navigation bar to view update details. The System software available section displays the alert and provides a link to view and manage the available software.
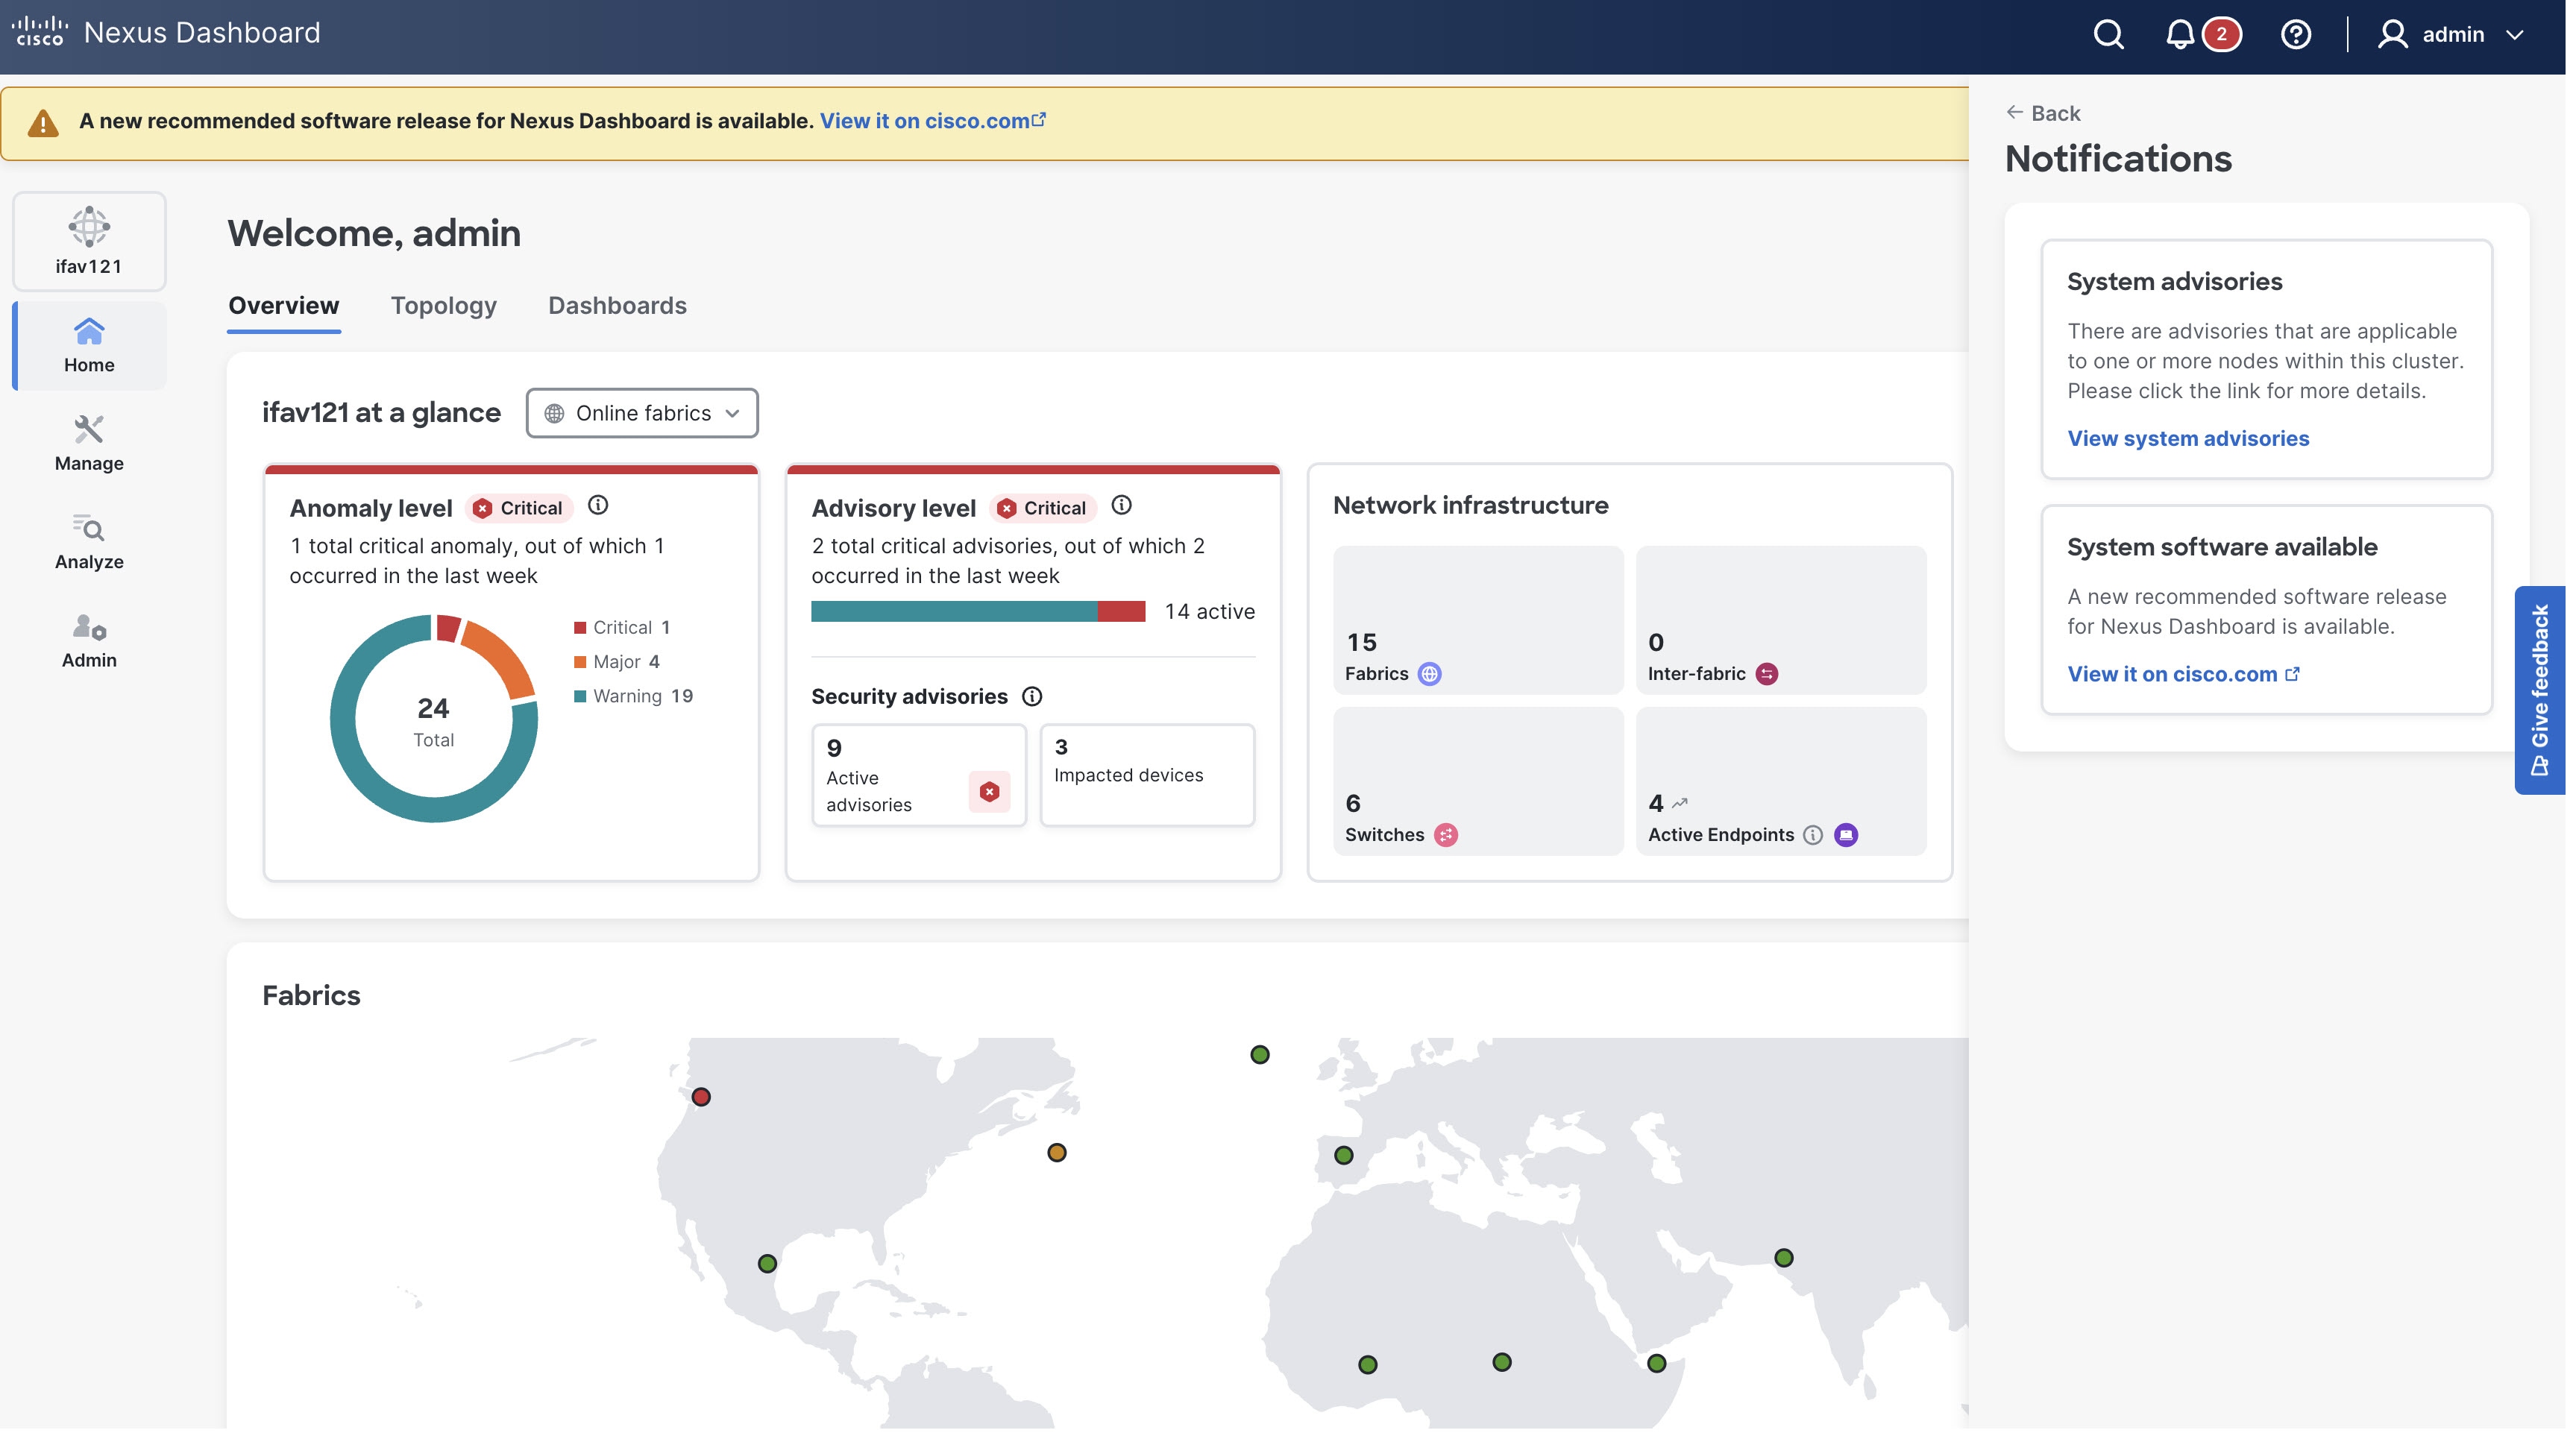
When you click Snooze, the system hides the notification banner for the specified snooze period but keeps the notification bell icon alert visible. The notification bell icon alert stays visible until you update the system to the latest software version. Nexus Dashboard automatically removes both the banner and the notification bell icon alert after you successfully update the system to the latest software version.
Customize color themes
Nexus Dashboard allows you customize color themes to personalize the visual appearance based on your preference. Choosing a suitable color theme makes it easier to view Nexus Dashboard in low-light environments, such as Network Operations Centers (NOCs).
Follow these steps to customize color themes.
-
Click the admin drop-down list from the top right navigation bar.

-
Under Color theme, choose the desired theme.
You can choose one of the following options.
-
Classic light — uses a traditional light color palette with high contrast between text and backgrounds.
-
Classic dark — features a dark background with lighter text and accents colors, offering a modern and reduced-glare interface.
-
Midnight dark — offers deeper, richer dark interface compared to classic dark theme.
-
Nexus Dashboard immediately applies the theme across the entire UI, displaying the changes instantly. You can switch themes at any time to suit your needs and preferences.
Nexus Dashboard does not apply the Classic dark and Midnight dark themes when you navigate to Admin > Intersight.
The following images illustrate the Classic dark and Midnight dark themes in Nexus Dashboard.
Color themes are associated with individual user preferences. The login page remains in the default theme. Nexus Dashboard applies the color theme that you choose only after you log in.
Updates to password management
Nexus Dashboard now has these updates to password management:
-
A new security enhancement is now implemented where local users are required to change their password in these situations:
-
When the local user logs into the Nexus Dashboard for the first time after they have been added to the system
-
If the local user configuration information was edited and the
Reset passwordoption was enabled through this process:-
Navigate to Admin > Users and Security > Users.
-
Choose the local user and click Actions > Edit local user.
-
Enable the Reset password field and click Save.
-
-
-
Stronger password checks such as these are now implemented:
-
The ID and password cannot be the same.
-
The password must include a combination of lower case letters, upper case letters, numbers, and special characters. However, the same character cannot be used more than 4 times in a row.
-
You can set the number of times that a current password can be reused in the Reuse restriction limit field in the Violation action page (see Configuring Users, Roles, and Security for more information).
-
You cannot use more than four consecutive characters in the English alphabet or the QWERTY keyboard. This check for consecutive characters is applicable for both directions (left to right and right to left) in the English alphabet and the English keyboard.
-
-
You can also make these modifications related to password security for your Nexus Dashboard:
-
Set the minimum password length
-
Enable enforcement of strong password checks
-
Set the number of times that a current password can be reused
-
Set the duration after which a local password expires
For more information, see Configuring Users, Roles, and Security.
-
Home
The Home page displays these tabs.
-
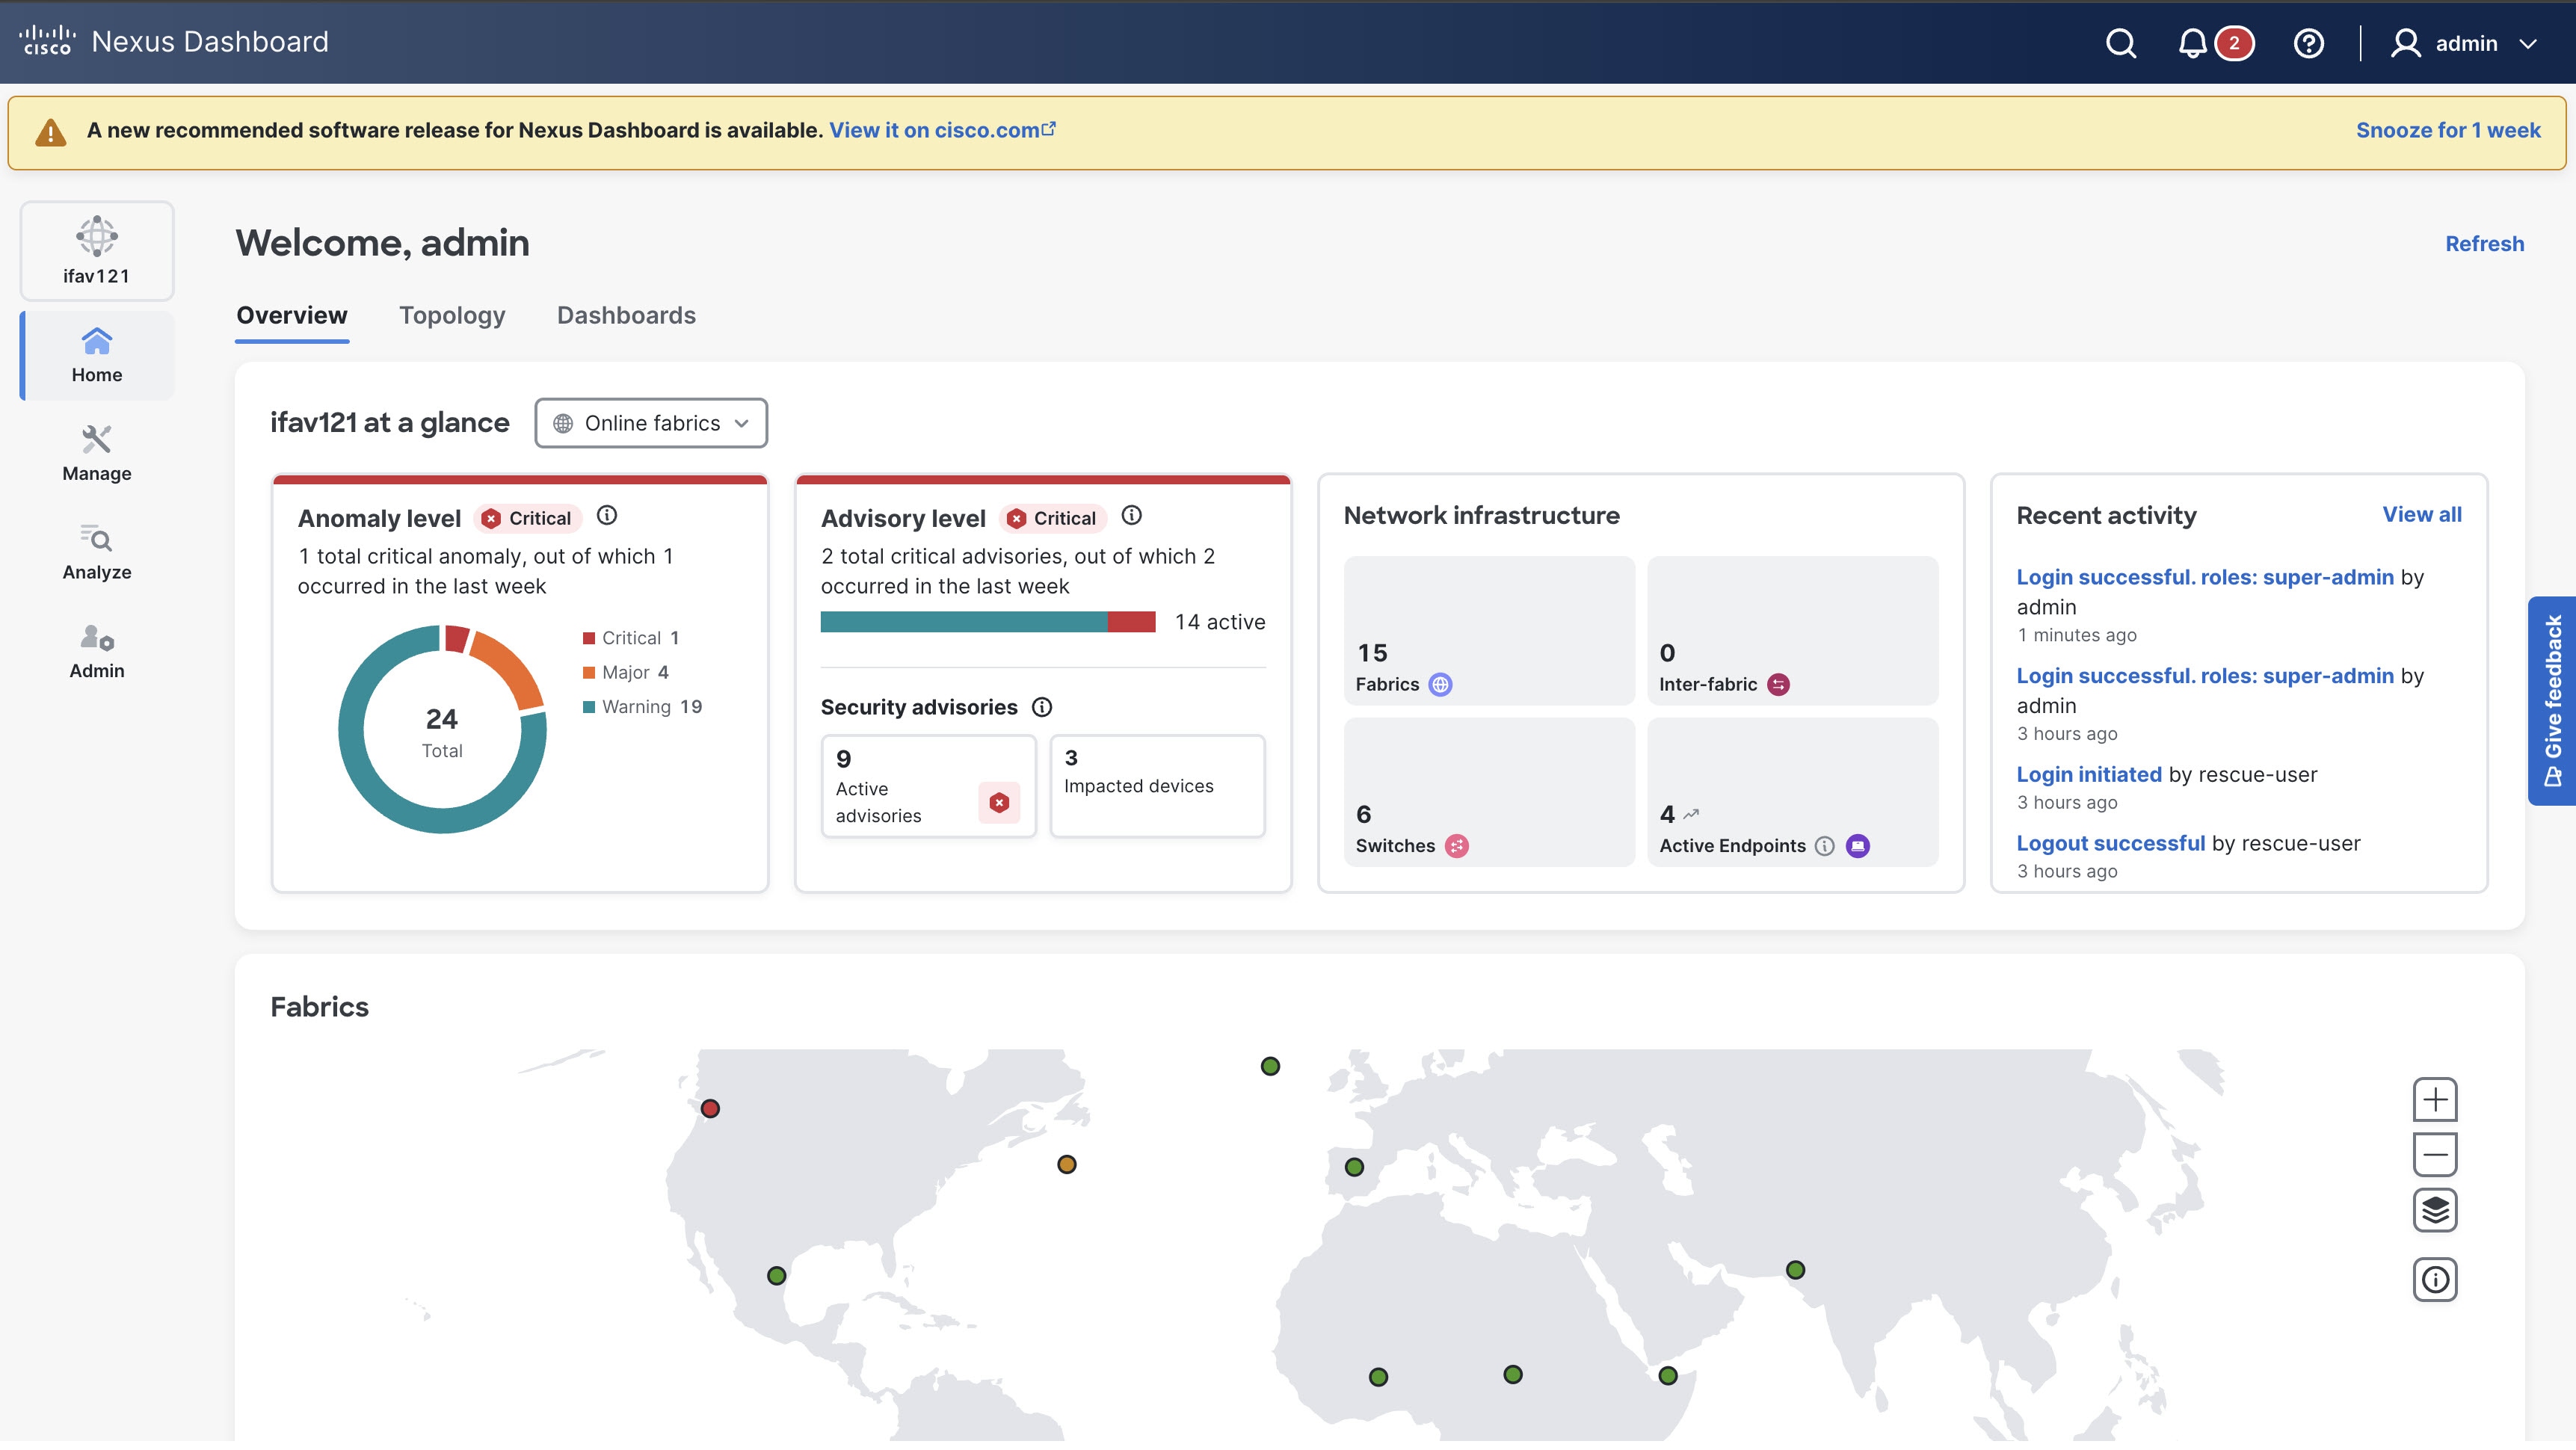
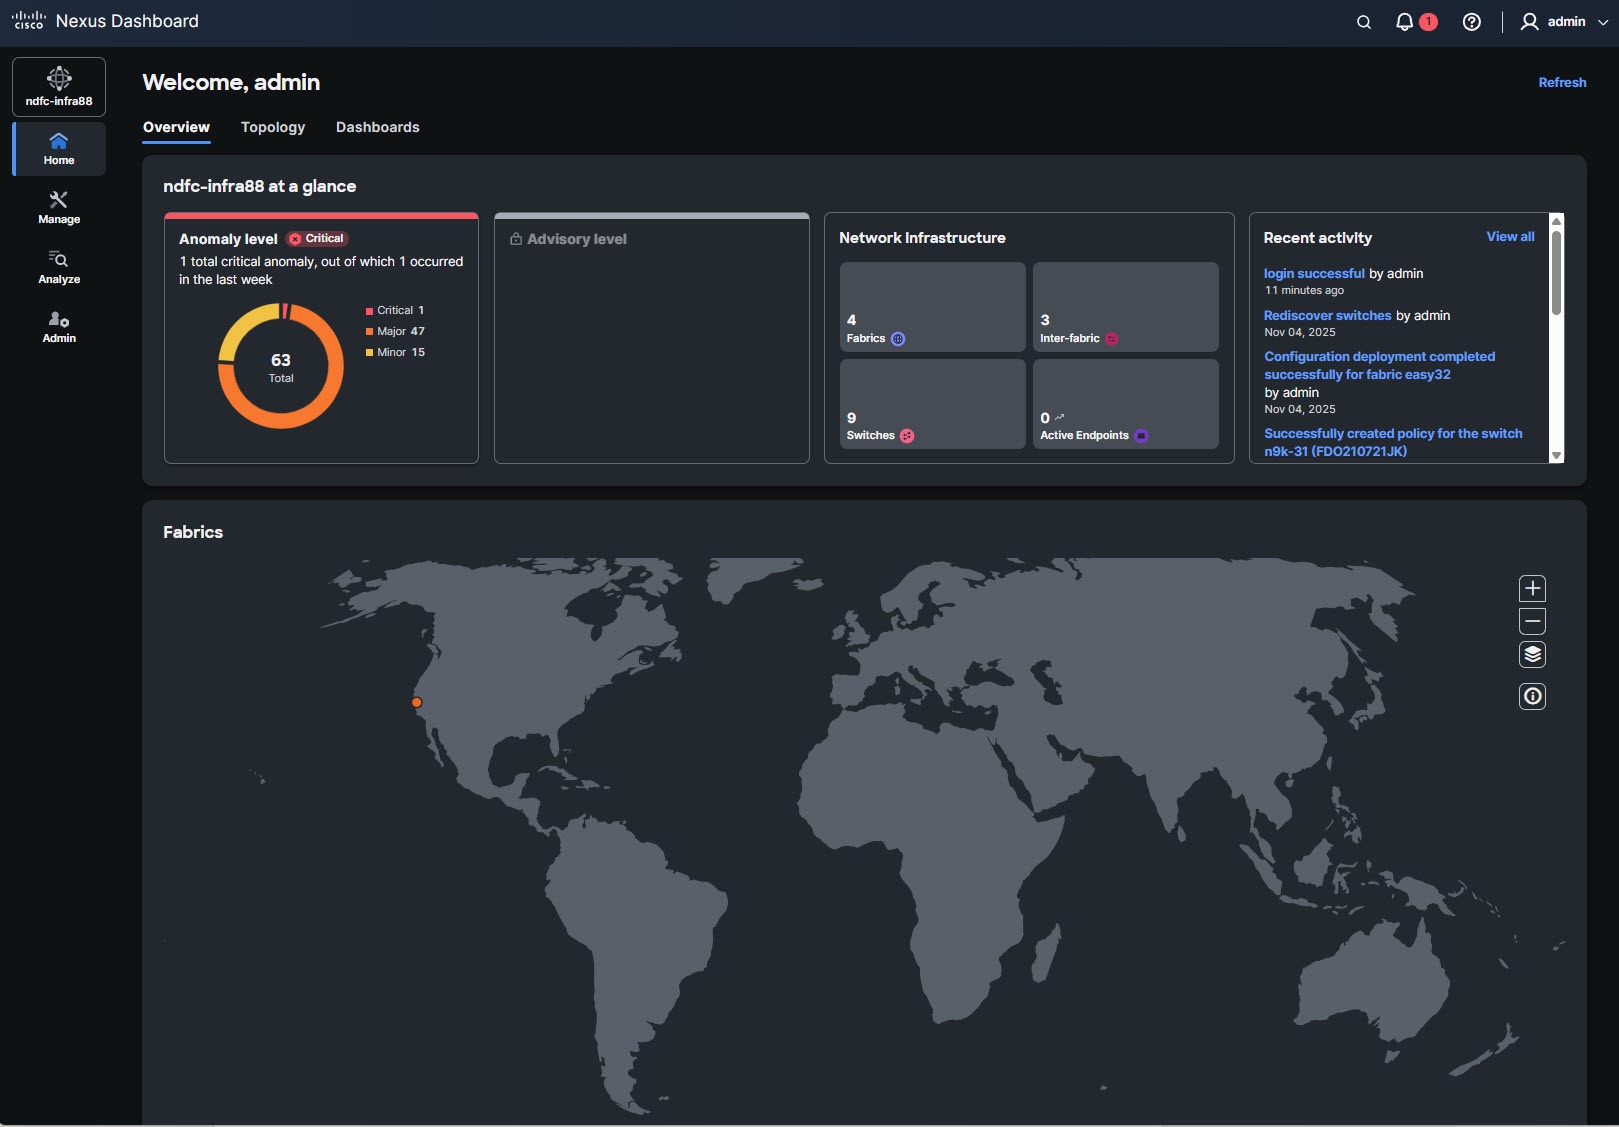
Overview — Provides a comprehensive dashboard view of your Cisco Nexus Dashboard. It offers insights into current functionality and health, including Anomaly level, Advisory level, and Network infrastructure cards. Additionally, a Recent activity card displays a log of system events, such as successful logins, switch rediscoveries, configuration deployments, and policy creations. It also displays a global map of your multi-fabric implementations. You can zoom in or out of the global map using the '+' and '-' icons located on the right side of the map.
-
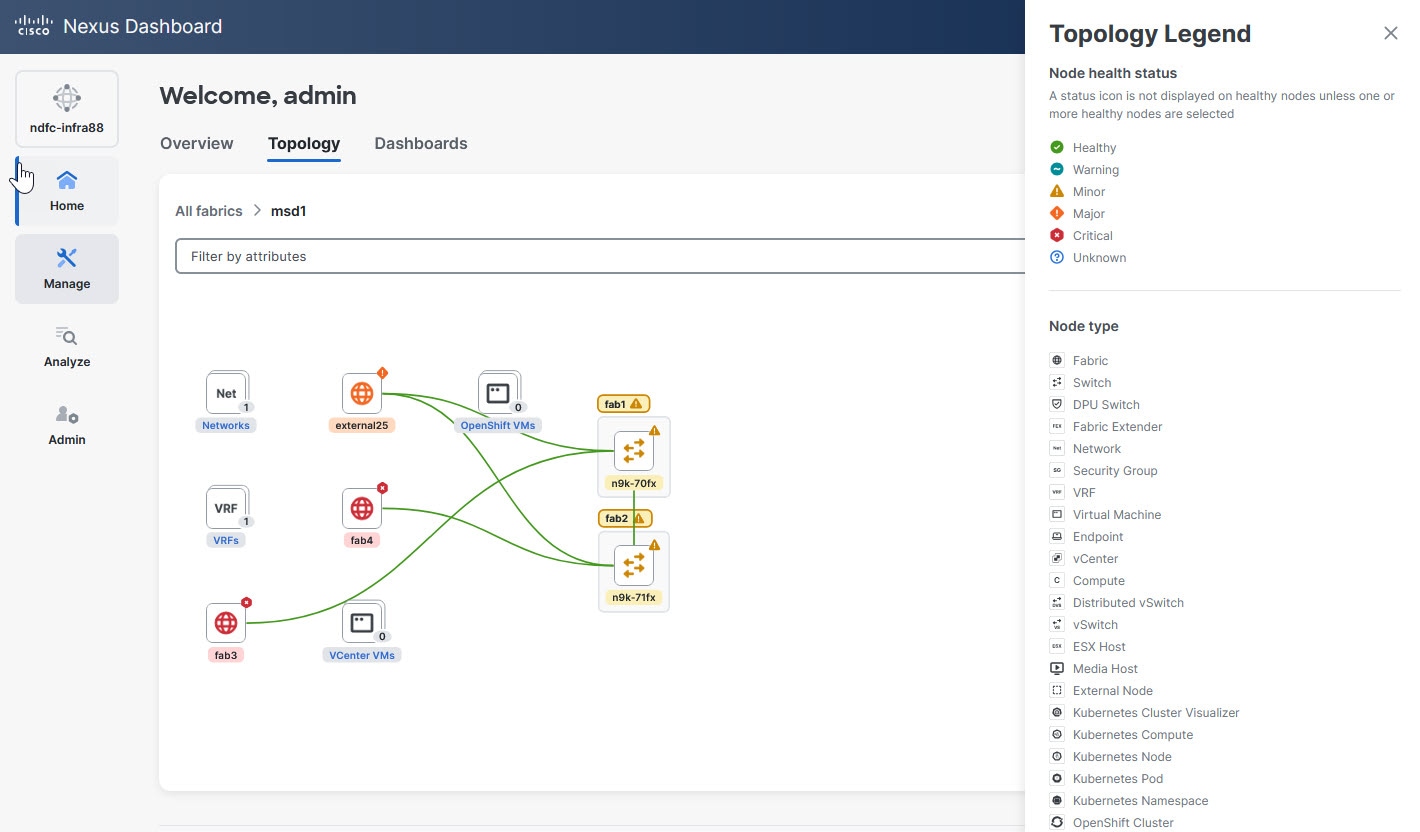
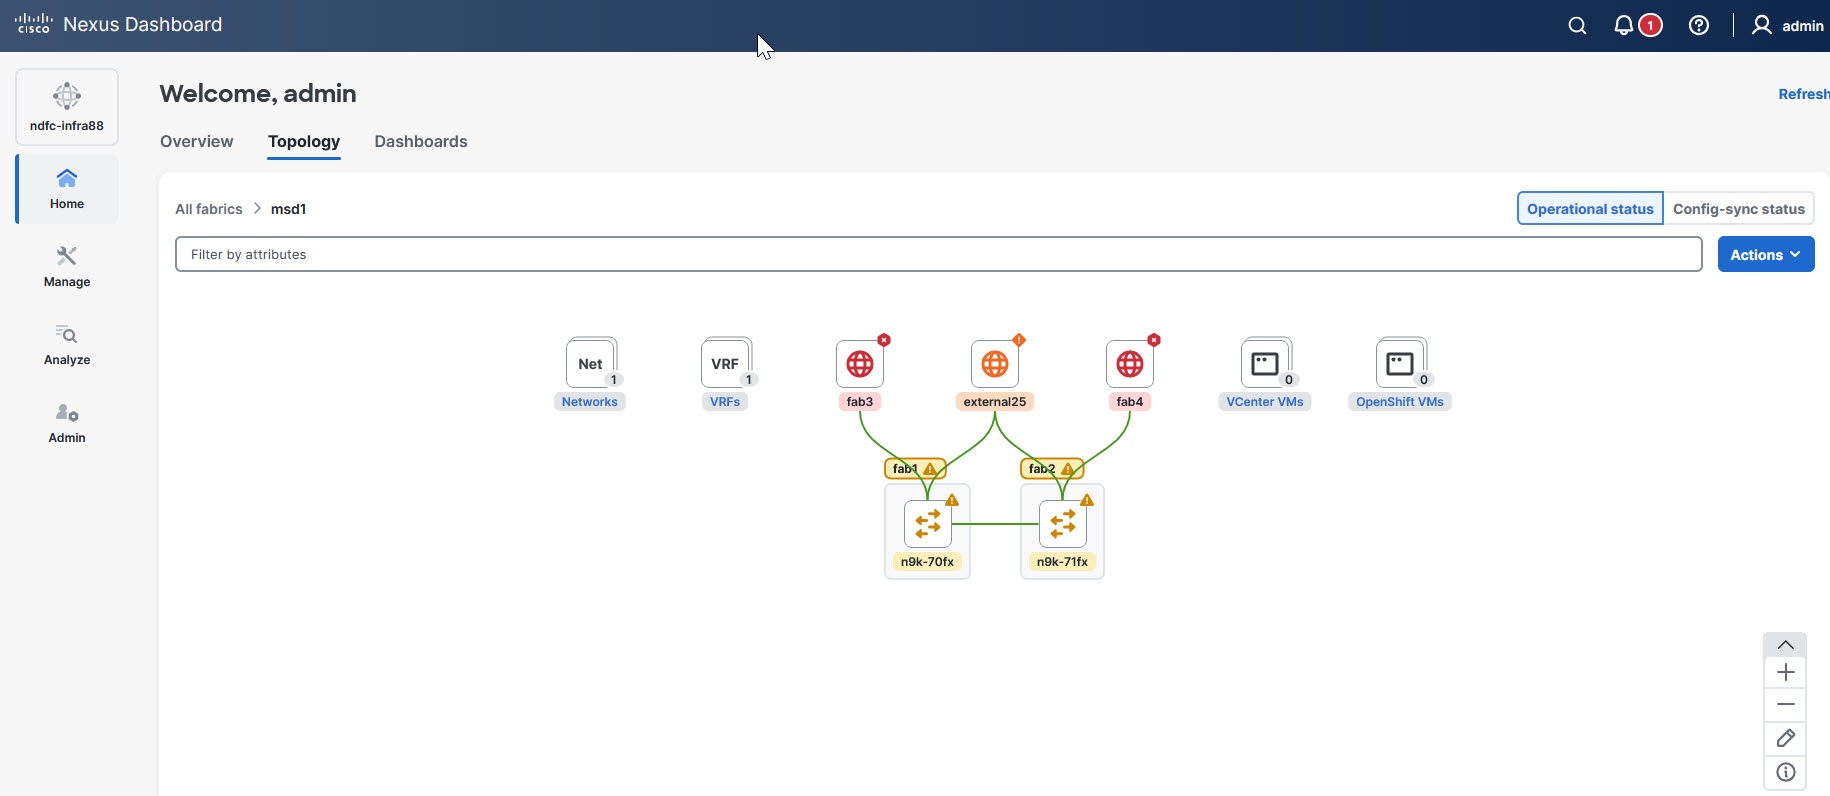
Topology — Provides a graphical and hierarchical view of the Nexus Dashboard infrastructure. It visually represents the relationships and connections in fabrics in Nexus Dashboard and devices in those fabrics, simplifying network visualization and helping administrators understand and manage their fabric more effectively.
Here’s what the Topology view typically shows:
-
Fabric Nodes:
-
Displays switches, routers, and other network devices in the fabric.
-
Identifies device roles, such as spine, leaf, or border gateway.
-
-
Physical Connectivity:
-
Shows links between devices, including Layer 1 (physical) and Layer 2/3 (logical) connections.
-
Highlights redundant or misconfigured links for better troubleshooting.
-
-
Device Information:
-
Provides key details about each device, such as its hostname, role, and IP address.
-
Includes status indicators (e.g., up/down) for devices and links.
-
-
Link Status:
-
Displays link states, bandwidth, and utilization.
-
Marks problematic links (e.g., errors, mismatched configurations) with color-coded indicators.
-
-
Logical Structures:
-
Illustrates logical groupings like vPC (Virtual Port Channel) and VXLAN overlays.
-
Shows how devices participate in the overall fabric, including VRFs, VLANs, and subnets.
-
-
Real-Time Updates:
-
Continuously updates to reflect real-time changes in the network, such as devices going offline or new links being added.
In Nexus Dashboard 4.2.1, Real-time updates are not supported for ACI fabrics.
-
-
Navigation Tools:
-
Offers zooming, panning, and filtering options to focus on specific parts of the topology or certain device roles.
-
-
Troubleshooting and Diagnostics:
-
Integrates with features like flow analysis or fabric health to quickly isolate and resolve issues.
-
For more information, see View components in Topology.
-
-
Dashboards — Provides a centralized overview of all the data you wish to monitor. You can create custom dashboards and add widgets to display top-level information about each widget pinned to the dashboard. You can also share dashboards across users, enabling collaboration and accessibility. Additionally, you can also customize the dashboard to display specific data.
For more information, see Create a new dashboard, Add widgets to a dashboard, and Modify the dashboard.
Manage
This category contains these pages.
-
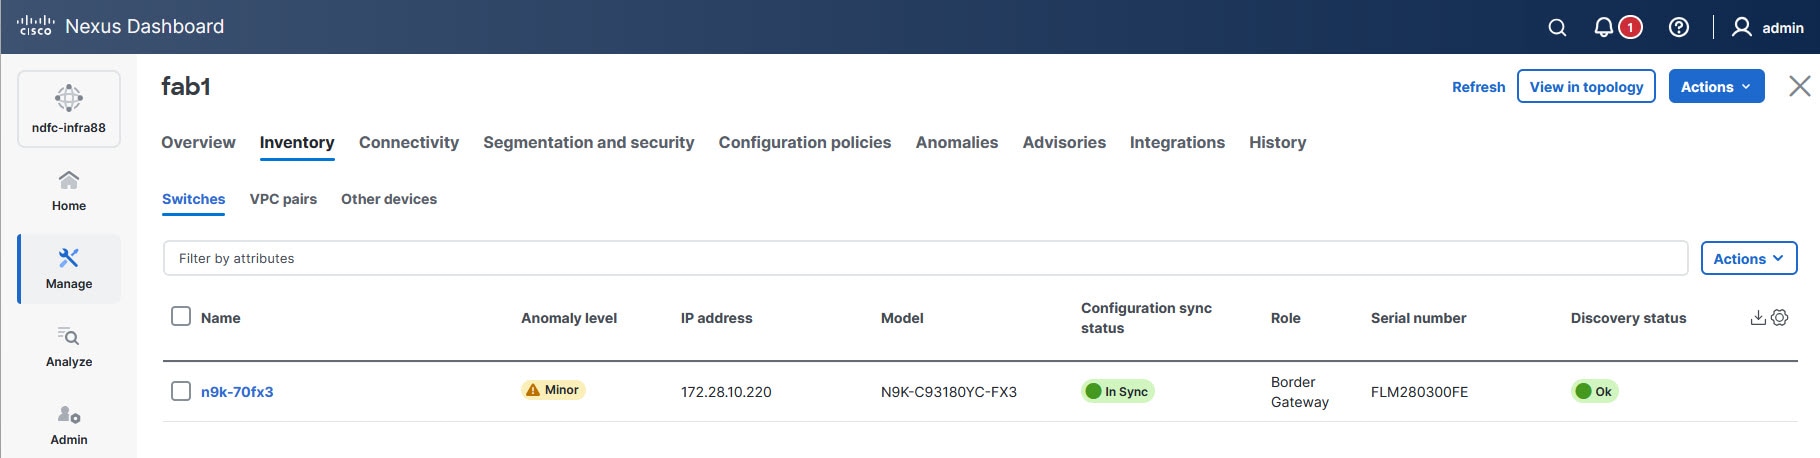
Fabrics — Allows you to create and edit fabrics.
-
Inventory — Allows you to add and edit switches in the cluster.
-
Orchestration — Allows you to connect multiple ACI fabrics together and consolidate and deploy tenants, along with network and policy configurations, across multiple ACI fabrics.
-
Anomaly and Compliance Rules — Allows you to work with global, anomaly, and compliance rules.
-
Change Control — Allows you to use the change control feature to track intent changes using a unique ticket that is associated with a specific action.
-
Fabric Software — Allows you to perform cluster (firmware) upgrades.
-
Device Credentials — Allows you to manage the device credentials in your Nexus Dashboard.
-
Template Library — Allows you to manage the templates that are used in your Nexus Dashboard.
Analyze
This category contains these pages.
-
Anomalies — Provides information on the anomalies that are detected in your Nexus Dashboard.
-
Advisories — Provides information on field notices, software and hardware end-of-life and end-of-sale announcements that are identified in your Nexus Dashboard.
-
Analysis Hub — Allows you to analyze and troubleshoot your network using advanced analytics tools, which allows you to gain valuable insights into the performance and health of your network.
-
Reports — Allows you to create reports for inventory, performance, policy details and more. Reports are only for NX-OS fabrics.
Admin
This category contains these pages.
-
Nexus Dashboard Management:
-
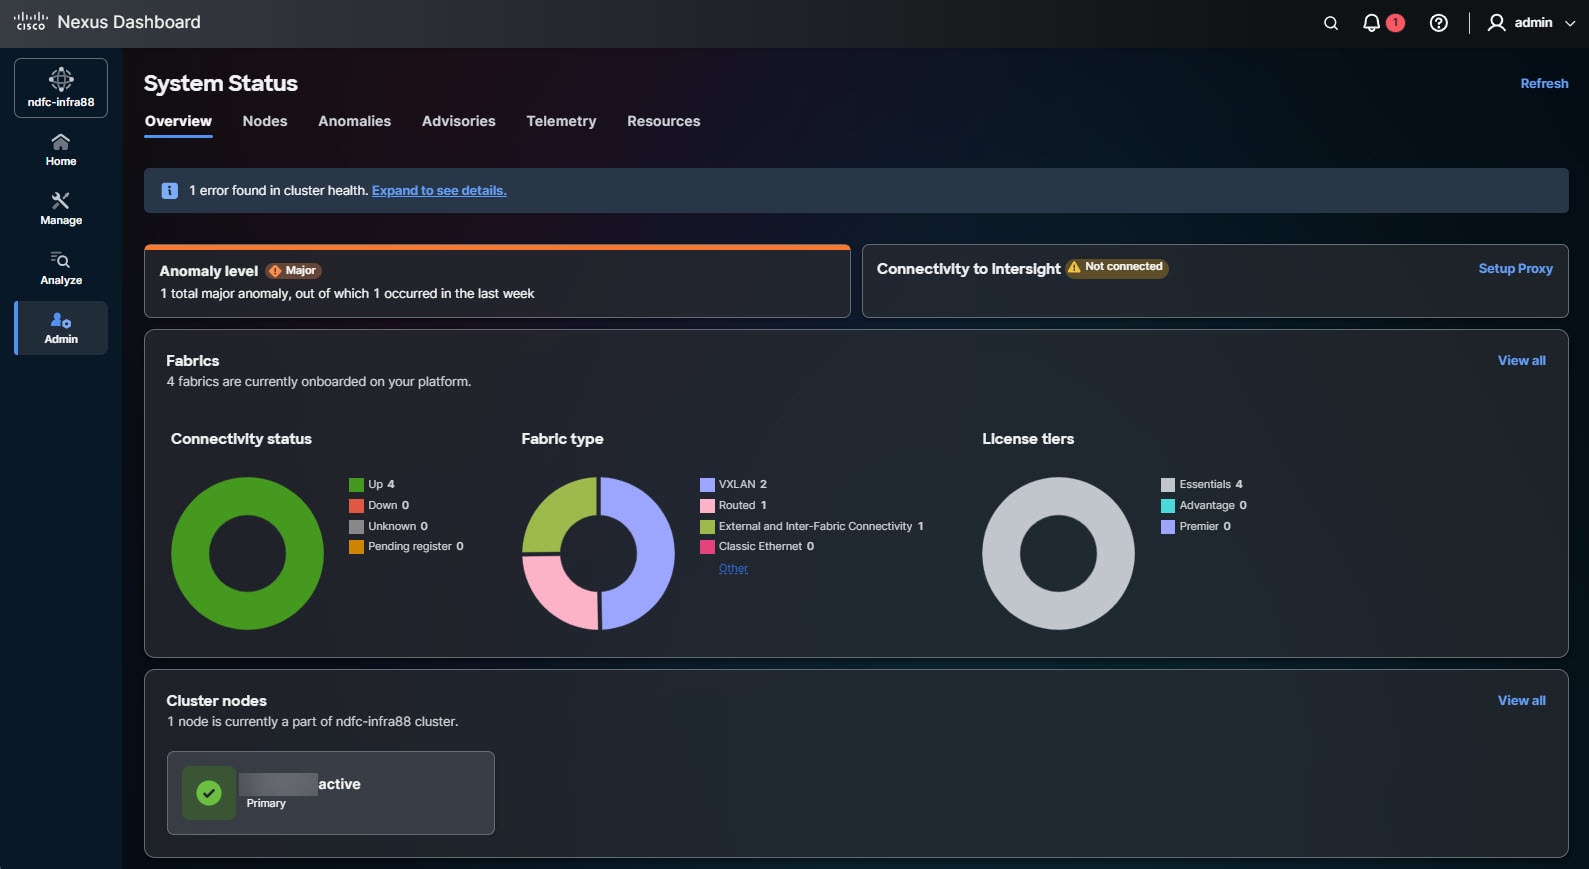
System Status — Provides cluster details (such as name, app subnet, and service subnet) and displays any current issues in the cluster.
-
System Settings — Allows you to configure cluster-wide settings (such as DNS and NTP servers, persistent IP addresses, and routes).
-
Licensing — Allows you configure license management.
-
Integrations — Allows you to add and configure integrations.
-
Intersight — Provides access to Cisco Intersight device connector configuration.
-
-
Maintenance and troubleshooting:
-
System Software — Allows you to manage your system software.
-
Backup and Restore — Allows you to back up or restore cluster configurations.
-
History and Logs — Allows you to review history and log information in your Nexus Dashboard.
-
Tech Support — Allows you to collect logs and activities in the system for further troubleshooting by Cisco TAC.
-
-
Authentication and more:
-
Users and Security — Allows you to create and update local Nexus Dashboard users or view the users configured on any remote authentication servers that you added to the Nexus Dashboard, configure remote authentication domains, and view and edit the security configurations, such as keys and certificates.
-
Certificate Management — Allows you to manage CA, system, and fabric certificates in your Nexus Dashboard.
-
Multi-tenancy — Enables you to create, manage, and isolate multiple tenants within Nexus Dashboard, and assign separate administrative domains, resources, and security policies to each tenant.
-
GUI enhancements
With this release, Nexus Dashboard added these GUI enhancements.
-
Enhanced color theme customization, that allows you to choose from Classic light, Classic dark, or Midnight dark themes.
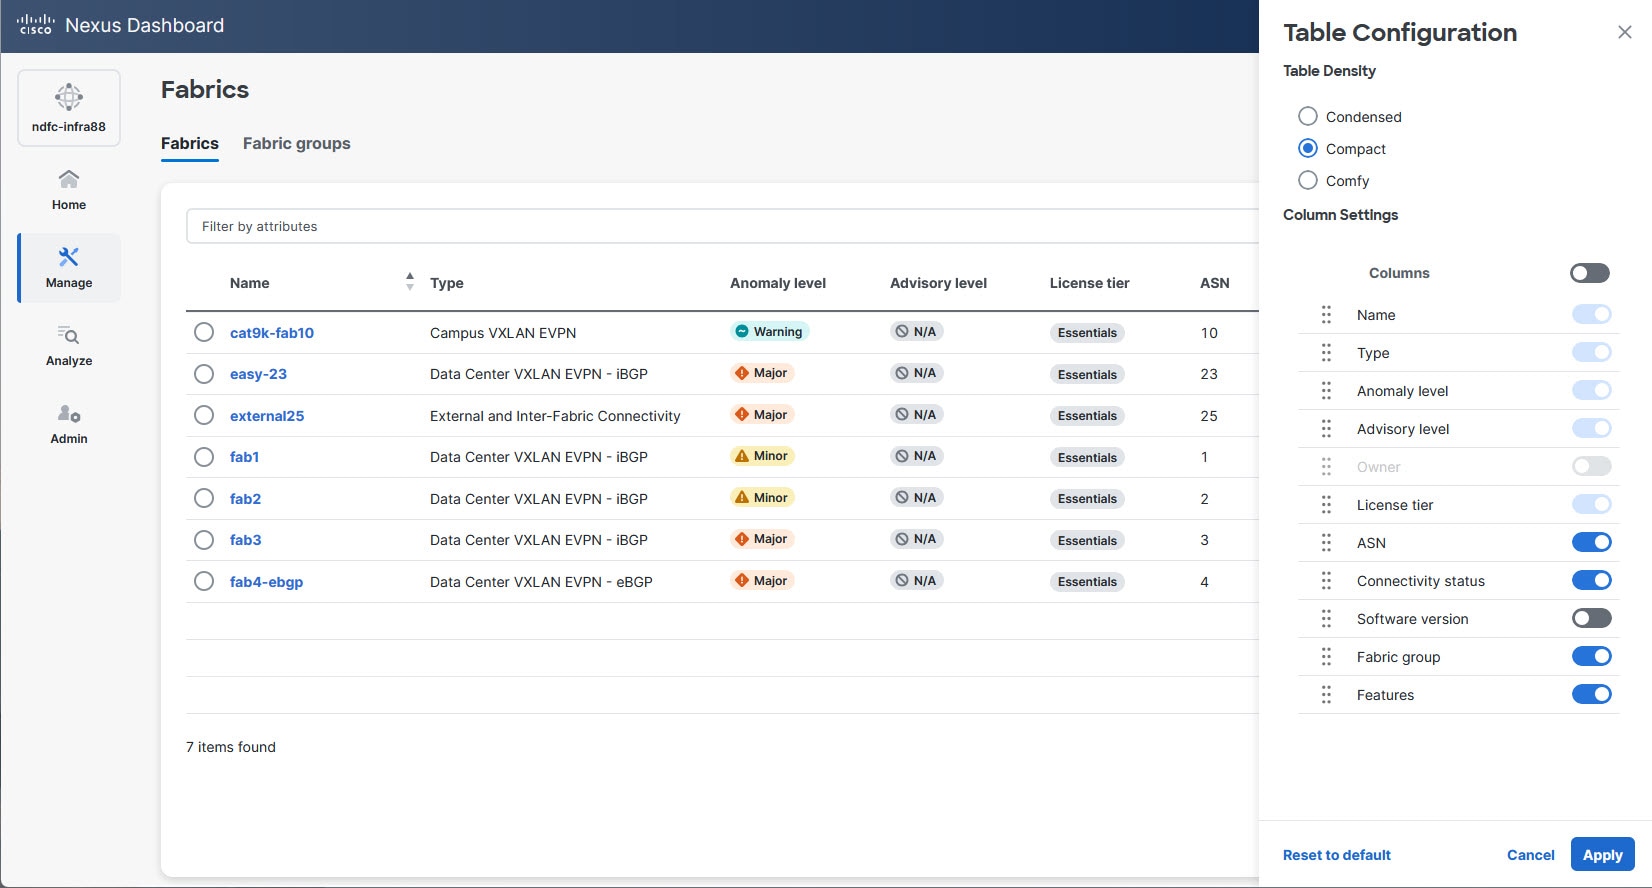
Customize table size and column display
Nexus Dashboard lets you customize the size of tables with the ability to choose toggle options for changing which columns display.
Follow these steps to access the Table Configuration drawer and to customize table settings.
-
Click on the gear icon to access the Table Configuration drawer.
-
Beside each column name, use the toggle on and off options to customize which columns display on a page.
-
Click Reset to default if you want to return to the default table settings.
Download option for generating a .csv file
Nexus Dashboard provides a download option next to the gear icon on tables for downloading the contents of a table to a .csv file.
View components in Topology
To view Nexus Dashboard topology information, navigate to Home > Topology.
The components that are shown and the way you interact with the components in the Topology view differ, depending on the type of fabrics you deployed in Nexus Dashboard.
View LAN fabric components in Topology
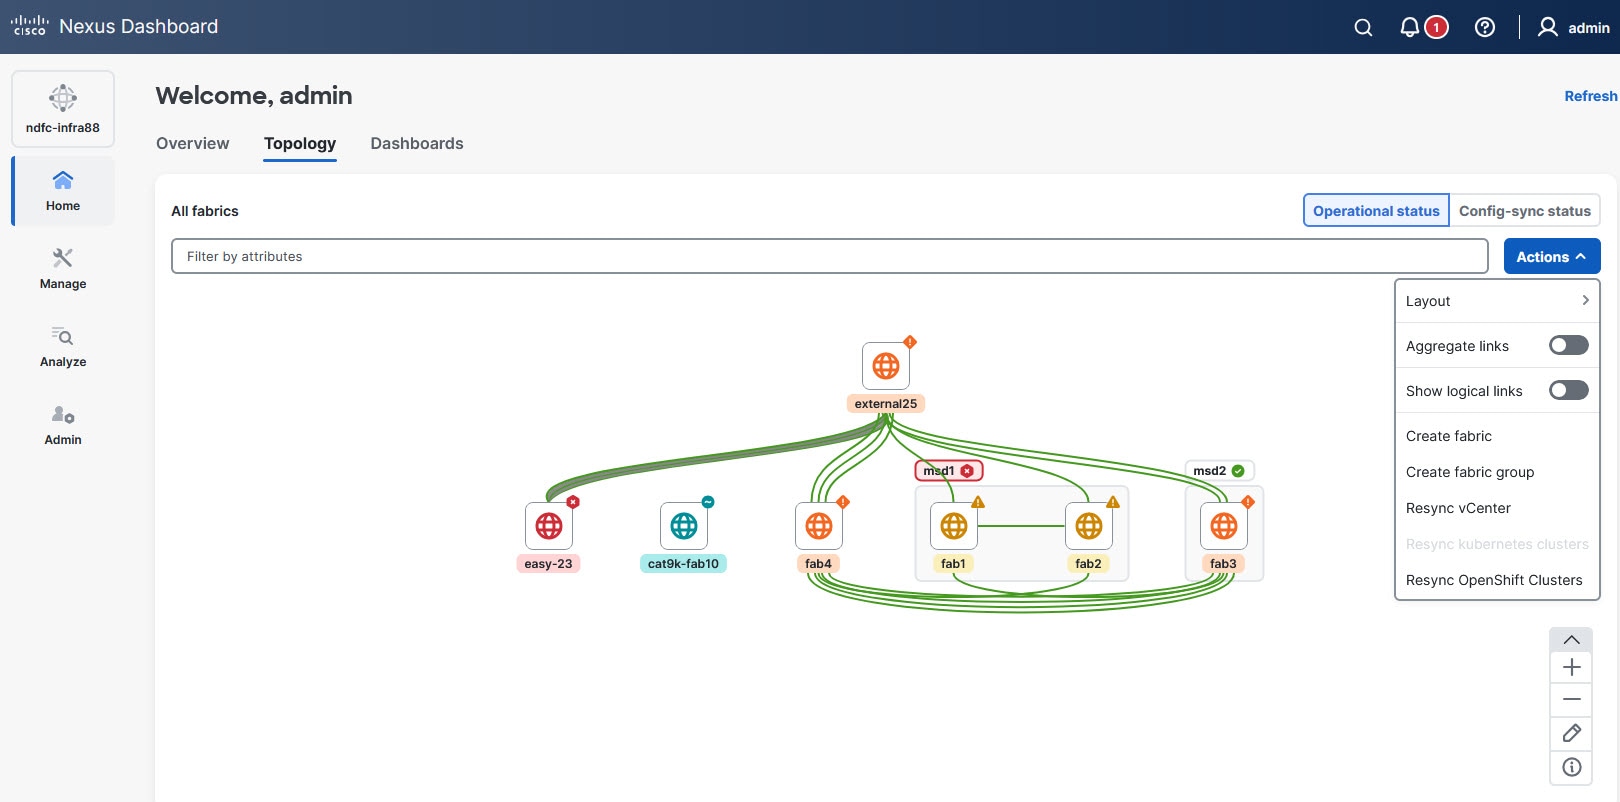
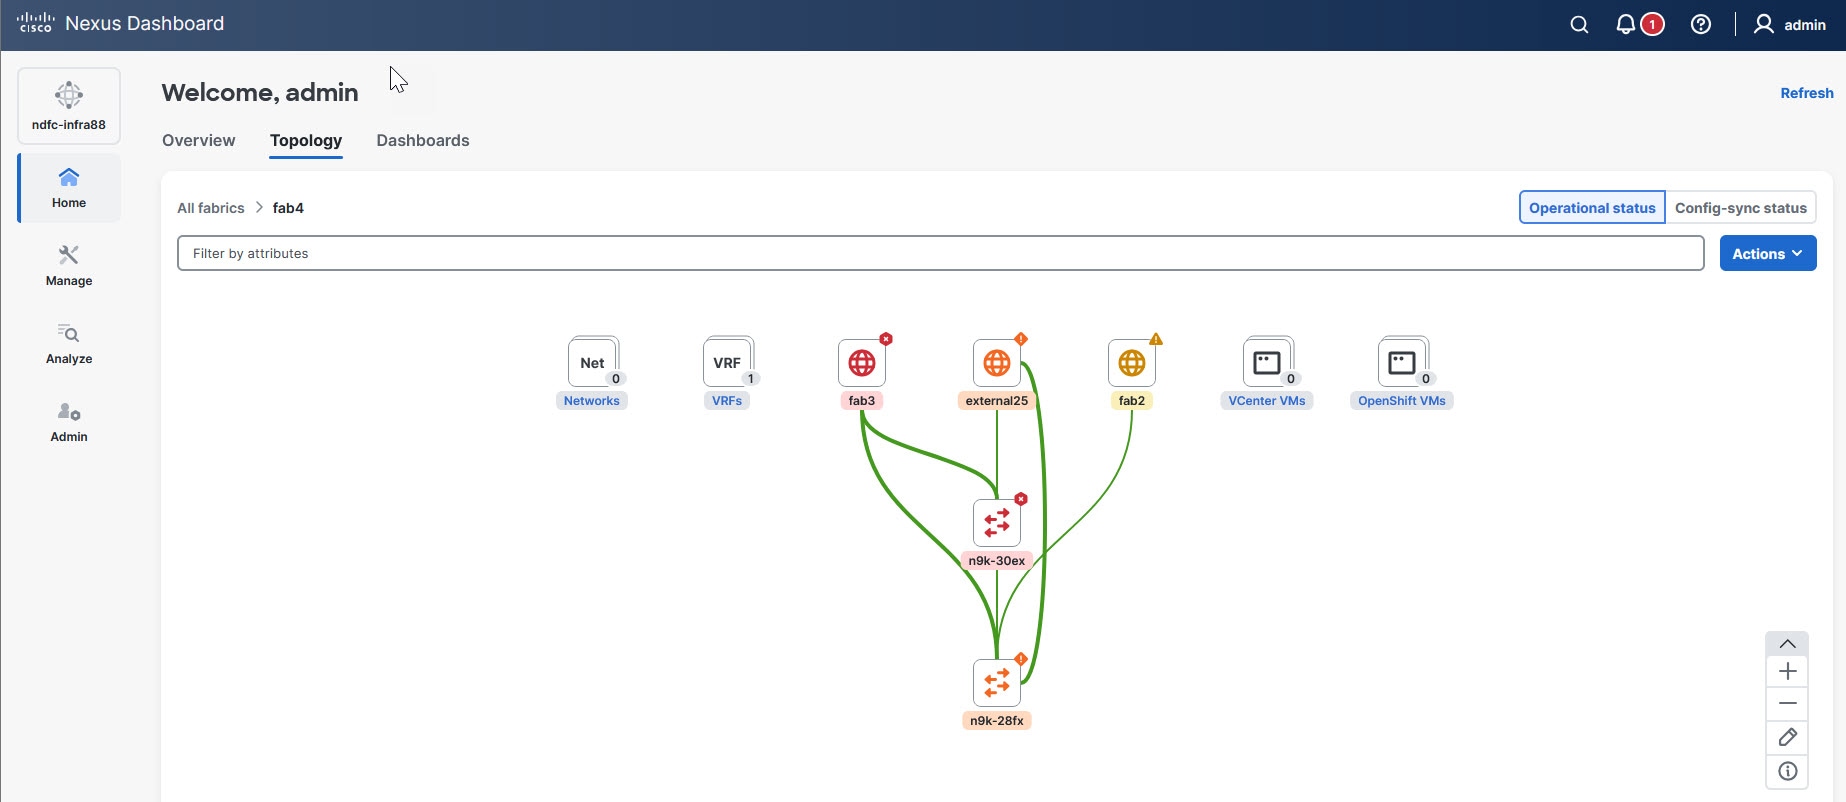
The Topology feature in Nexus Dashboard provides a centralized visualization and management of the entire fabric infrastructure. The Topology tab in Nexus Dashboard displays All fabrics view and allows you to explore and navigate through all the individual fabrics and fabric groups in Nexus Dashboard. It also displays any vCenter and Kubernetes Cluster Visualizers that you have configured in your network.
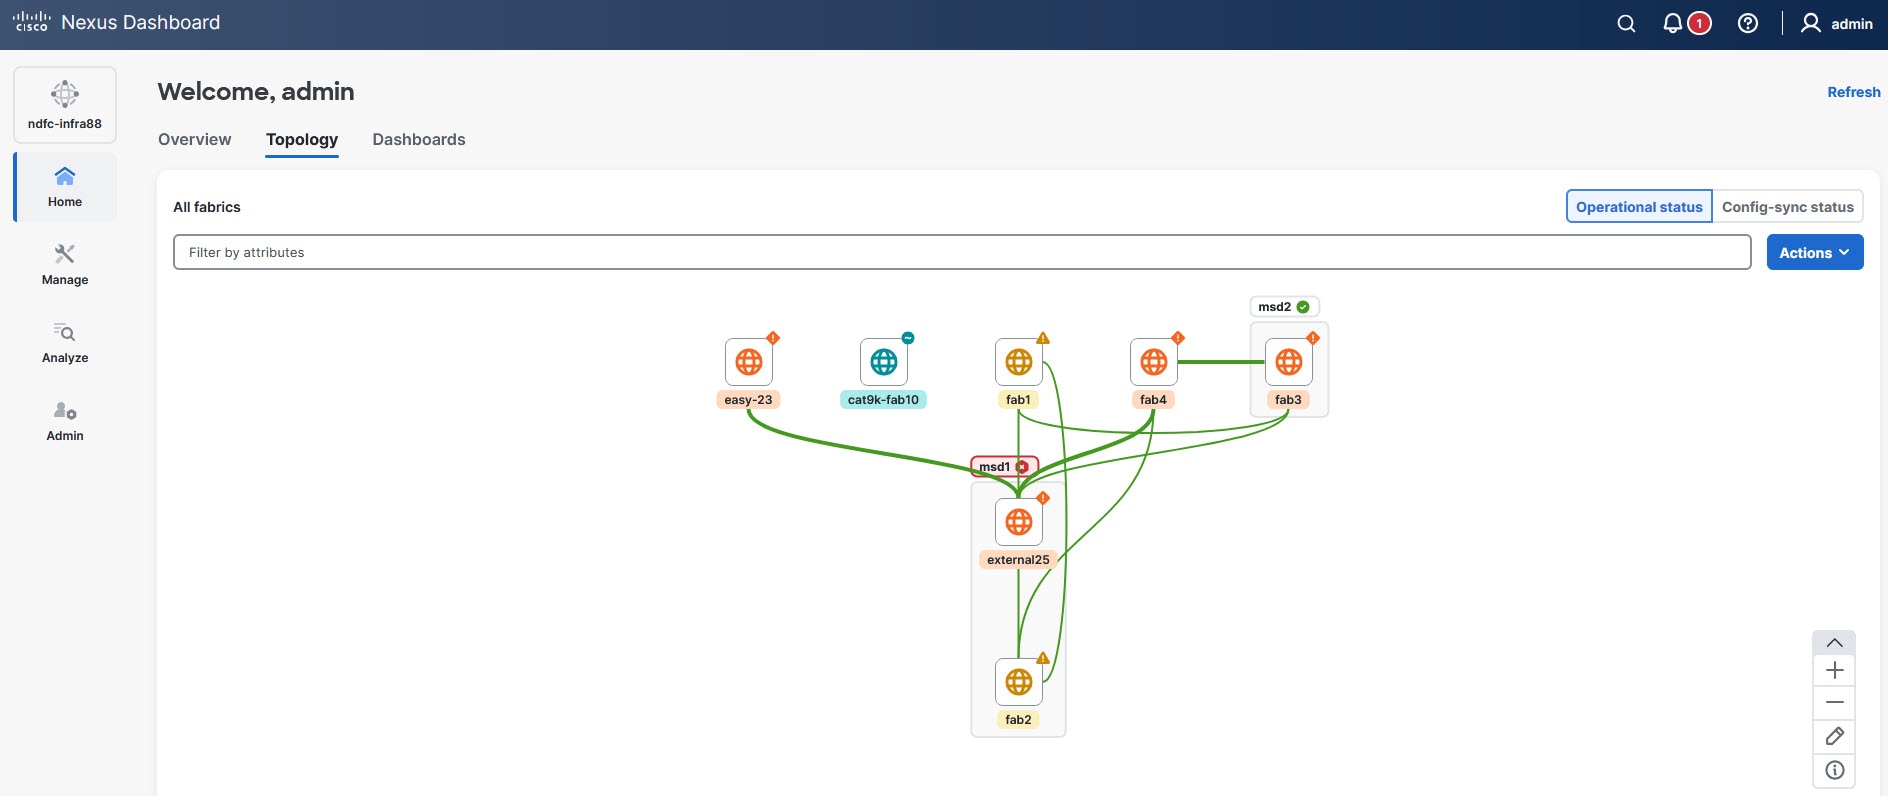
Choose one of these options in the Topology page to gain further insights.
-
Operational status — View the status of your configured network operations
-
Config-sync status — View the status of your current network configurations
Toggling between these two options changes the definitions of the depicted colors. Click the respective fabric icon on the page to access the color legend and to understand the color codes and access additional information.
The navigation controls at the lower-right corner of the Topology page allows you to access the Topology Legend and additional information. Click the (i) icon located in the navigation controls to access the Topology Legend drawer. The zoom controls let you zoom in using + and zoom out using - icons. The Edit icon located in the navigation controls enables you to modify the topology layout. For LAN fabrics, you can also view the Open Snapshots icon in the navigation controls if you enable the Topology snapshots option in the System Settings page. For more information, see View topology snapshots.
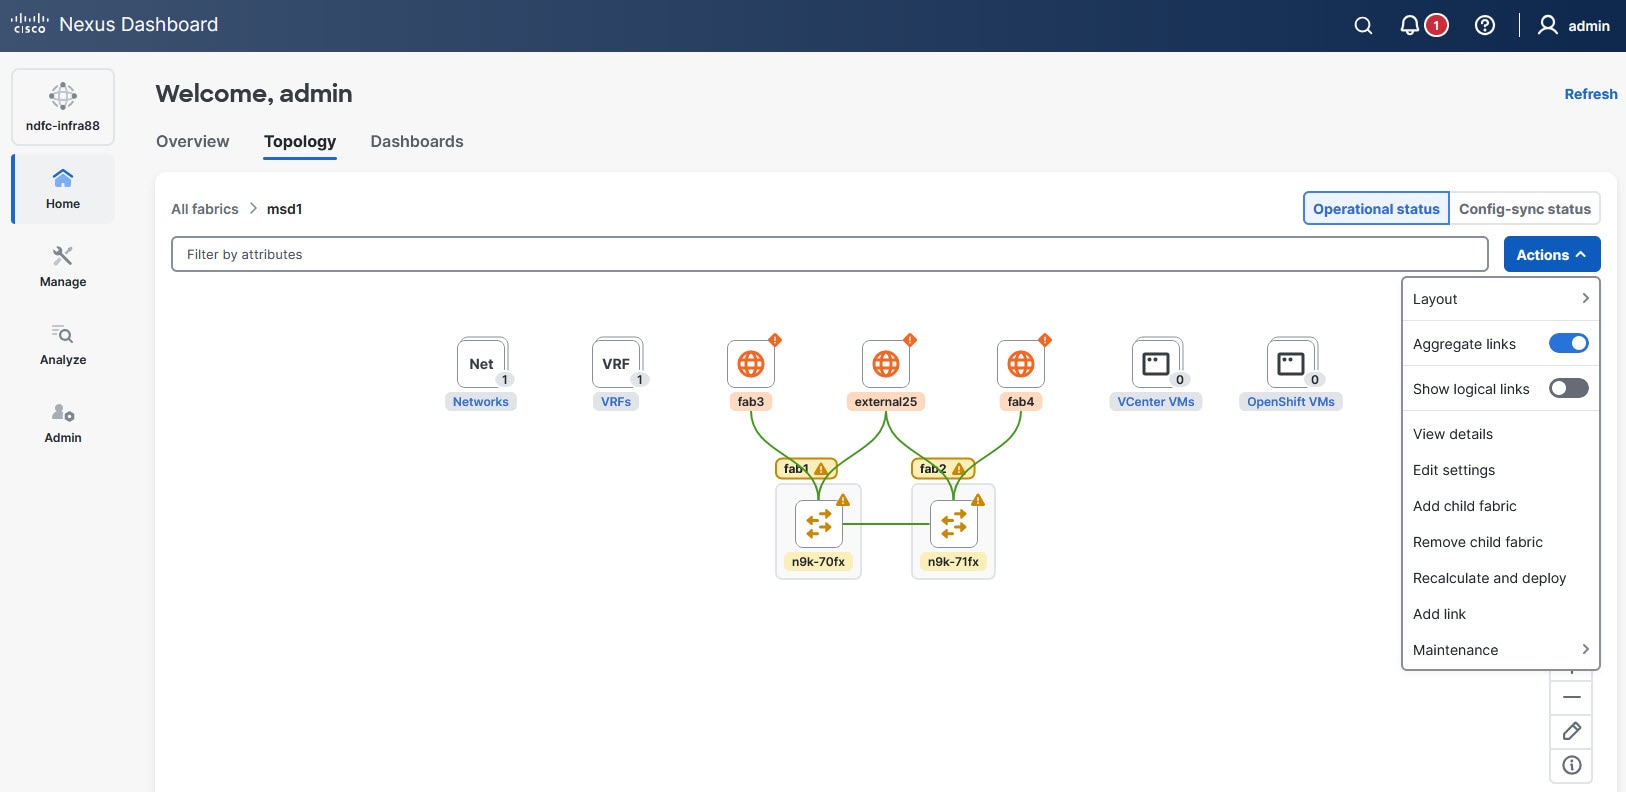
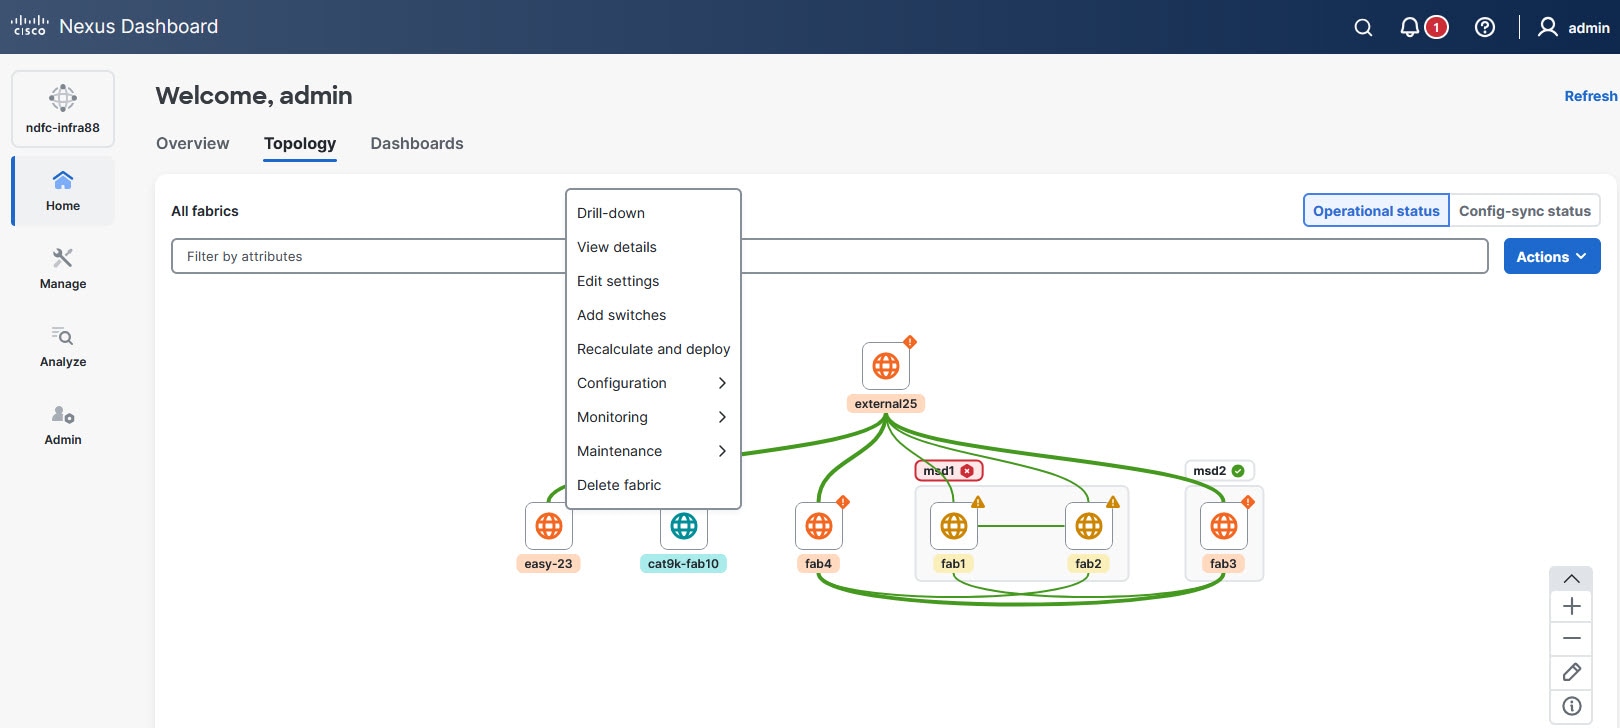
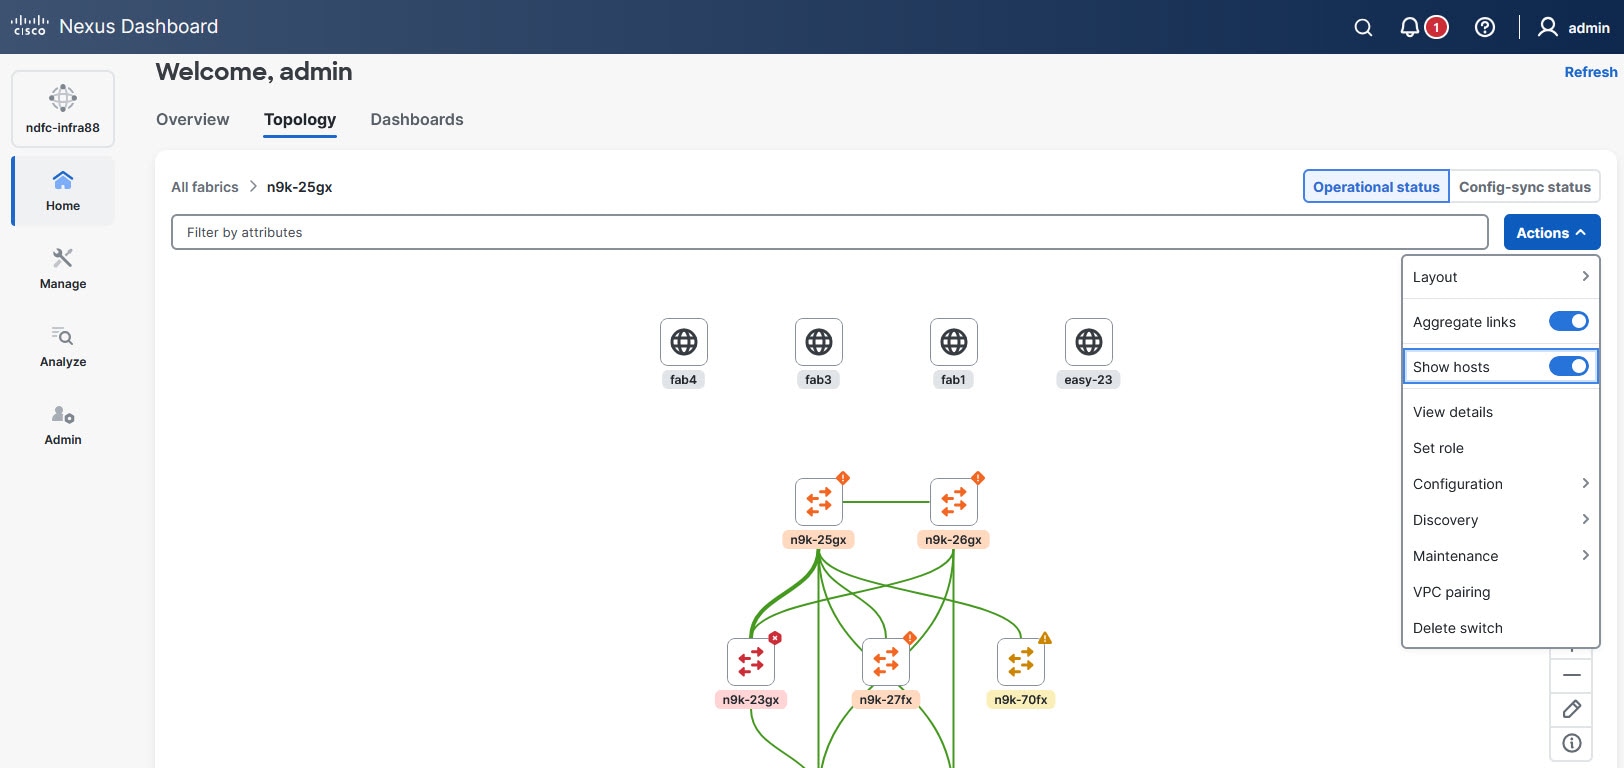
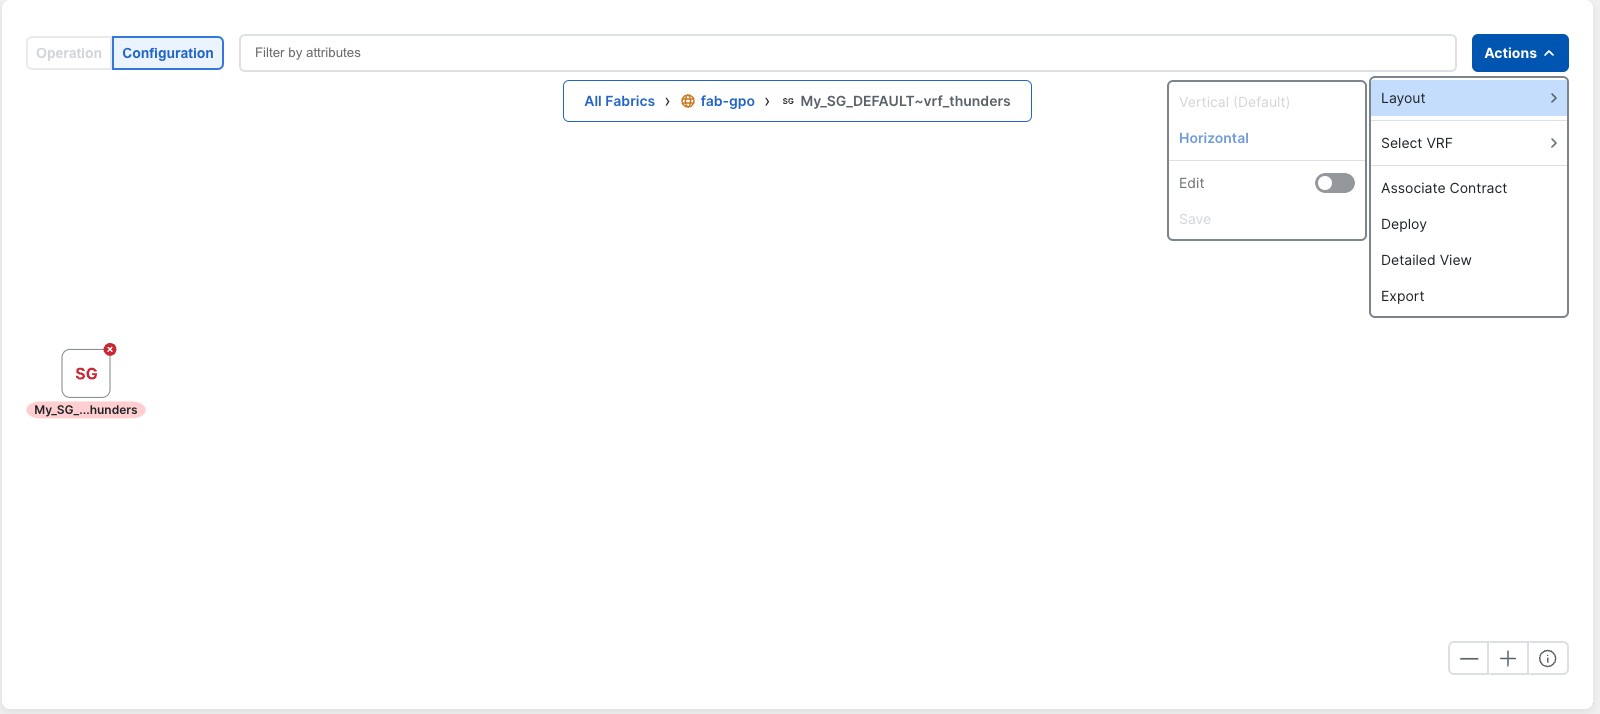
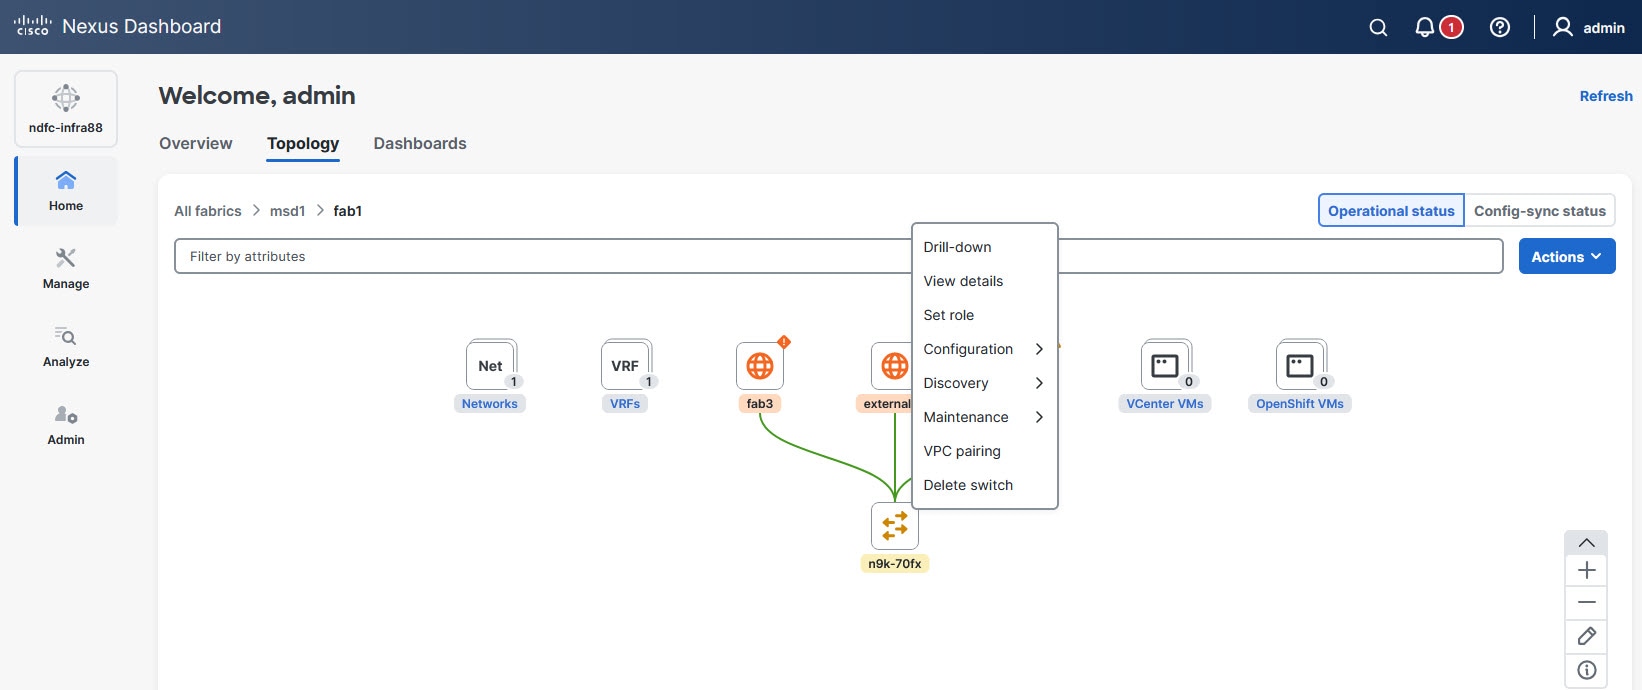
The Actions drop-down list displays contextual options based on the current view. For example, when you are in the All fabrics view, the Actions drop-down list displays options related to that view. Similarly, when you navigate to a single fabric view (such as All fabrics > msd1 > fab1), the Actions drop-down list provides options specific to that single fabric.
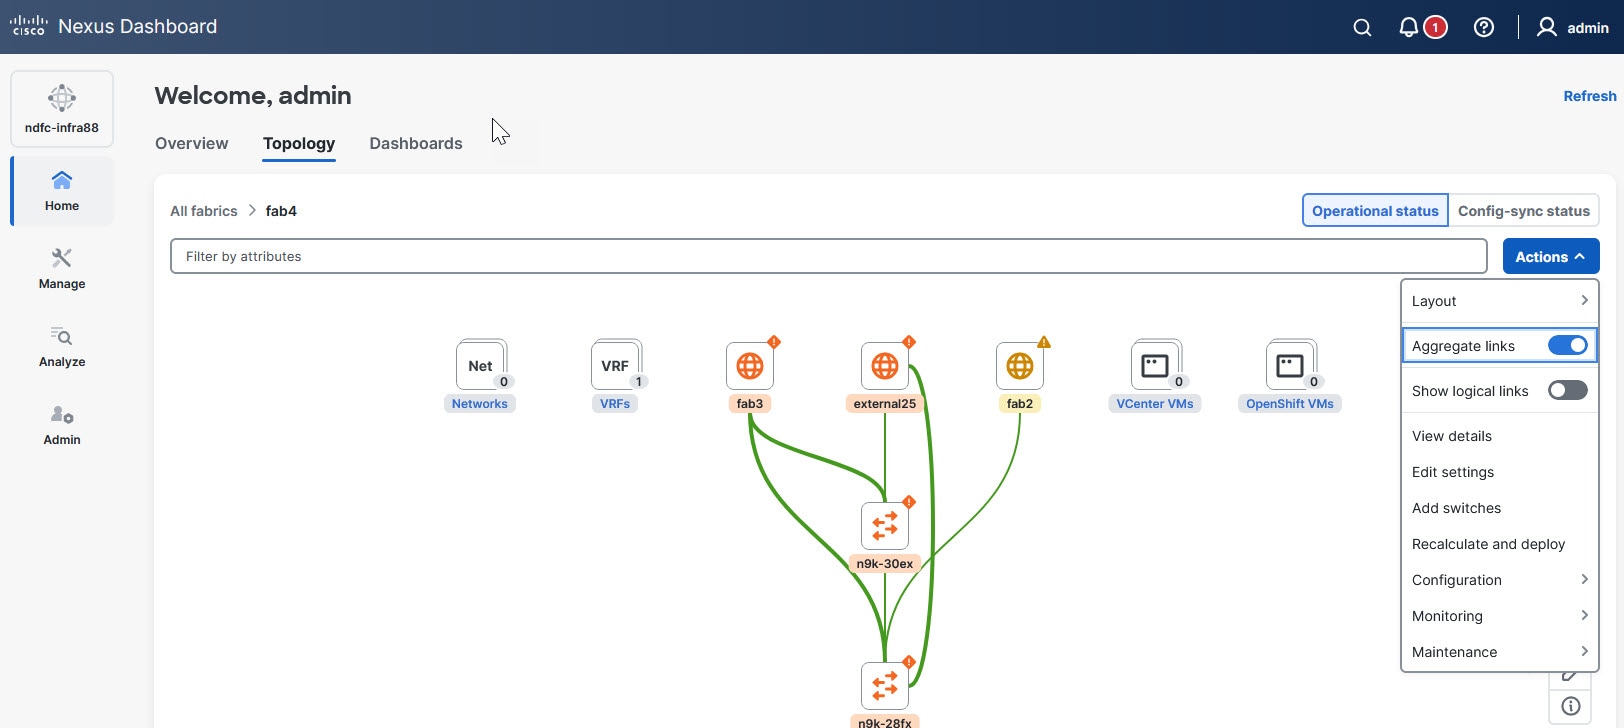
The Actions drop-down list also displays layout options to change the layout, aggregate the depicted links, and other contextual actions specific to the type of node.
The Preview and Deploy options are available only on specific types of nodes, such as switches. The contextual options displayed in the Topology page vary based on the node type that you chose.
These sections provide more information on specific areas on the Topology page.
Layout selection
You can choose two types of predefined layouts by navigating to Actions > Layout.
-
Vertical (default)
-
Horizontal
These figures show examples of both types of layouts.
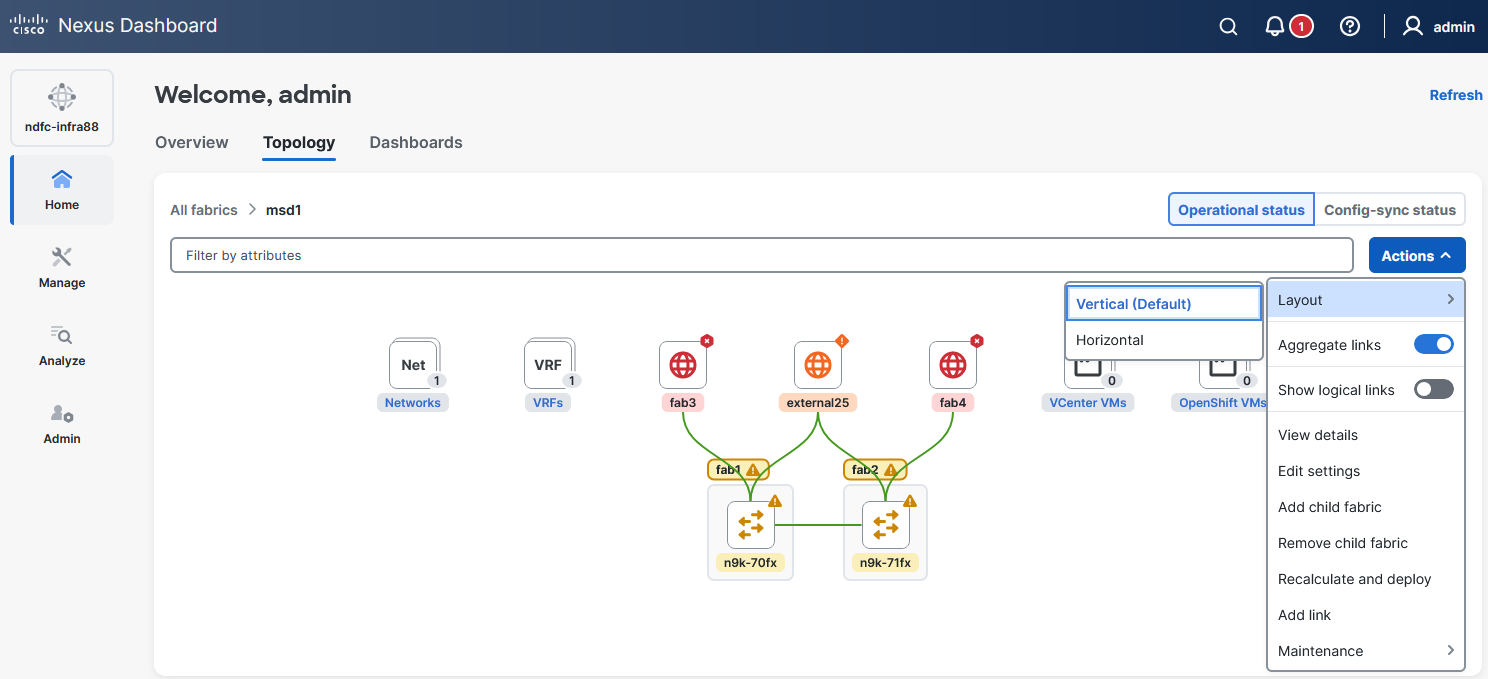
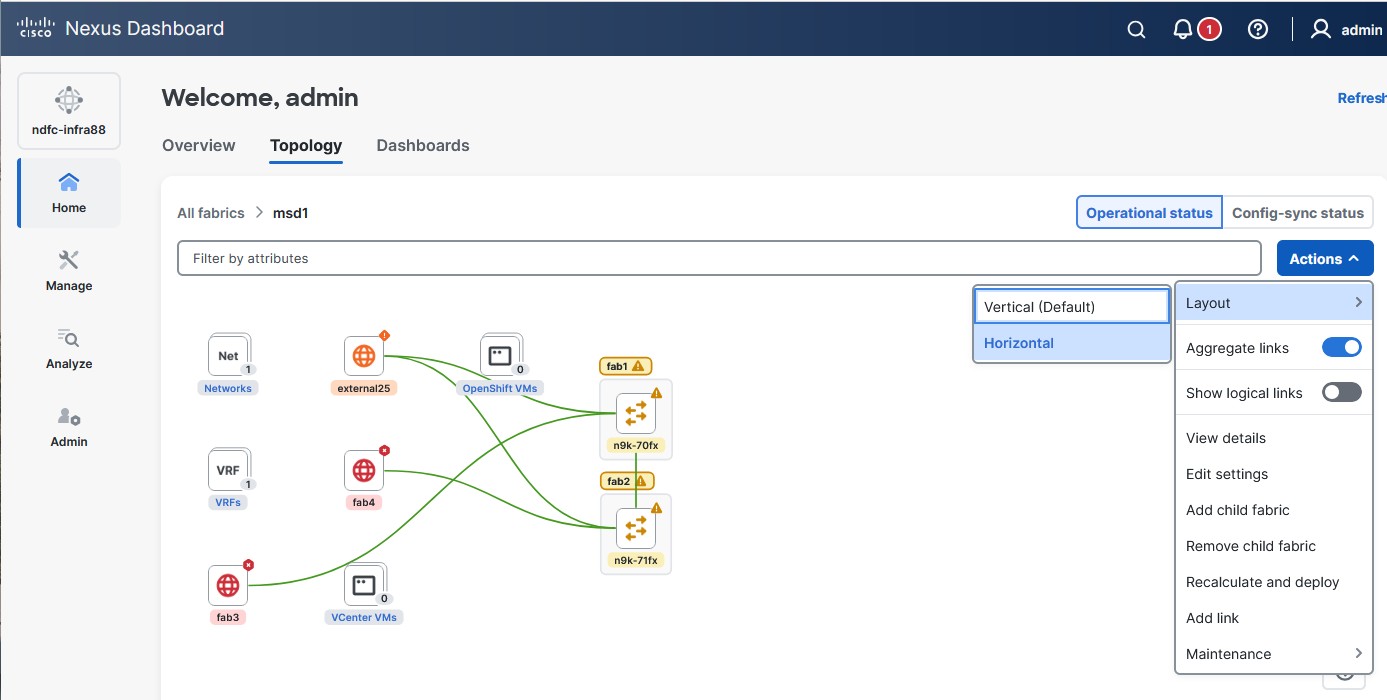
The vertical layout allows scrolling only along the vertical axis, while the horizontal layout allows scrolling along the horizontal axis. Depending on the layout you choose, the other axis remains constant according to your page size. When you zoom in or out, certain elements may shift to ensure all the elements are visible within the selected layout.
If neither of the layout provides the desired view, click the Edit icon in the navigation controls at the lower-right corner of the Topology page to switch to freeform edit mode. In Edit mode, you can move the elements around the page until you achieve the desired arrangement, then click the Save Layout icon to save your layout. Nexus Dashboard automatically displays this saved layout each time you return to this view.
Follow these guidelines when you are in freeform edit mode.
-
You can save only one freeform layout edit at a time; clicking Edit icon, moving elements around, and clicking Save Layout icon again overwrites the previously saved freeform layout.
-
Tooltips are disabled when you are in freeform edit mode. To re-enable tooltips, click the Save Layout icon.
After you save a freeform layout, the Custom option appears and is selected by default under Actions > Layout. The Delete Custom Layout option also appears, that allows you to delete your freeform layout when you no longer wish to use it.
Topology legend
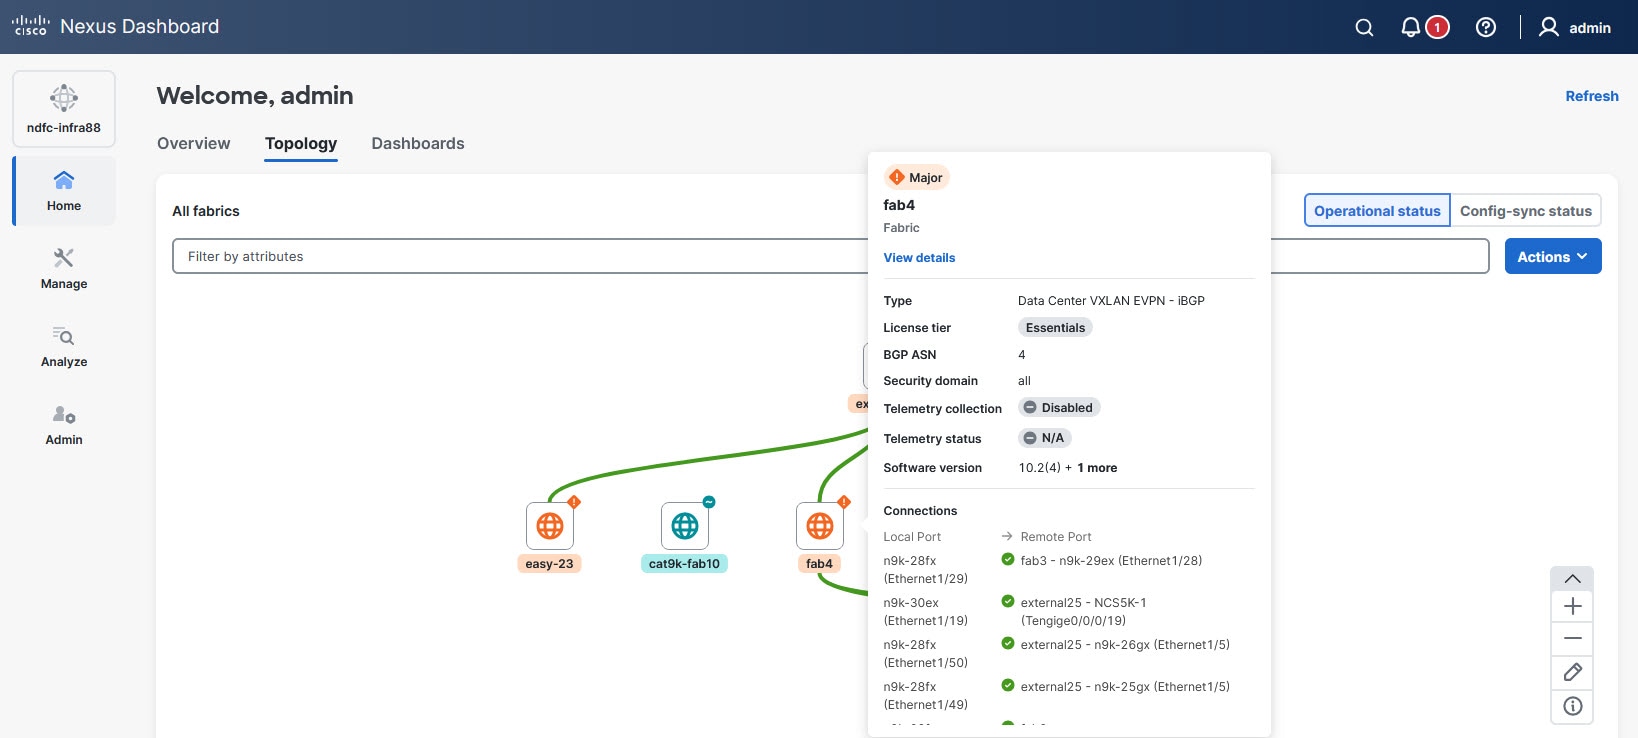
Click the Info icon in the navigation controls at the lower-right corner of the Topology page to access the Topology Legend drawer. Refer the legends under Node health status and Node type to understand the icons associated with the elements displayed in the Topology page.
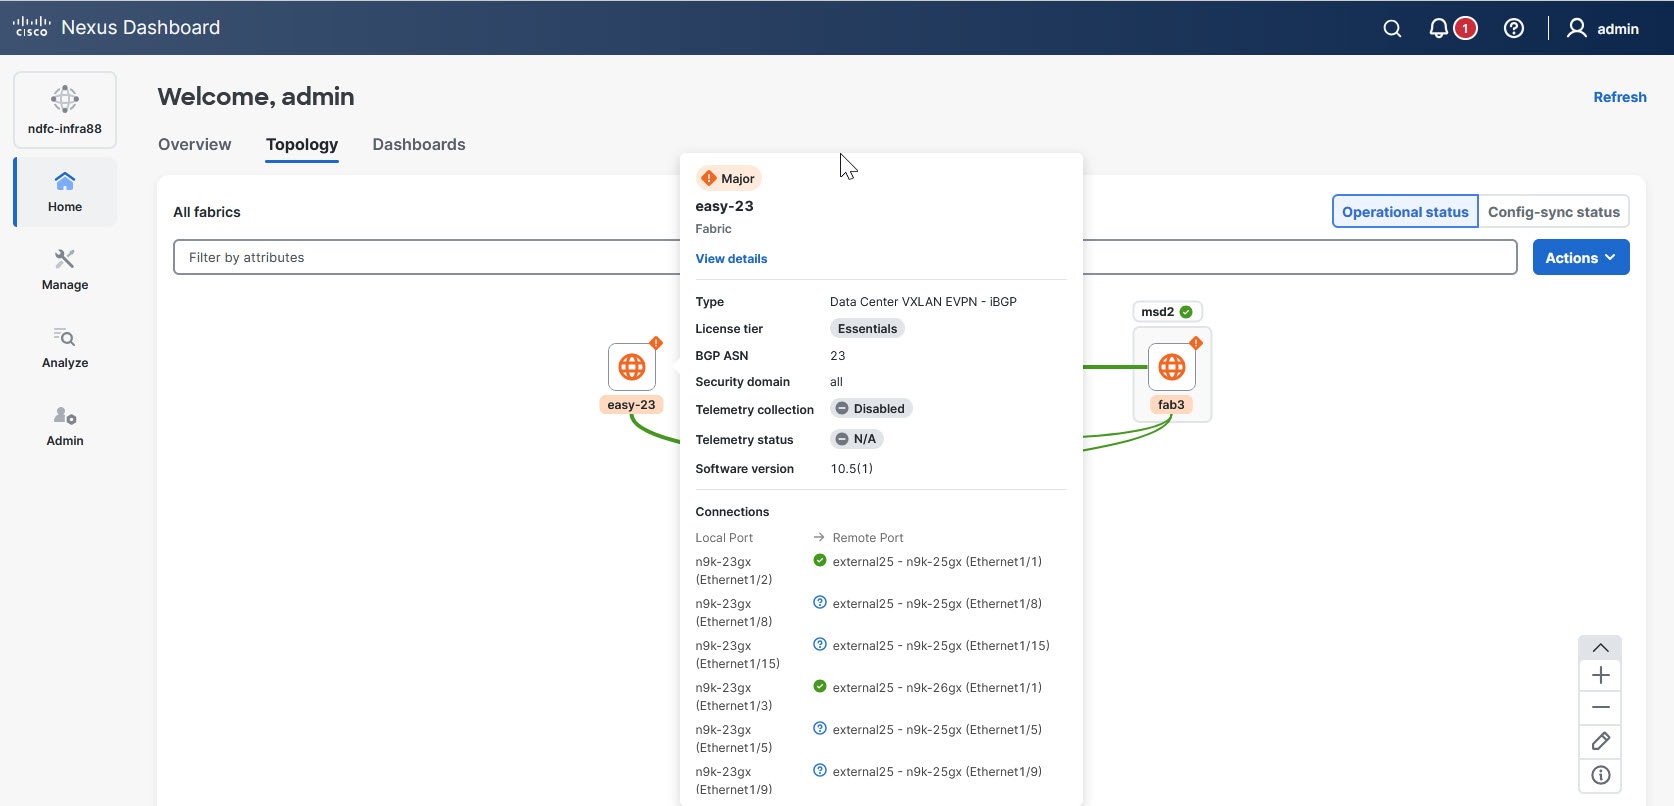
Tooltips
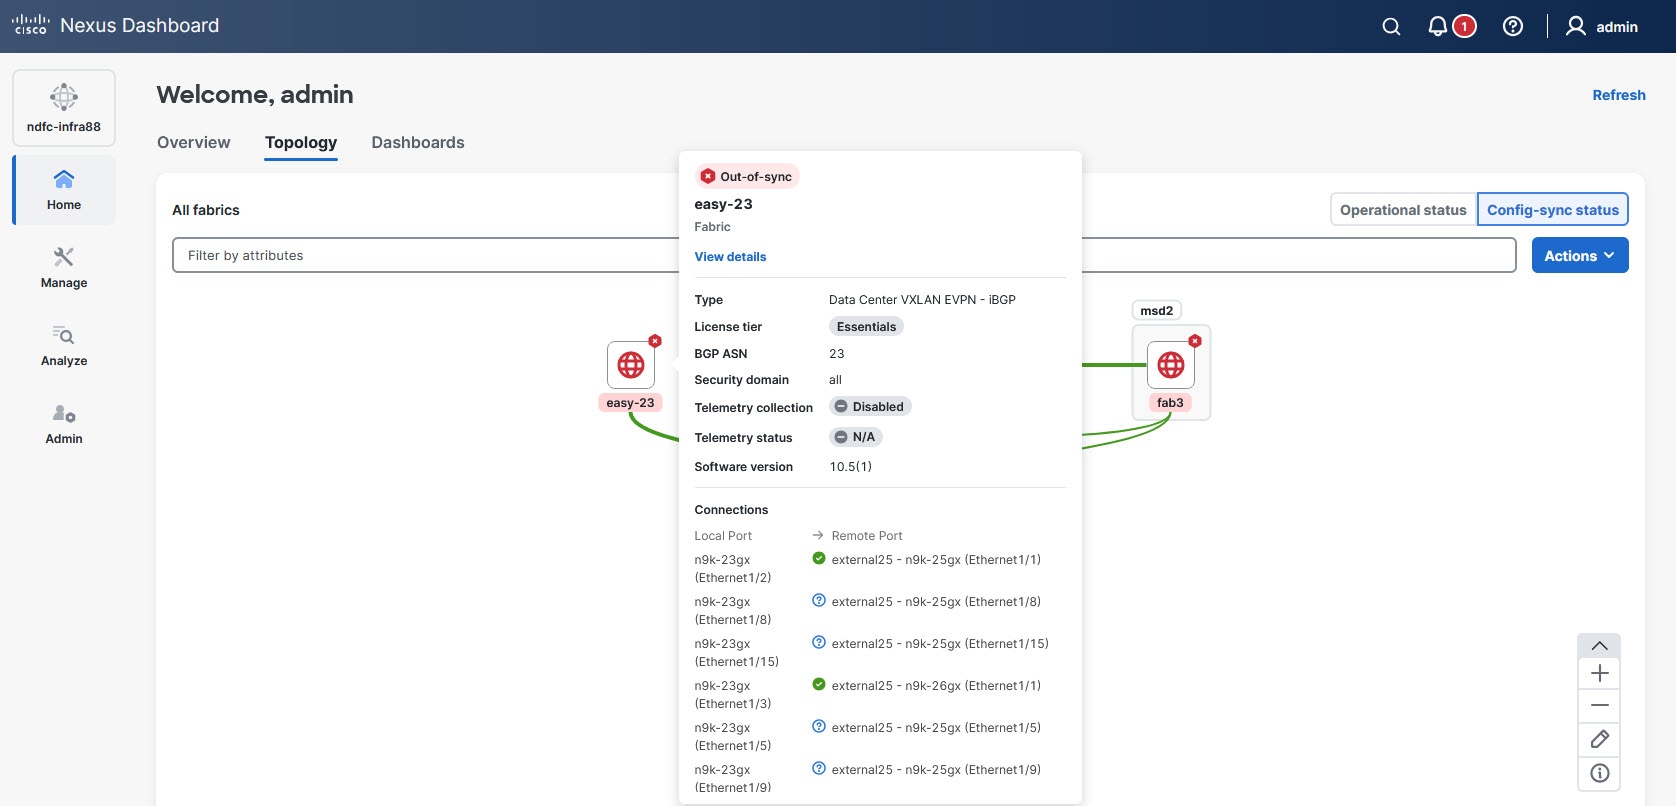
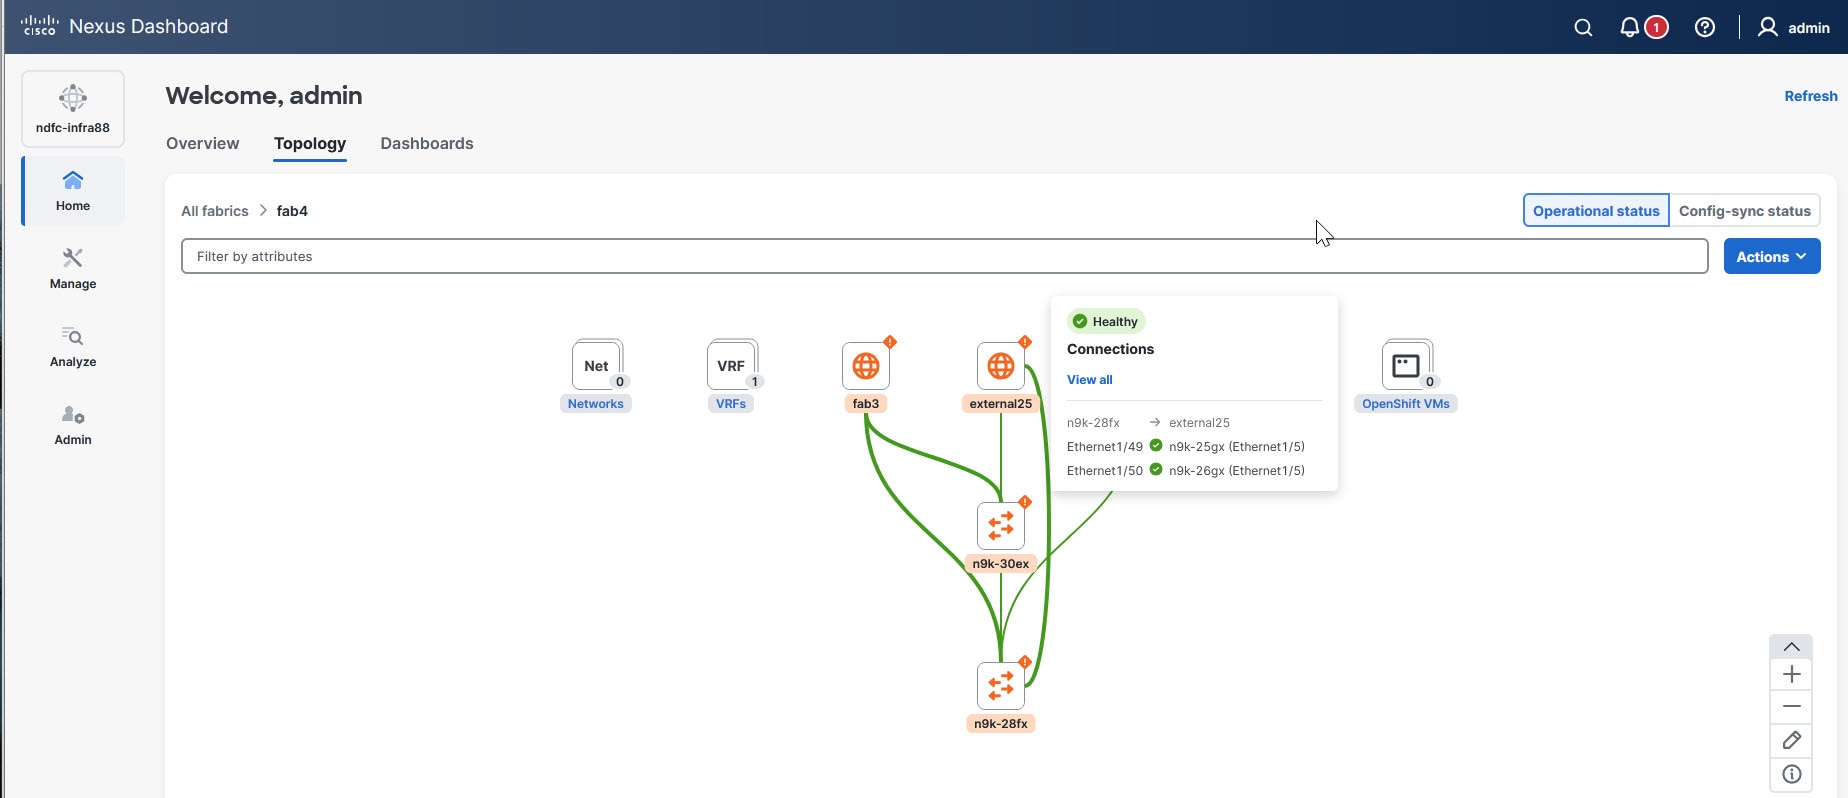
Tooltips provide quick and relevant information about elements in the Topology page to enhance usability and navigation. Single-click on an element (such as a node, link, or device) to view the tooltip that provides a general summary of that element, including key details such as its name, status, and type.
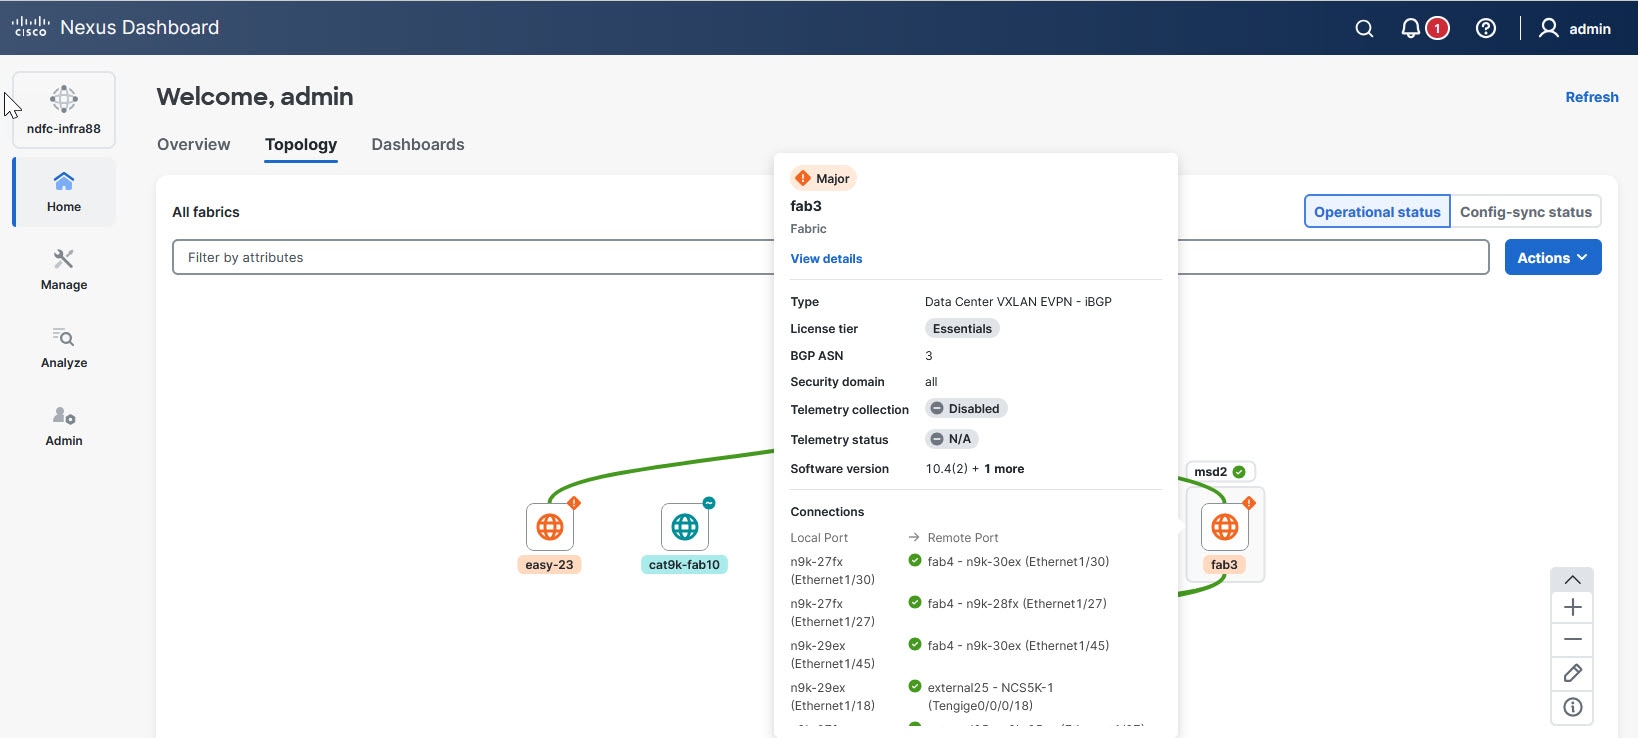
For example, single-clicking on a node displays tooltip that provides information about the existing connections and a summary of general information. You can scroll through the content of the tooltips.
You can also click View details to view the Fabric Overview page.
Clicking on a link provides information about the connected interfaces and the names of the connected devices.
Contextual menus
Right-clicking on any element in the topology view displays a contextual menu with options relevant to the specific element.
Filtering
The Filter by attributes drop-down list displays possible filters and operators that you can apply to the current view. The filter options vary depending on the view you are in.
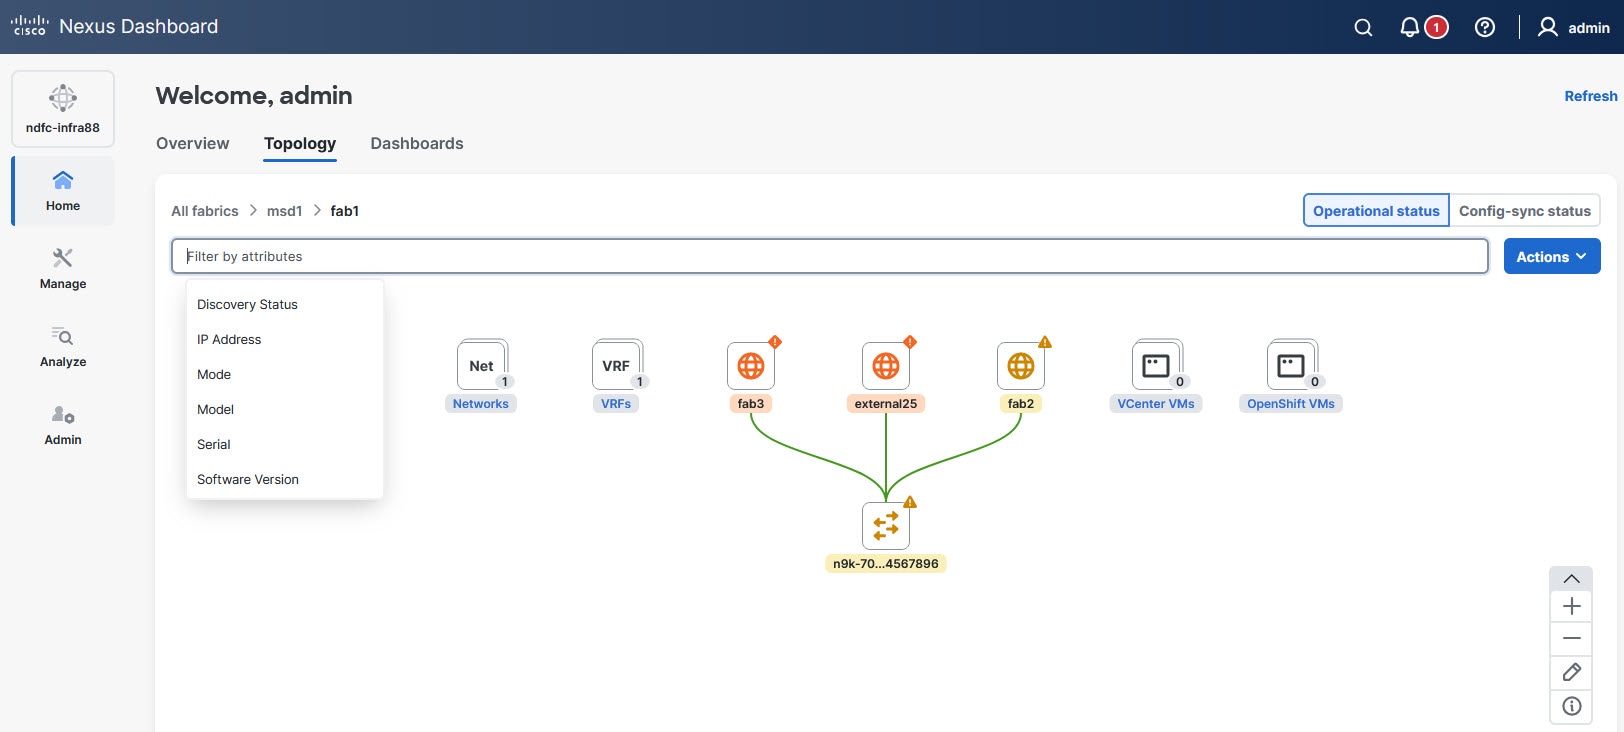
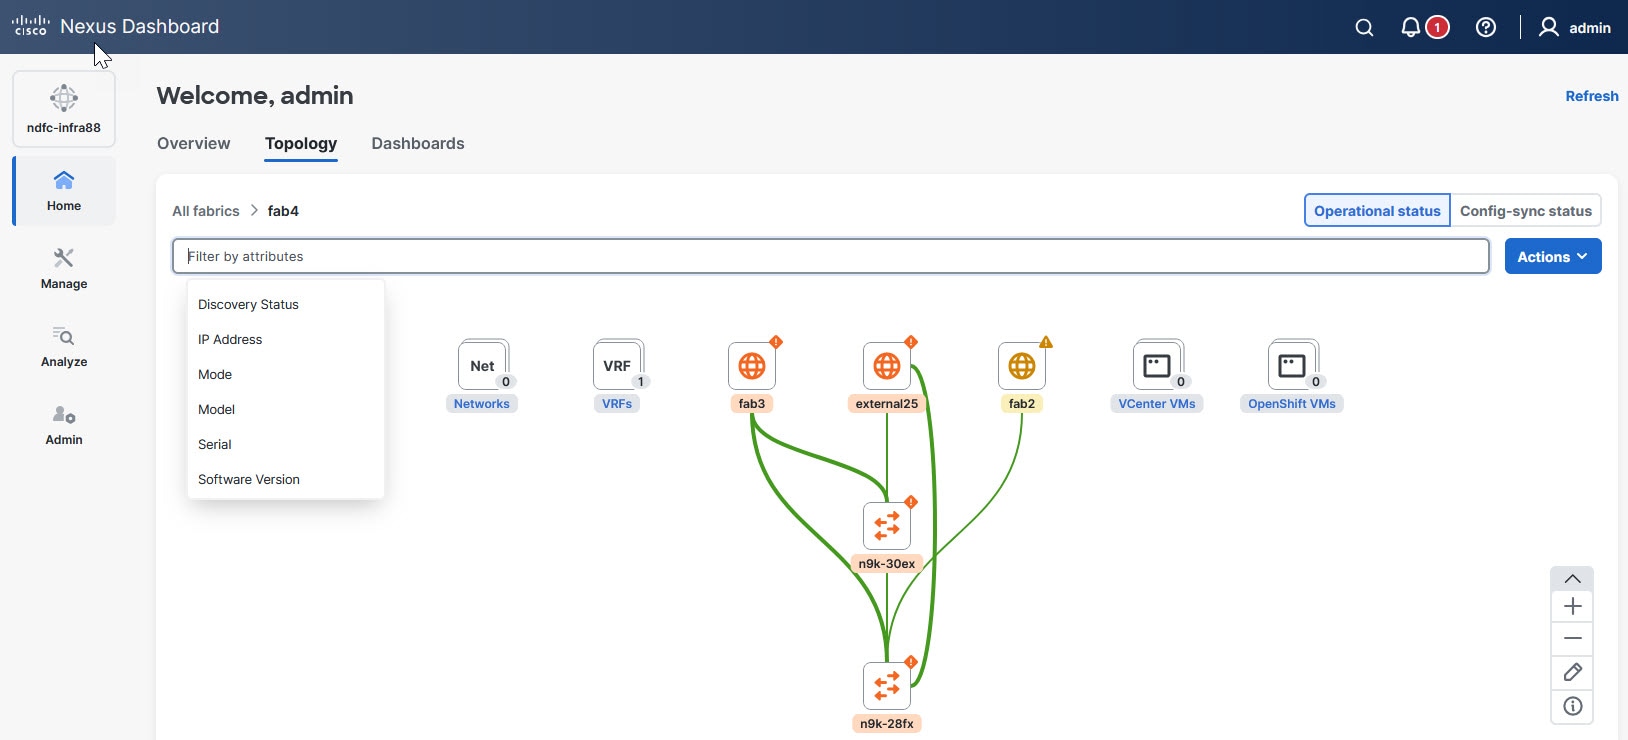
Link aggregation
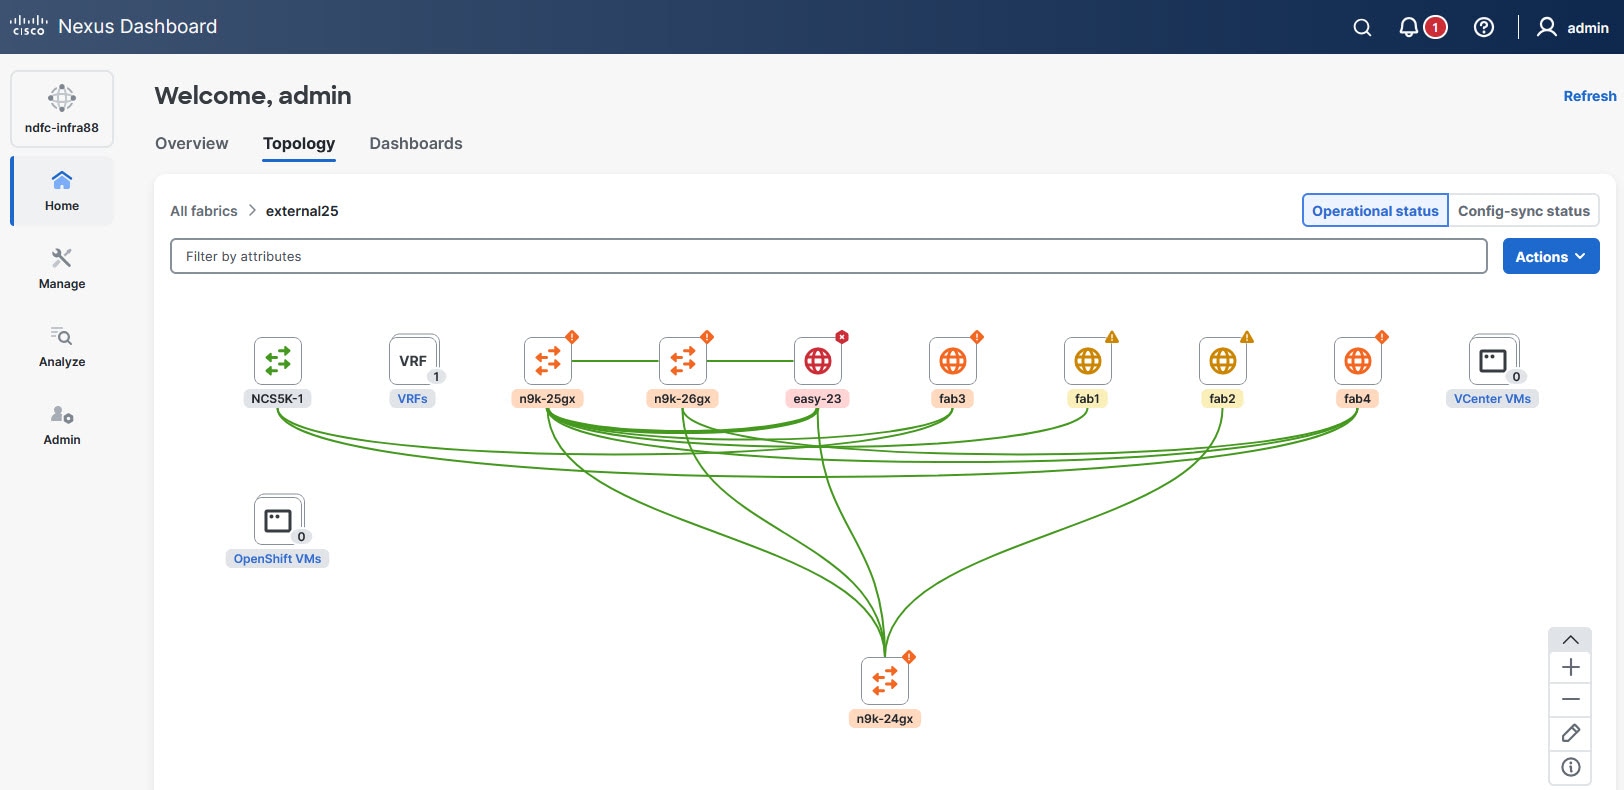
Link aggregation enables you to simplify the visualization of network connections in the topology view by combining multiple links into a single, aggregated representation.
In the Actions drop-down list, a toggle is available for Aggregate links option, which is enabled by default.
When Aggregate links option is enabled, all the individual full lines representing separate links are merged into one thick full line and all the individual dotted lines, typically denoting secondary or backup links, are combined into one thick dotted line.
This figure shows an example scenario where the Aggregate links option is enabled.
This figure shows an example scenario where the Aggregate links option is disabled.
Click on the line to view a detailed summary of all the connections within an aggregated link.
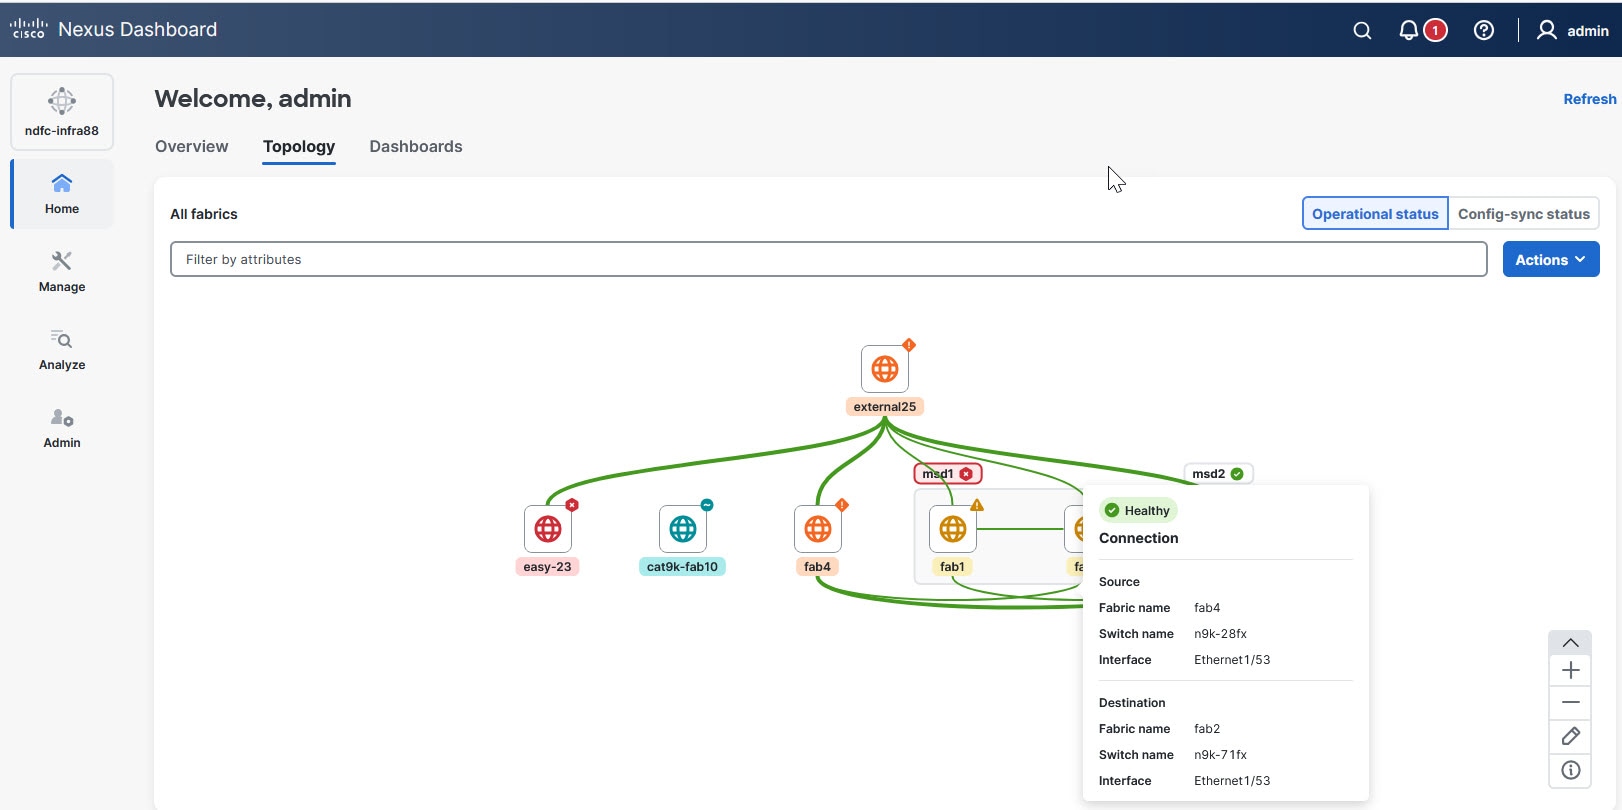
To perform specific actions on the aggregated links, click View all from the depicted content. This action redirects you to the Connections page in Nexus Dashboard, which lists all connected interfaces.
Navigate to a fabric group
Fabric groups provide a hierarchical representation of fabrics and their components. They are visually depicted as gray boxes that encapsulate all of their child fabrics.
Locate the gray box representing the desired fabric group in the Topology view.
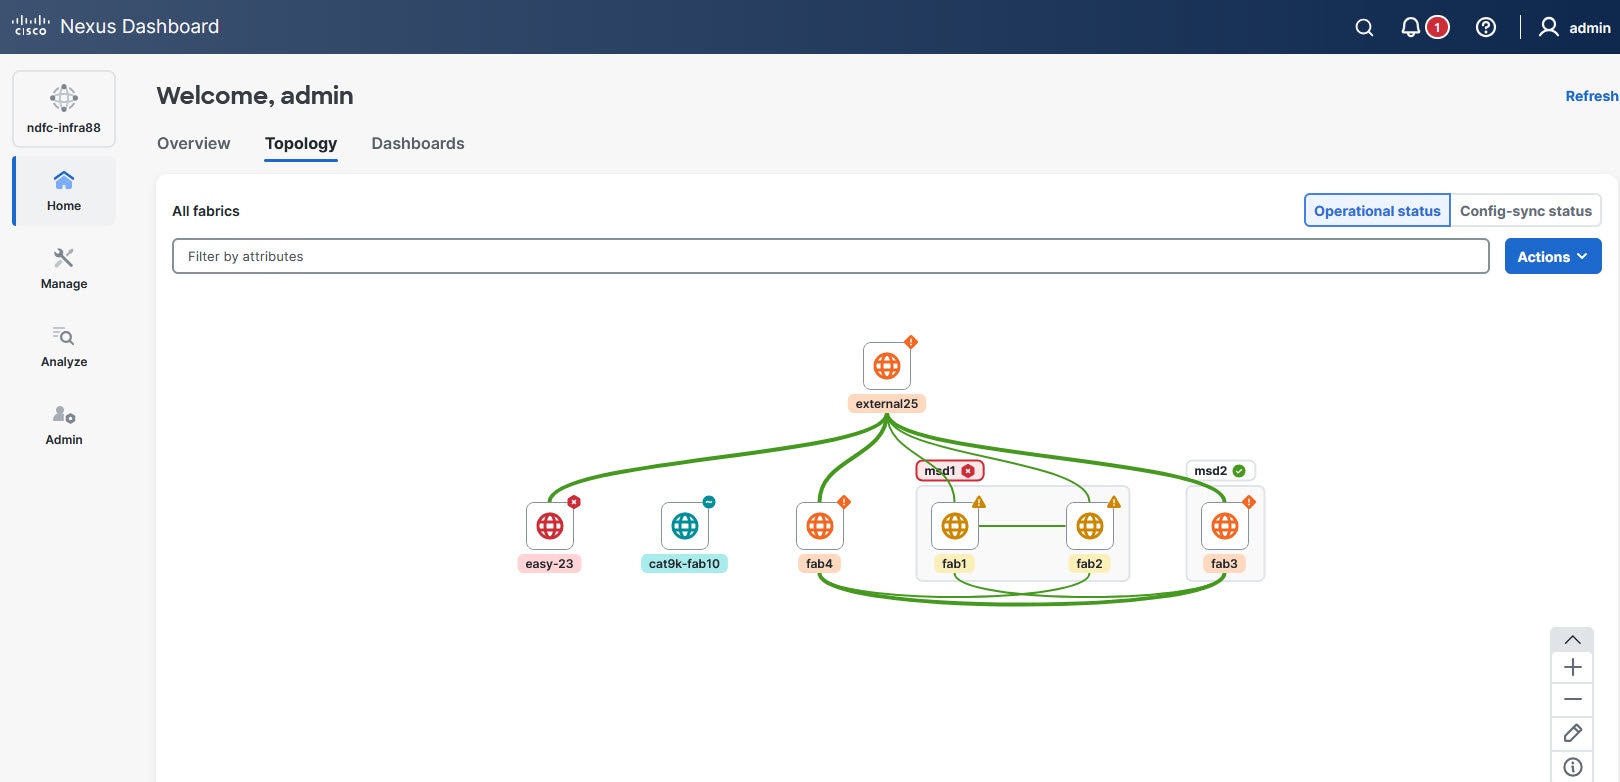
Double-click on the gray area of the fabric group. This displays a detailed view showcasing all child fabrics within the group, down to the switch level.
Within the child fabrics view, locate the gray areas representing individual fabrics. Double-click on the gray area of a specific child fabric to navigate into it.
Intra-fabric navigation
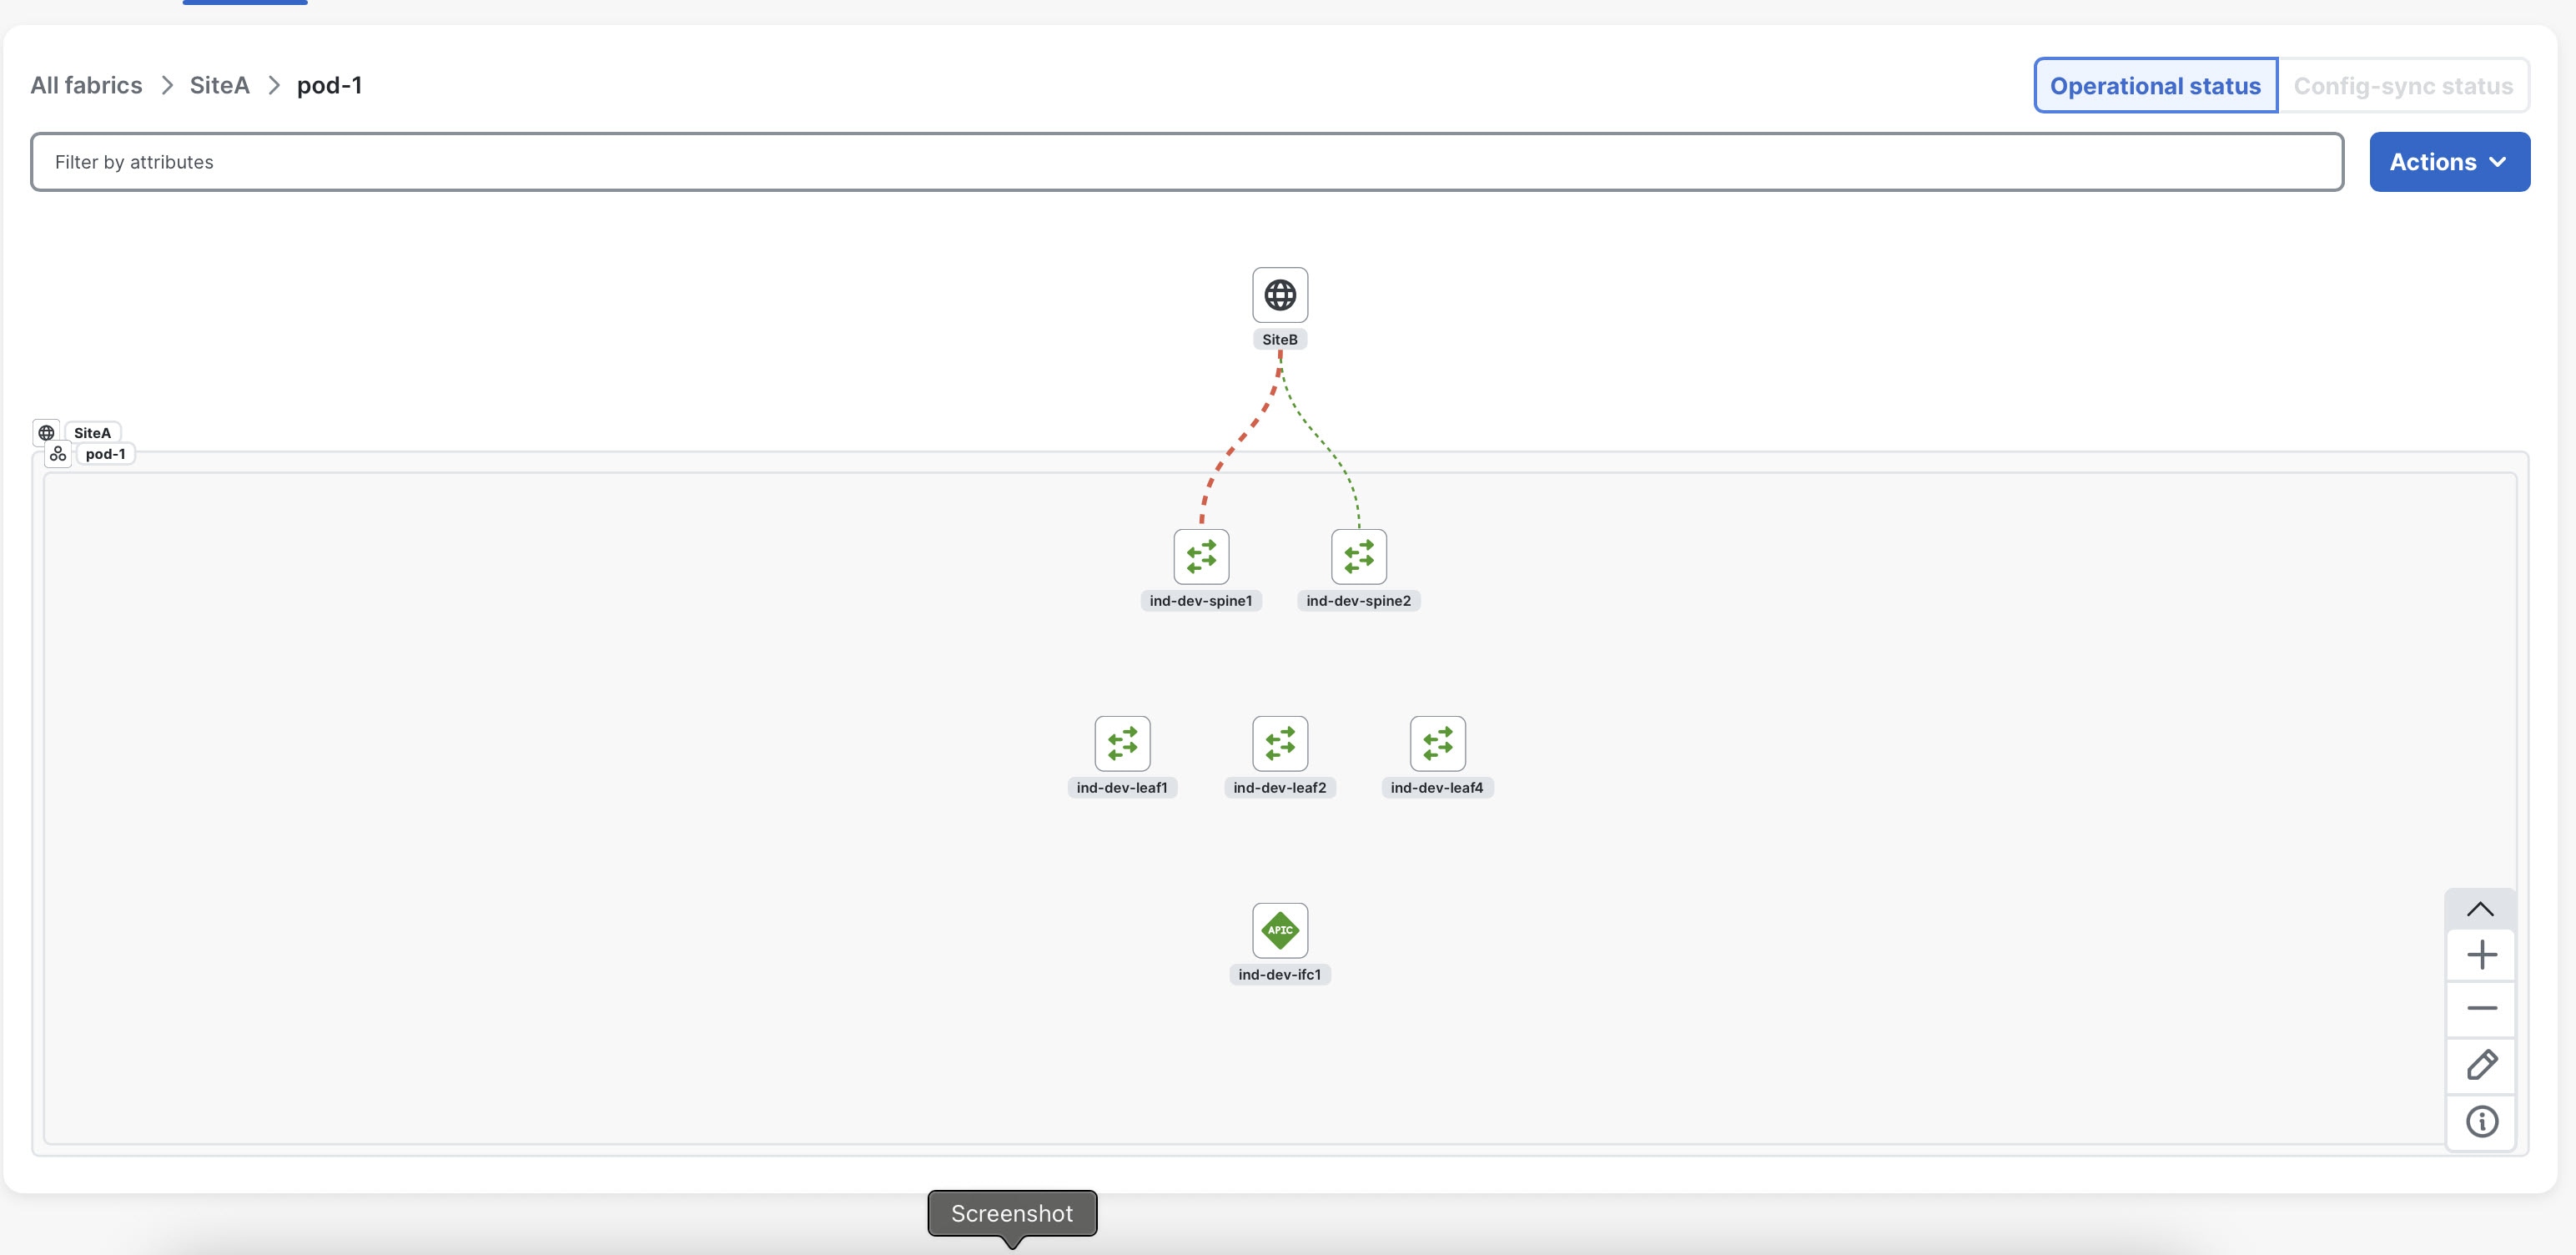
Intra-fabric navigation allows you to explore and interact with the topology of individual fabrics at a detailed level. While in the All fabrics view, you can double-click on any of the nodes marked with a globe icon to open the topology for that specific fabric, displaying its connections down to the switch level.
To view the topology for a given switch, double-click on any of the nodes.
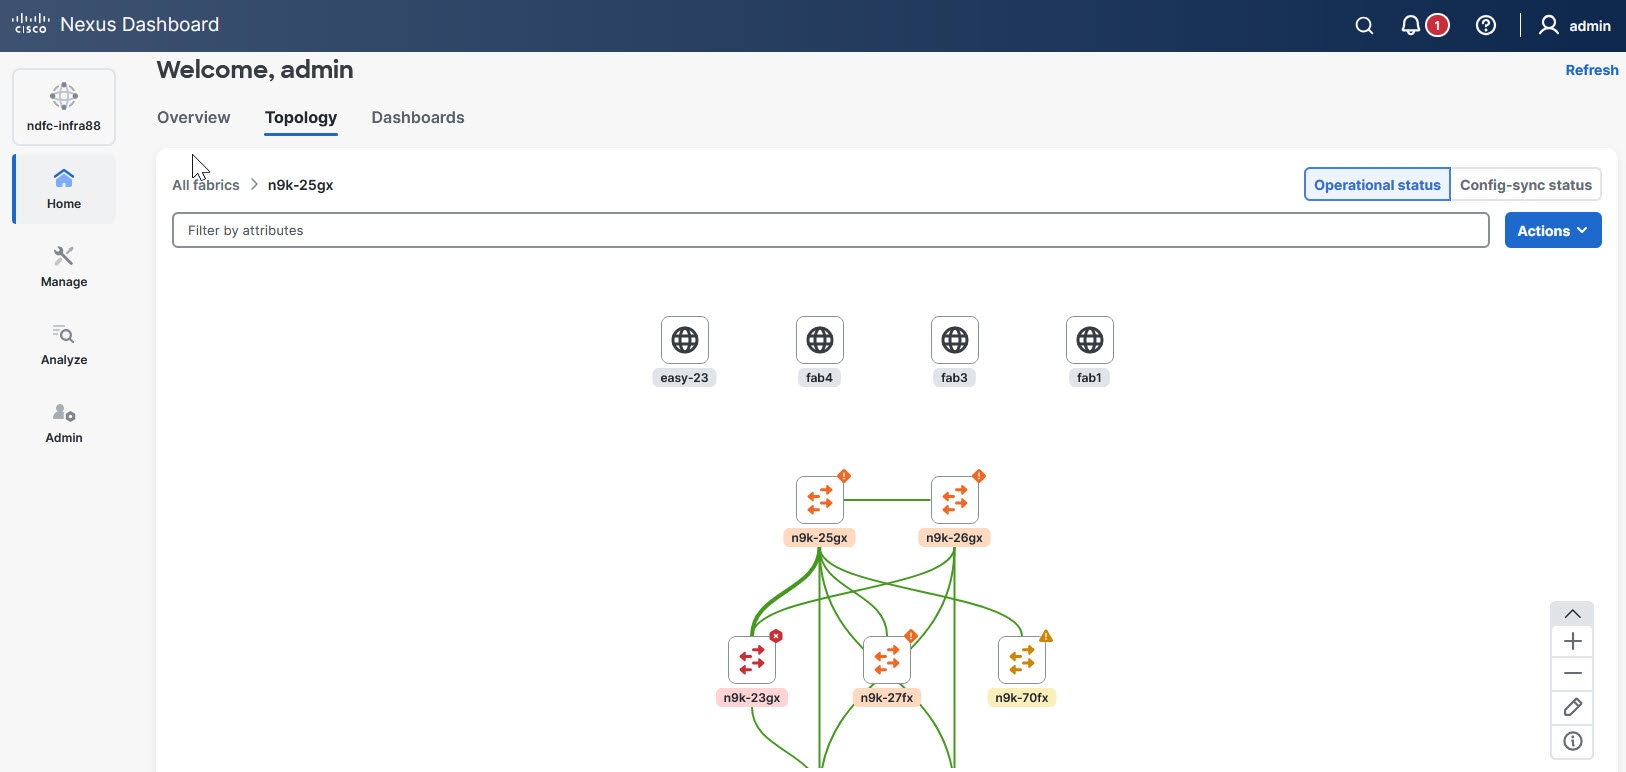
To display endpoints, such as hosts or other connected devices, within the topology of the fabric, click the Actions drop-down list and toggle the Show hosts option on.
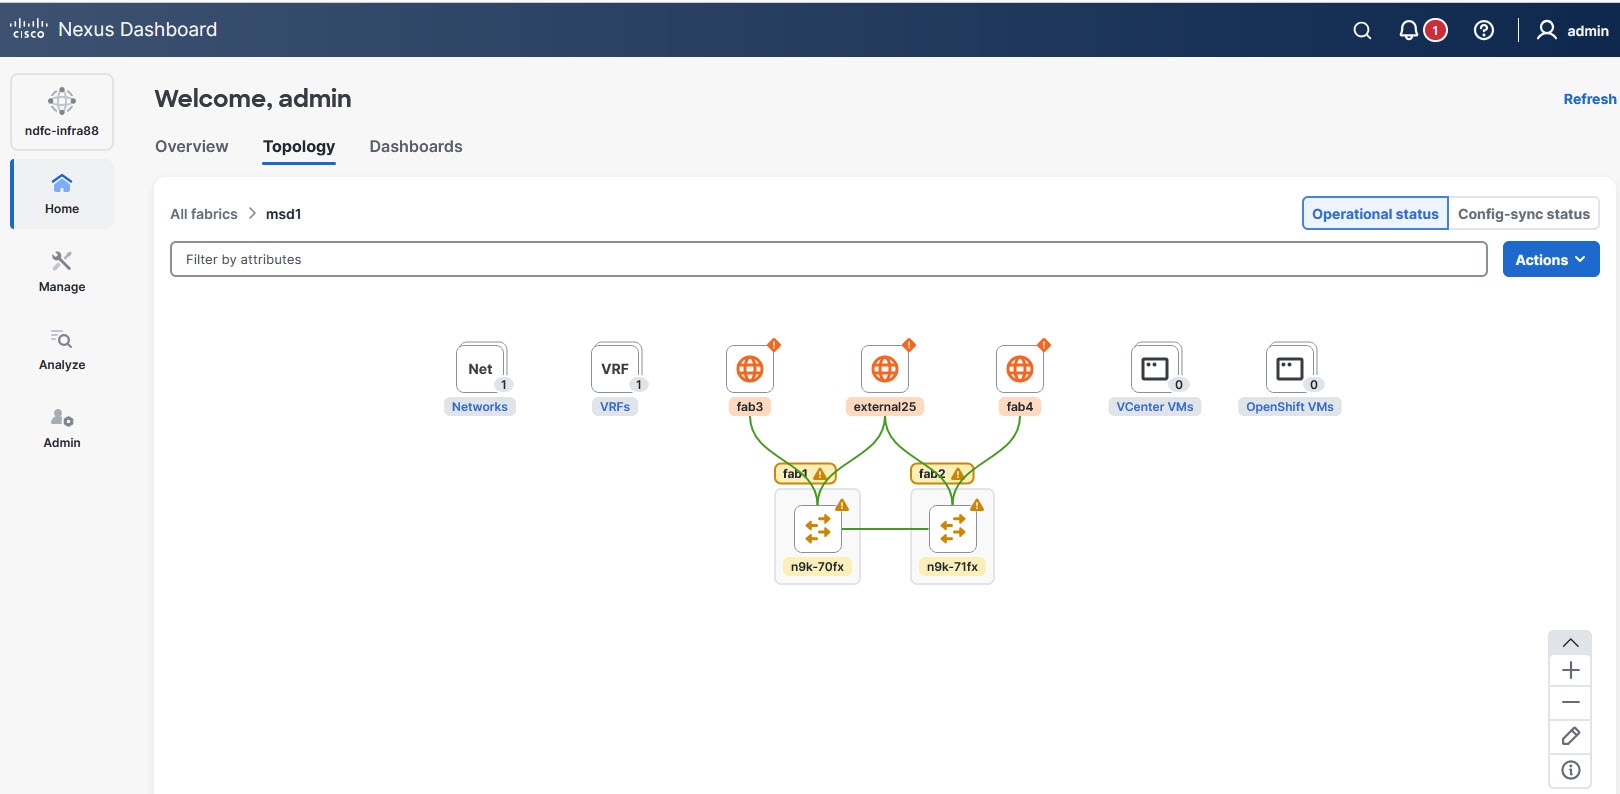
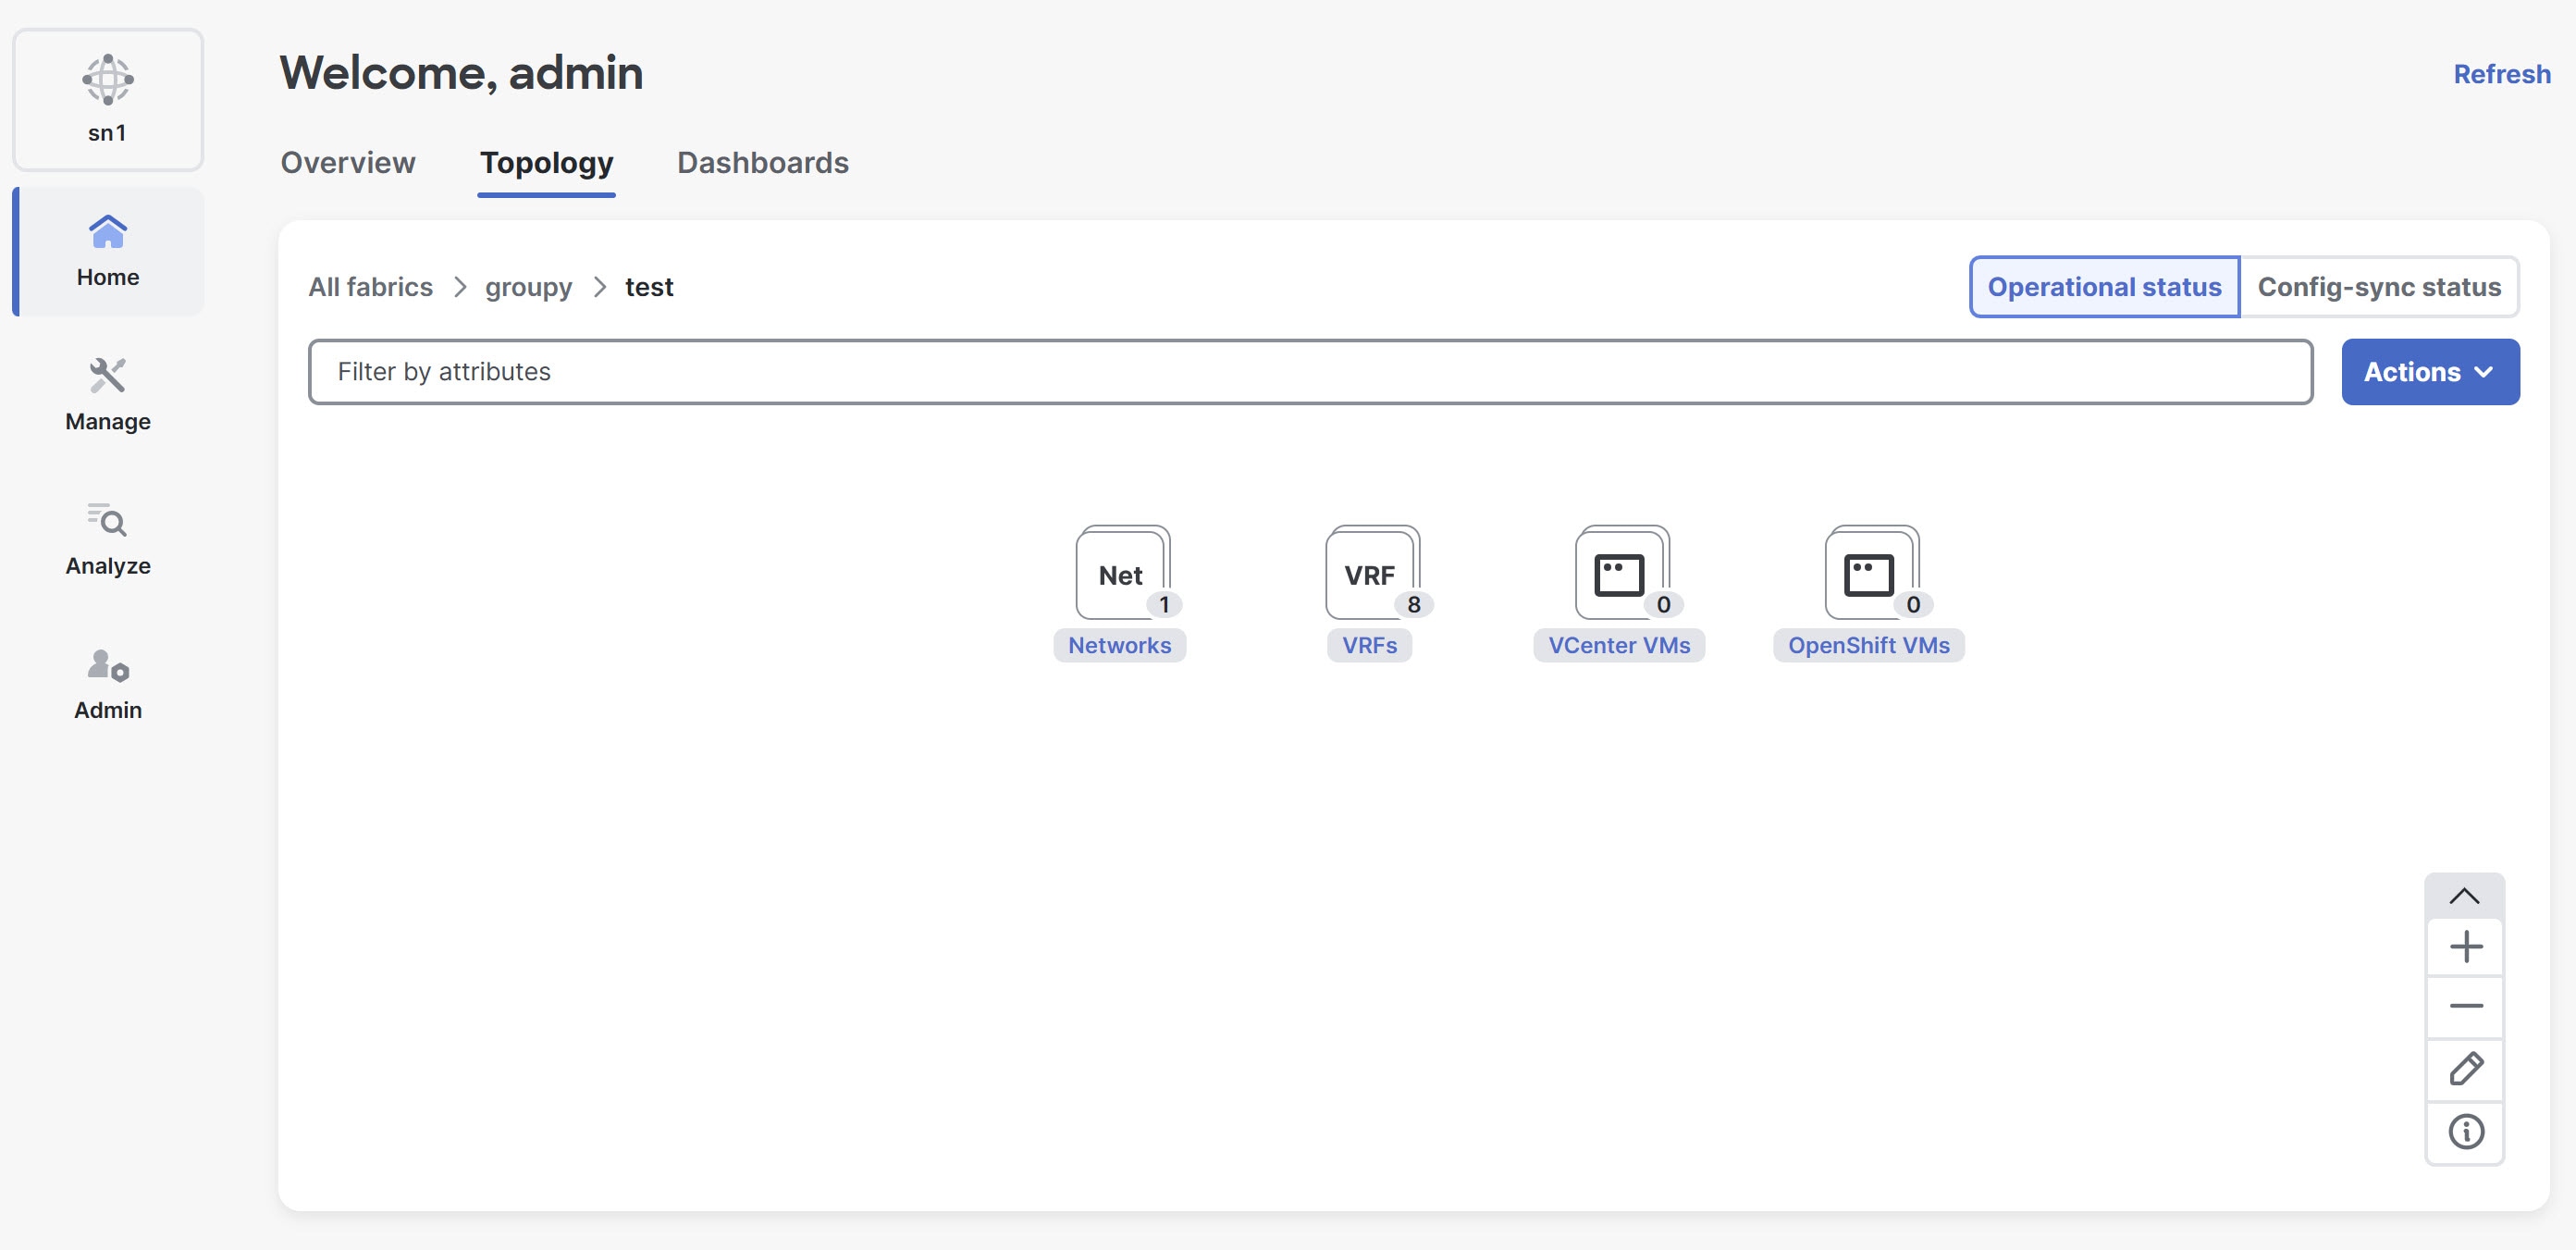
Overlays
Overlays are visual elements represented as nodes within the interface. Each node includes a number badge displayed to its right, indicating the total number of associated elements. The text label accompanying the node functions as an interactive link. When you click the text label, it opens a drawer where the corresponding data is organized and displayed in a table format for detailed viewing.
In addition to clicking the text link, you can access the same drawer through these alternative actions.
-
Double-clicking directly on the node.
-
Using the tooltip — Hover over the node to activate the tooltip, then click on the View all option within the tooltip.
Nexus Dashboard currently supports network, VRF, and security group overlays only for NX-OS fabric groups. It does not display these overlays for VXLAN-ACI fabric groups or at the MSD level when you integrate ACI and NX-OS fabrics.
Network overlays
Network overlays provide a visual representation of the network topology and allows you to interact with and manage various networks.
Double-click the number displayed on the network overlay node to open the side drawer. This side drawer lists all the available networks for easy navigation. The first column displays a spin icon for each network. Clicking this icon opens the specific topology associated with the chosen network.
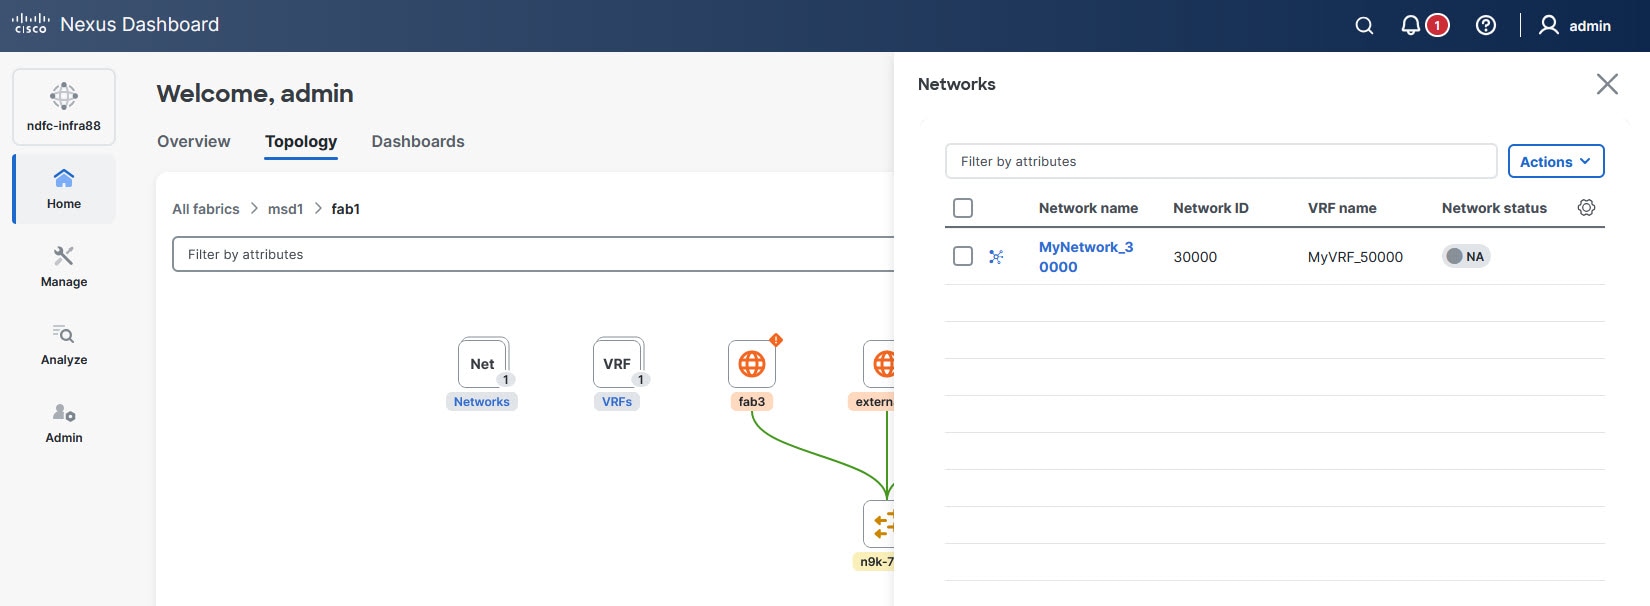
Click the spin icon next to the network name to render the topology for this network. Upon accessing the topology of the network, you are automatically placed in Configuration mode. In this mode, the layout selection option is disabled by default, ensuring that configurations are prioritized.
VRF overlays
VRF overlays provide a visual representation of Virtual Routing and Forwarding (VRF) instances within the network topology.
Double-click the number displayed on the VRF overlay node to open the side drawer. The first column displays a spin icon that you can use to access the topology of each VRF.
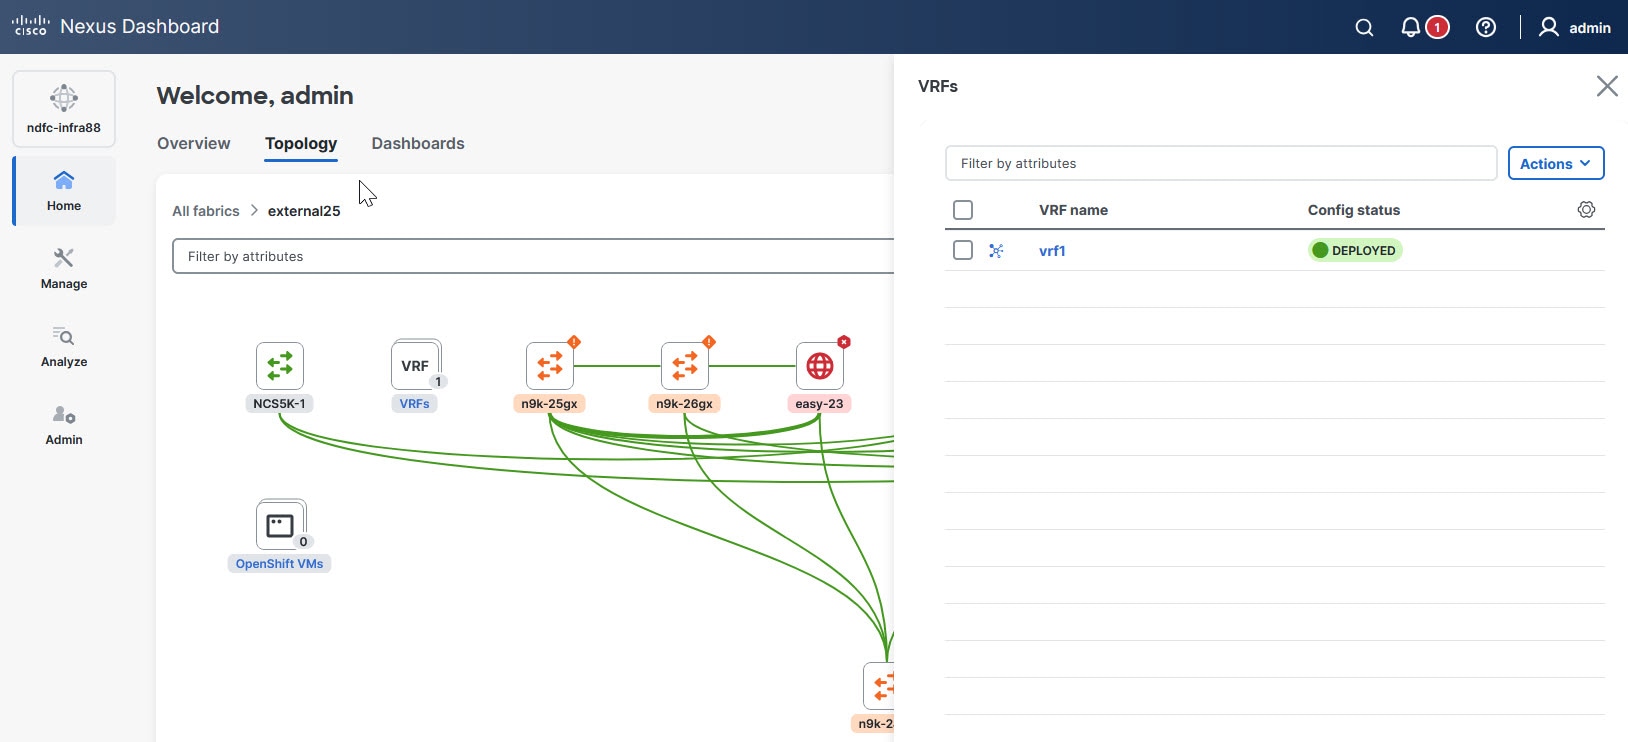
Click the spin icon to render the topology for this VRF. Upon accessing the topology of the VRF, you are automatically placed in Configuration mode. In this mode, the layout selection option is disabled by default, ensuring that configurations are prioritized.
Security group overlays
Security group overlays provide a visual overview of all the configured security groups within the network topology.
Double-click the number on the security group overlay node to open the side drawer. The first column displays a spin icon that you can use to access the topology specific security group.
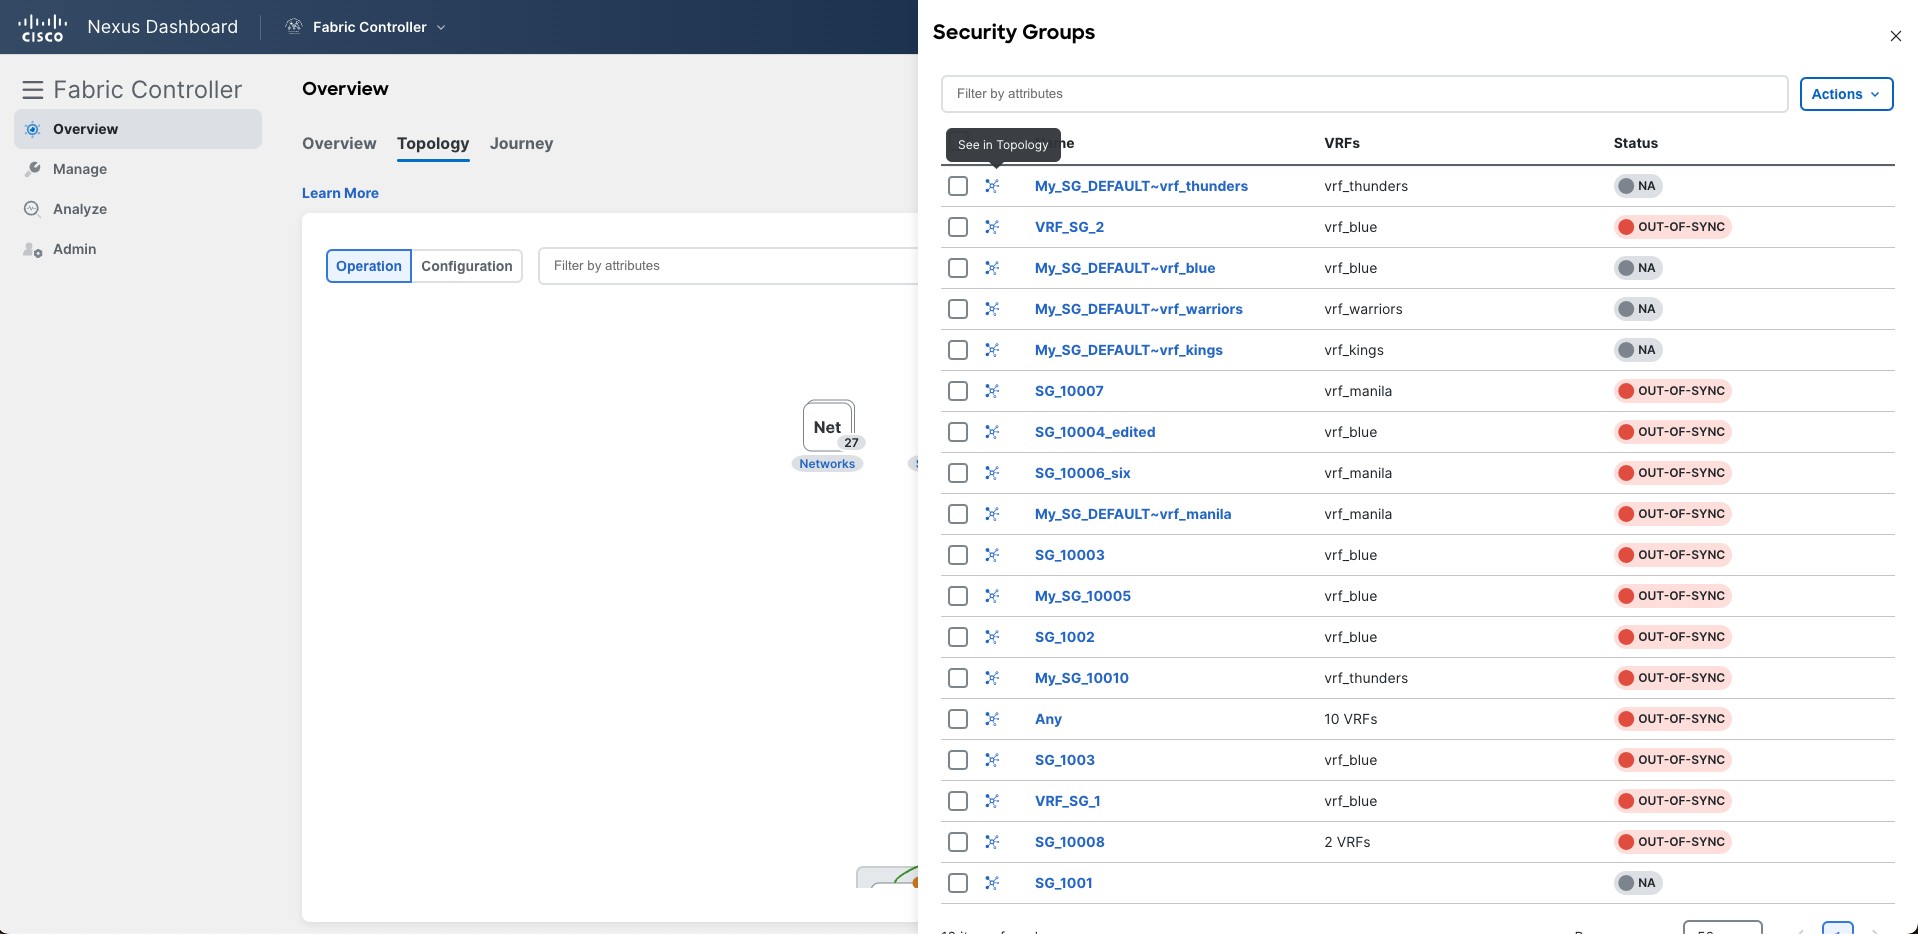
Click the spin icon to render the topology for this security group. You are placed in the Configuration mode by default with the layout selection disabled and the layout changed to horizontal.
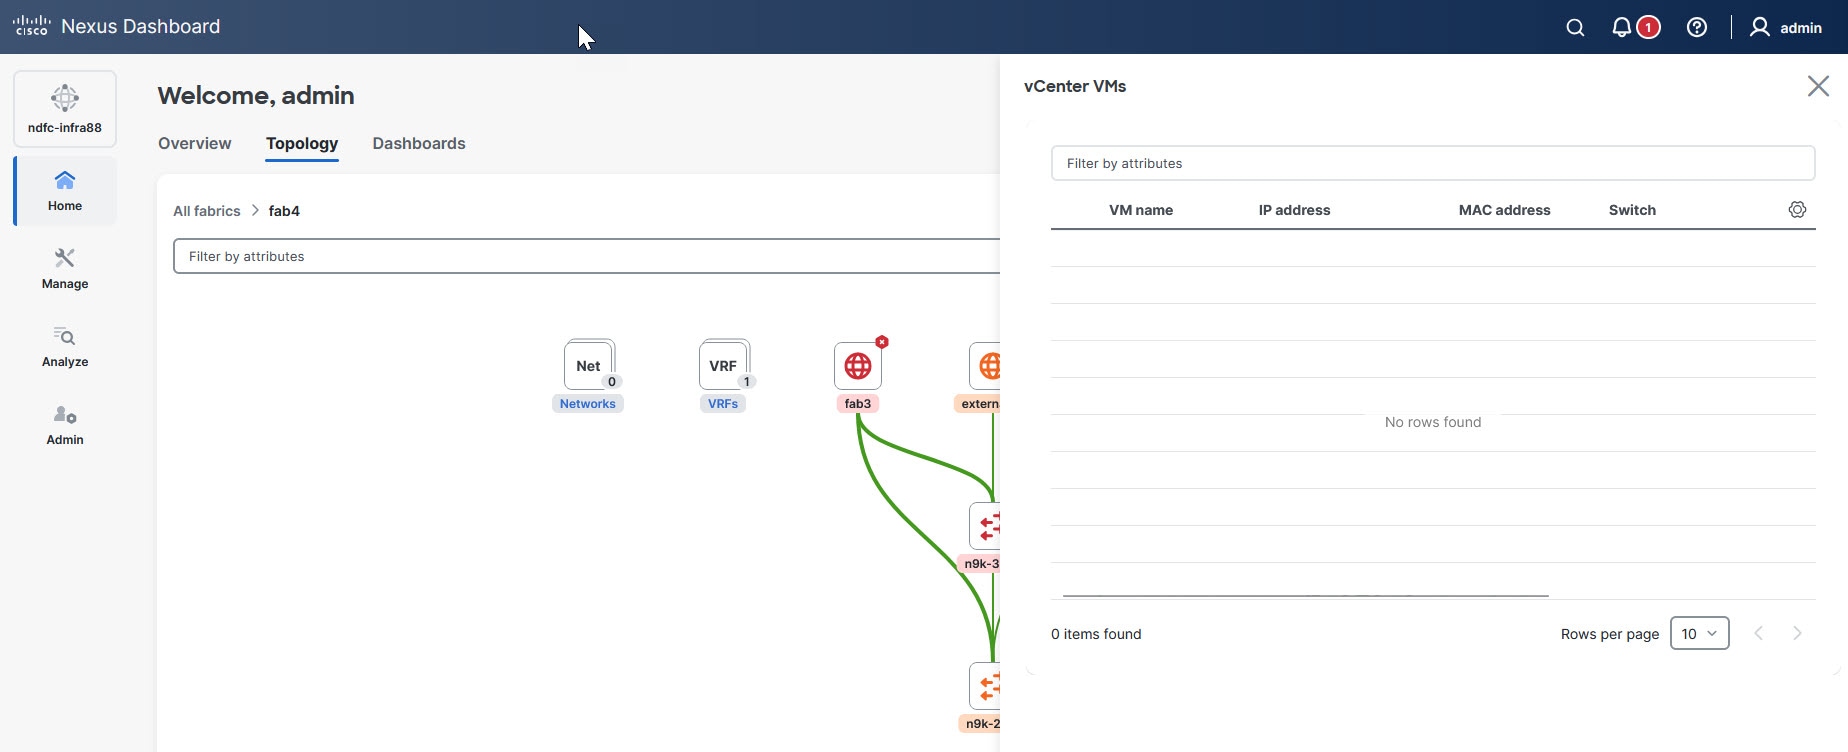
VM overlays
VM overlays provide a visual representation of all virtual machines (VMs) within the network topology.
Double-click the number on the VM overlay node to open the side drawer. The first column displays a spin icon that you can use to access the topology of each VM.
Click the spin icon to render the topology for this VM, with the layout selection disabled.
The Topology page does not display connectivity between FEX devices and ESX hosts or VMs. Although the switch view on the Topology page includes FEX switches and displays connectivity between leaf/spine switches and ESX hosts, it does not represent the direct links from FEX devices to ESX hosts or VMs. This limitation applies when FEX devices are connected to ESX hosts managed by vCenter, Kubernetes, OpenShift, and other endpoints.
Multi-node selection
The multi-node selection allows you to choose multiple nodes within a visual interface efficiently.
Click and hold the left mouse button in an empty area near the nodes you want to choose. Drag the mouse to form a rectangular selection box around the desired nodes. Release the mouse button once all the required nodes are within the selection area.
On macOS, press and hold the Cmd key on your keyboard, then click each node you want to choose.
The chosen nodes displays a highlighted background to indicate they are part of the current selection.
Right-click on any of the highlighted nodes to access the context-specific actions for your selection.
Topology view for Orchestration-only ACI fabric
Starting with this release, the topology view is available for an ACI fabric where only orchestration is enabled and telemetry is not. Nexus Dashboard visualizes the fabric topology from orchestration data, independent of telemetry collection. However, if you disable orchestration for an ACI fabric, Nexus Dashboard will no longer display the fabric in the all cluster topology view.
View topology snapshots
The topology snapshots feature in Nexus Dashboard allows you to capture and analyze the network topology states. Topology snapshots allows you to track changes in topologies over time and compare topologies side-by-side. Snapshots are taken automatically every 3 hours. It supports both mergeable comparisons and table-based comparisons. This functionality is especially beneficial for planning network changes, troubleshooting issues, and auditing network infrastructure.
This feature is available only for LAN fabrics. You can access this feature only at specific levels of the topology, provided you enabled it in the System Settings page. For more information, see Enable topology snapshots.
This feature is available in these levels of topology.
-
All fabrics — Snapshots are taken across all fabrics.
-
Any fabric — Snapshots are available for individual fabrics.
-
Any MSD (multi-site domain) — Snapshots are taken for a fabric group.
-
Any switch under a fabric — Snapshots are accessible after drilling down to an individual switch within a fabric.
-
Pods within ACI fabrics — Snapshots are created for pods in ACI environments.
Follow these steps to view topology snapshots.
-
Navigate to Home > Topology.
-
From the navigation controls in the lower-right corner, click Open Snapshots.
The Snapshot page displays.
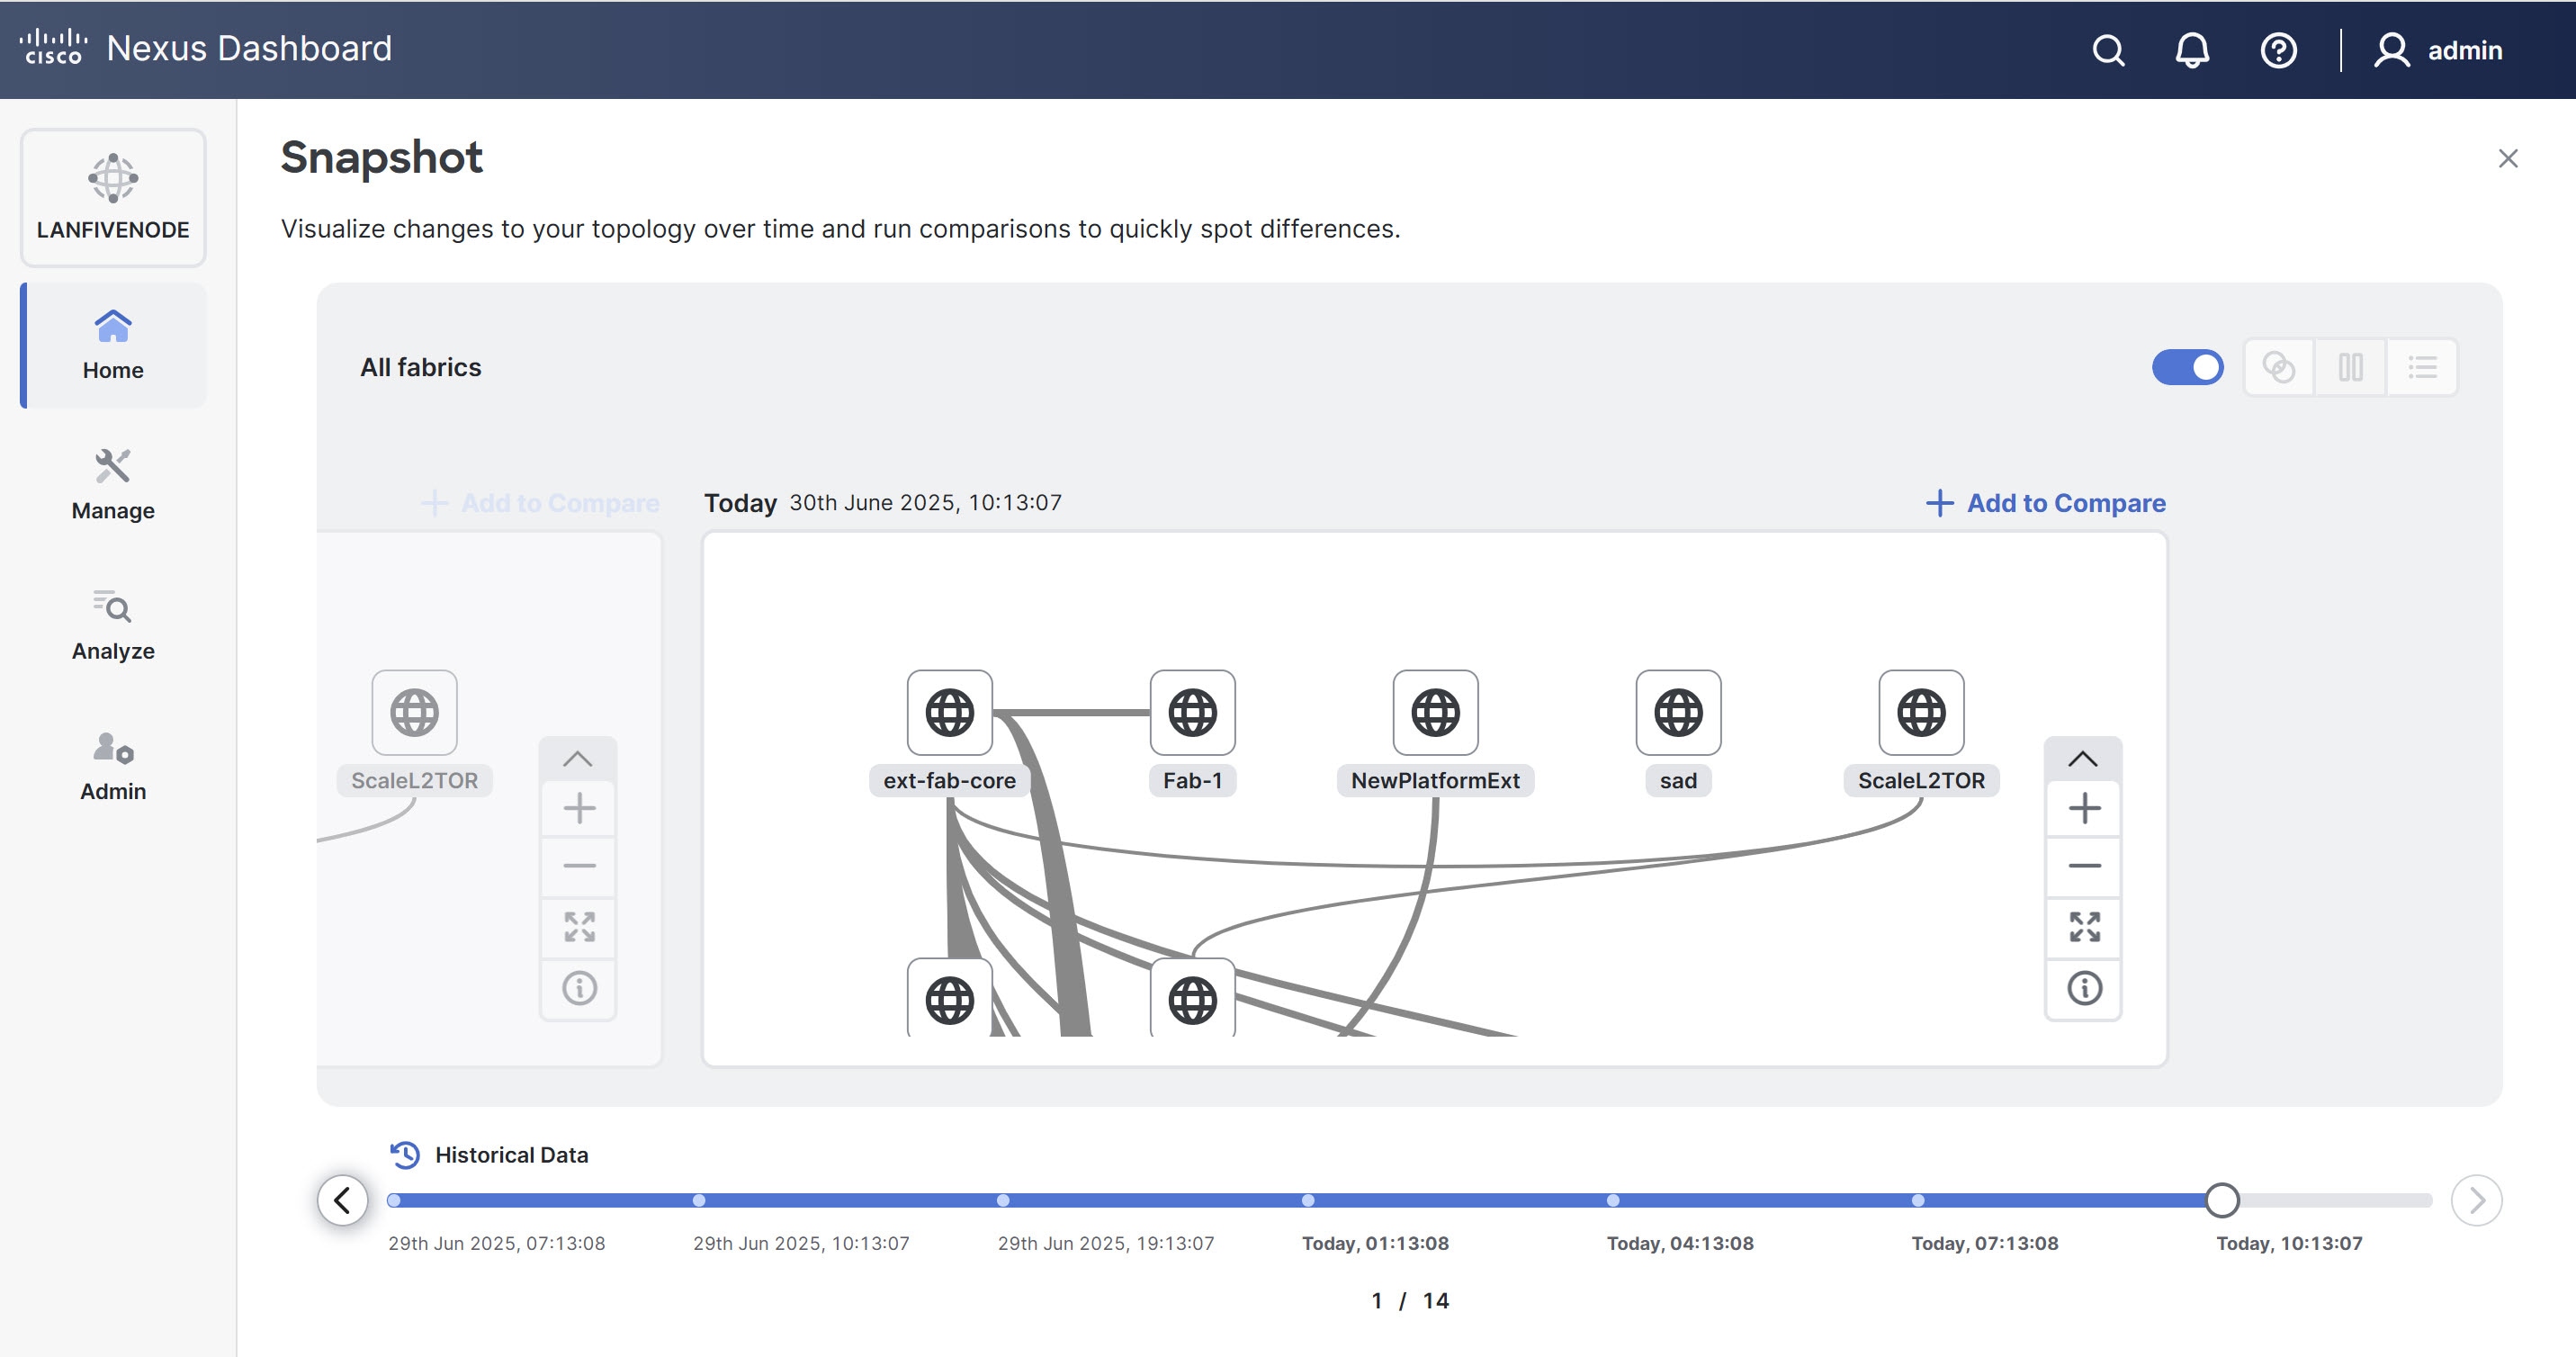
You can view the historical topology data collected every three hours depending on changes. You can use the left and right arrows to navigate and view the historical data.
If you do not make any changes to topology, Nexus Dashboard does not actively collect any data.
Enable topology snapshots
Follow these steps to enable topology snapshots.
-
Navigate to Admin > System Settings.
-
Click the Fabric management tab.
-
Under Topology snapshots, click Edit.
The Manage topology snapshots dialog box displays.
-
In the Manage topology snapshots dialog box, choose the Enable topology snapshots check box.
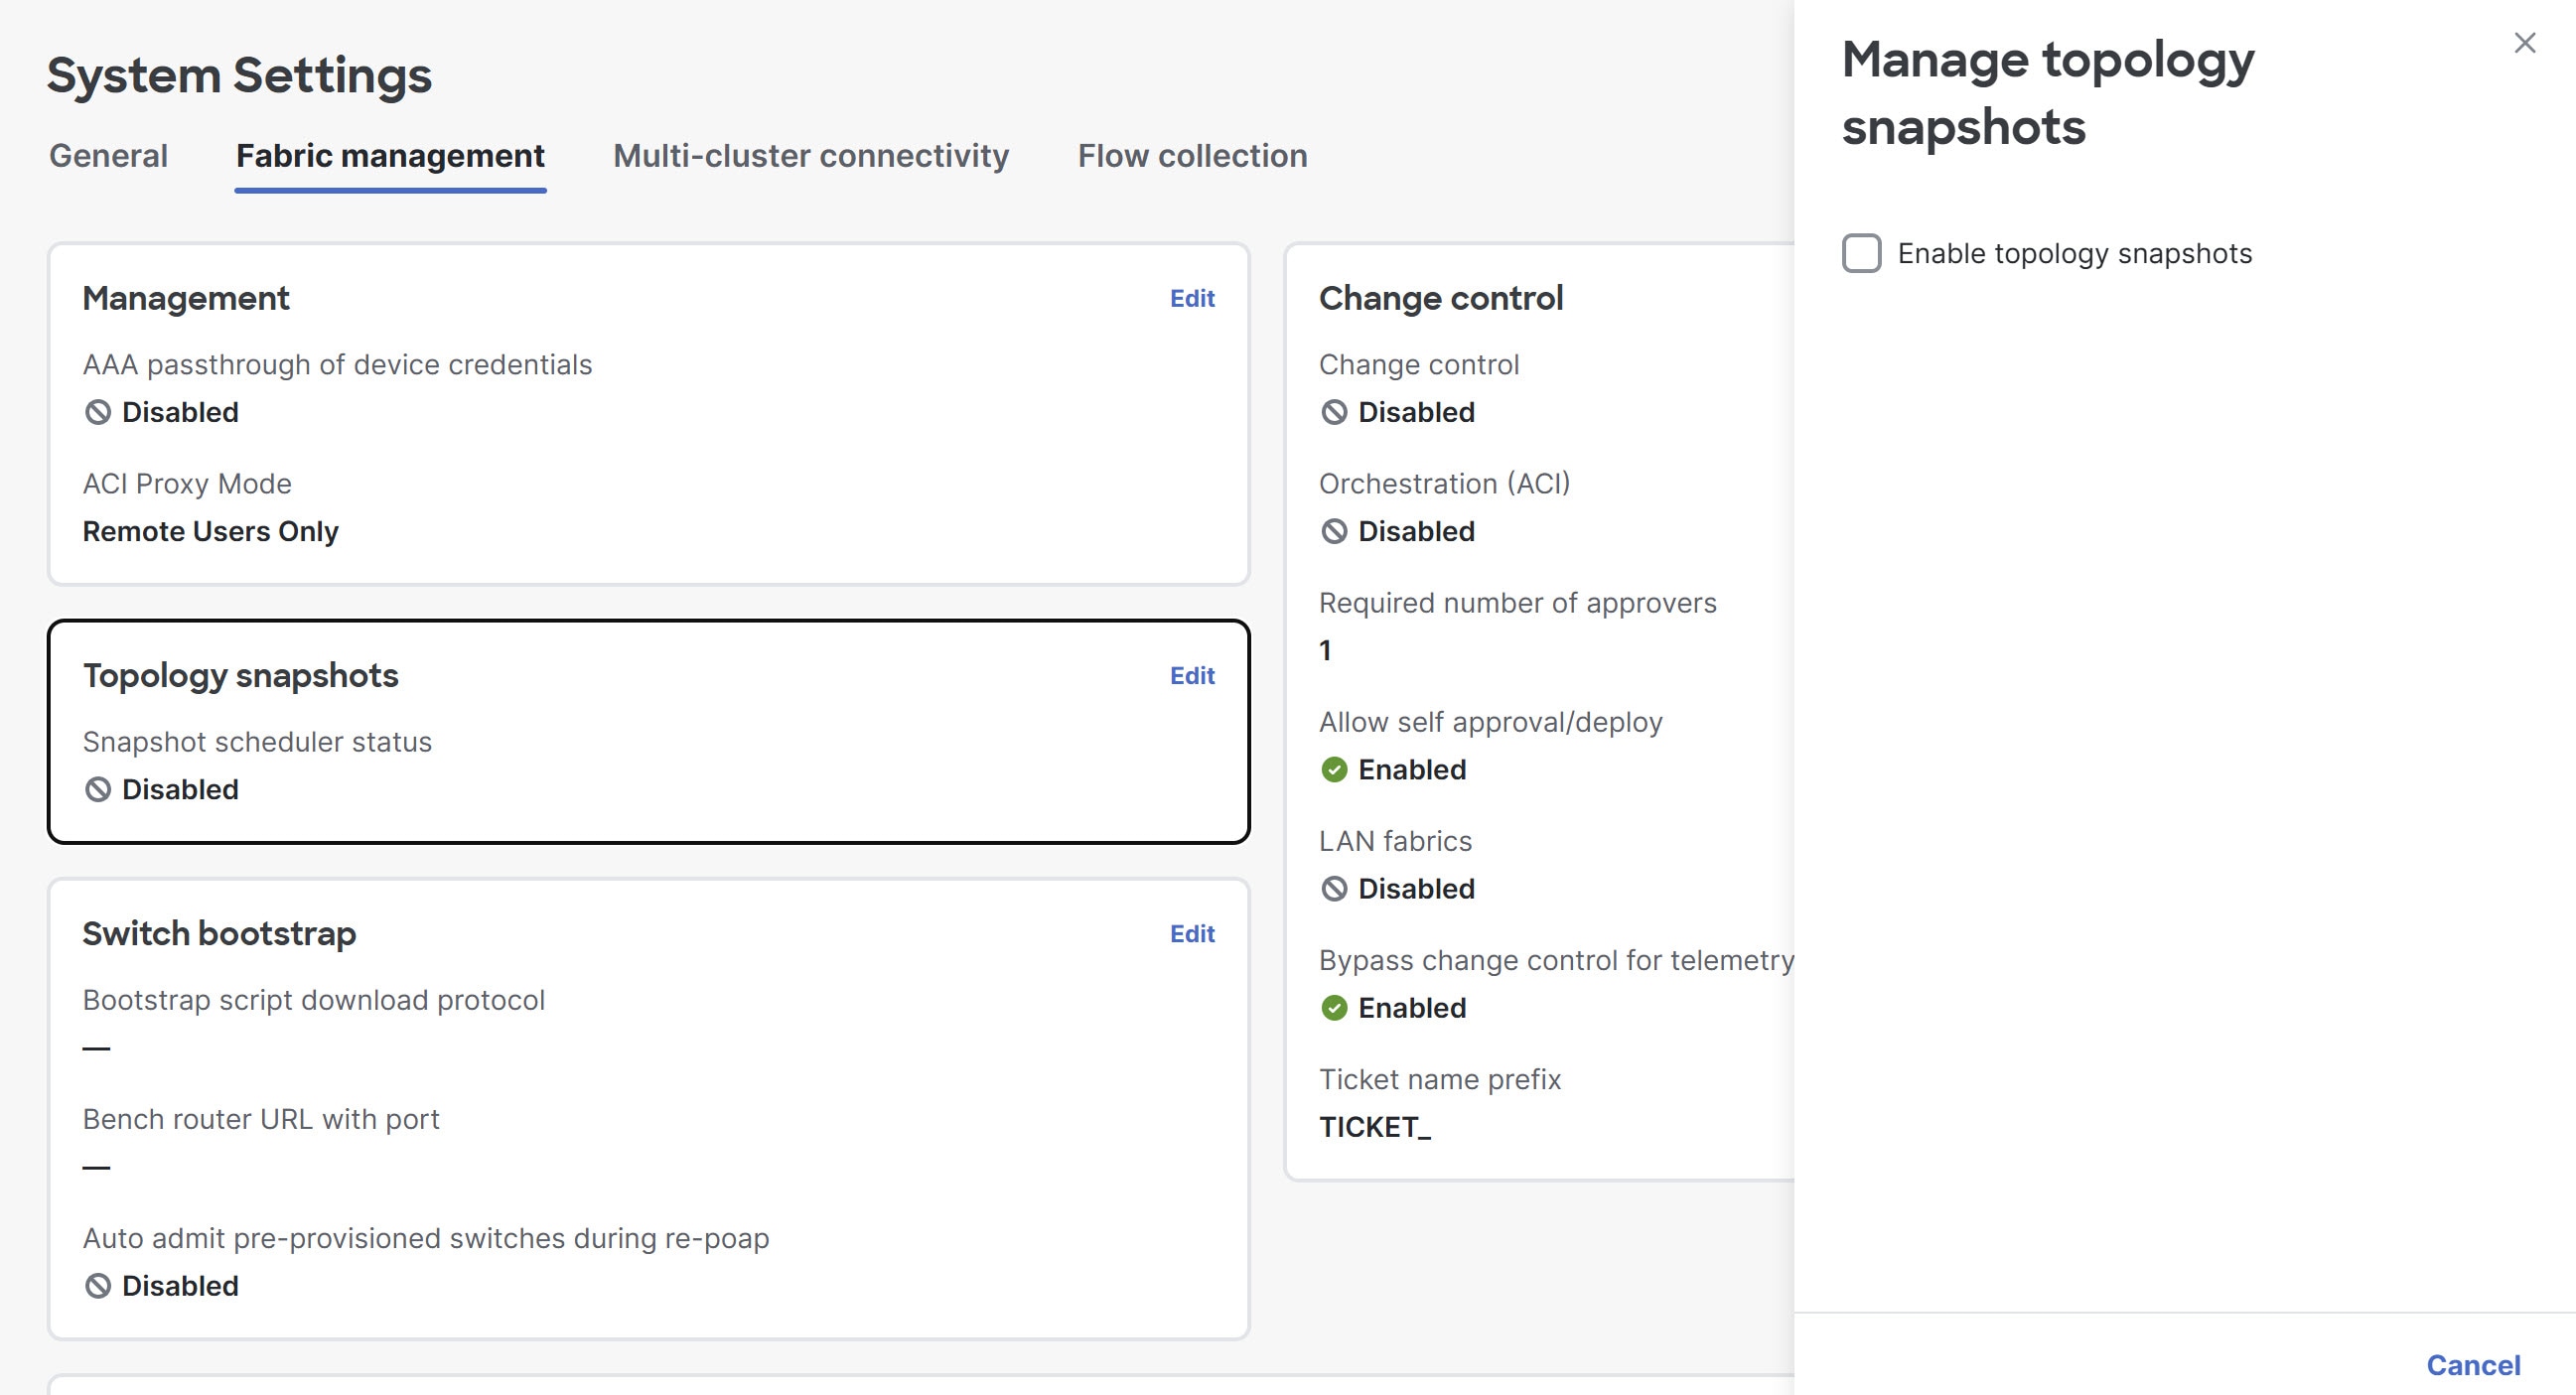
-
Under Topology snapshots, you can view the Snapshot scheduler status enabled.
Compare topology snapshots
Nexus Dashboard allows you to compare topology snapshots that enables you to quickly identify differences between snapshots, such as changes in interfaces, routes, or other topology elements.
Follow these steps to compare topology snapshots.
-
In the Snapshot page, choose the first snapshot you wish to compare.
-
click Add to Compare.
A Compare card appears, with the current snapshot chosen.
-
Click the left and right arrows below the snapshots to navigate.
-
Choose the other snapshot that you wish to compare with and click Add to Compare again.
You can view the comparison of the past topology to the current.
Refer to the legend at the bottom of the page for additional details.
-
You see the following icons in the upper-right corner of the Snapshot page.
-
Merge comparison — Enables you to view the detailed comparison results.
-
Pause — Enables you to view the snapshots side-by-side.
-
List — Enables you to view the comparison details in a table.
-
Create adhoc snapshots
Adhoc snapshots are useful for troubleshooting or capturing the state of Nexus Dashboard before implementing significant changes. These snapshots help preserve the current configuration and topology for reference or rollback purposes.
Follow these steps to create adhoc snapshots.
-
Navigate to the Topology page.
Go to Home > Topology.
-
From the Actions drop-down list, choose Adhoc Snapshot.
A confirmation dialog box appears prompting you to confirm whether you want to create an adhoc snapshot.
-
Click Confirm to create adhoc snapshot.
A success message is displayed, indicating that the snapshot has been successfully created.
You can also create adhoc snapshots by right-clicking on any rendered element within the Topology page and choosing the Adhoc Snapshot option.
View SAN fabric components in Topology
The Topology page displays color-encoded nodes and links that correspond to various network elements, including switches, links, fabric extenders, port-channel configurations, virtual port-channels, and more.
Use the Topology page to perform these tasks.
-
To view more information about each of these elements, hover your cursor over the corresponding element.
-
To view your navigation in the topology, view the breadcrumb at the top.
-
When you click the device or the element, a slide-in pane appears from the right that displays more information about the device or the element. To view more information in the topology, double-click a node to open the node topology. For example, to view the fabric topology and its components on the Topology page, double-click the fabric node and then double-click an element that you want to view, such as a host, a multicast group, or a multicast flow, as applicable to the fabric type, and view the respective topology.
-
If you want to view the summary for fabrics, click the fabric node. From the Fabric Summary slide-in pane, open the Fabric Overview page. Alternatively, you can right-click a fabric and choose Detailed View to open the Fabric Overview page. For more information about the fabric overview page, see Understanding Fabric Overview for SAN Fabrics.
-
Similarly, you can click on a switch to display the configured switch name, IP address, switch model, and other summary information such as status, serial number, health, last-polled CPU utilization, and last-polled memory utilization in the Switch slide-in pane. To view more information, click the Launch icon to open the Switch Overview page. For more information about the Switch Overview page, see Understanding Switch Overview for SAN Fabrics.
SAN switches have only two roles, Core Router and Edge Router.
-
Choose an action from the Actions drop-down list to perform various actions based on the element you select in the topology.
-
To perform actions on the elements in the topology, other than those listed in the Actions drop-down list, right-click the element. This opens the appropriate pages and allows you to perform tasks based on the elements. For example, if you right-click a fabric, you can perform tasks such as various configurations, delete the fabric, rediscover the fabric, and many more.
Search Topology
Use a combination of search attributes and search criteria in the search bar for an effective search. As you enter a combination of search attribute and search criteria in the search bar, the corresponding devices are highlighted in the topology.
You can apply the search criteria such as equals (=), does not equal (!=), contains (contains), and does not contain (!contains).
The search attribute that you can use for SAN fabric is fabric name.
When a device displays on the topology, double-click it to navigate further into the topology. For example, when the fabric (cloud icon) you searched displays on the topology, double-click on the fabric to navigate inside its topology. Furthermore, after the fabric is displayed on the topology, you can continue to search based on a combination of criteria and various search attributes such as switch name, IP address, model, serial, software version, and up time.
Certain levels of the topology allow filters only; that is, filters take the place of Search. The topology listing for these levels displays a limited number of entities.
View Topology
To pan, click and hold anywhere in the whitespace and drag the cursor up, down, left, or right. To drag switches, click, hold, and move the cursor around the whitespace region of the topology.
In case of multiple switch selection, you must release the modifier keys (cmd/ctrl) before releasing the mouse to drag to end the switch selection.
You can view the following information for the devices and links in the View pane.
| Option | Description |
|---|---|
|
Layout Options |
You can zoom in, zoom out, or adjust the layout to fit the screen. You can also refresh the topology or save any changes to the topology. For more information, see Zoom, Pan, and Drag. |
|
Select Layout |
Choose the layout for your topology from this drop-down list, and click Save Topology Layout in the layout options. For more information, see Layouts. |
|
Status |
View the configuration status and operational status for SAN or LAN topologies. The status of every device or link is represented by different colors. For more information, see Status. |
|
Show Interfaces |
View all the interface nodes connected to a switch or a zone using the Show Interfaces option. For more information, see the Show Interfaces Option. |
View the topology for a node depending on the chosen scope. Each scope is shown in hierarchical order. An example hierarchy might be All fabrics > msd > fabric-name.
You can view these scopes.
-
Data Center
-
Cluster (vCenter)
-
Resource List (DVS, Compute, and VM)
-
Resource
-
On the Topology page, FEX appears in gray (Unknown or NA) because operation and configuration status is not calculated for FEX.
-
After moving a cable from one port to another port, the old fabric link is retained on the Topology page, and it displays in red, indicating that the link is down. Right-click on the link, and delete it if the removal was intentional. A manual rediscovery of the switch also deletes and recreates all the links to that switch.
When you deploy a VXLAN fabric group with child fabrics, to view the multi-fabric topology, double-click on a fabric node. Choose the MSD scope or double-click on the gray MSD node to view the MSD topology.
View elements in SAN topology
-
Navigate to Home > Topology.
-
Double-click on a fabric.
You can view a VSAN node and the connected switches in the topology diagram.
This section provides information about various elements or entities displayed on the Topology page for SAN fabrics.
VSAN
-
Double-click on a fabric to view the fabric topology.
A SAN fabric contains VSAN nodes and switches. The VSAN node has a number displayed in parens, which indicates the number of VSANs in the fabric.
The VSAN topology displays zones and switches connected to the VSAN.
You must have configured the VSAN and the links with VSAN membership to view the VSANs.
-
Single-click on the VSAN node to view a slide-in summary pane of the individual VSANs in the VSAN-node topology.
After the VSAN slide-in summary pane appears, you can search for VSAN attributes or by search criteria in the Search by Attributes field. For more information, see Search Topology.
-
Click any VSAN in the VSAN summary slide-in pane to display the VSAN.
You can view the grouping of the VSAN and any connected switches or zones in the topology diagram.
VSAN summary fields and descriptions Field Description Name
Specifies the name of the VLAN.
Id
Specifies the ID of the VLAN.
Status
Specifies the ID of the VLAN.
If you click the tooltip in the Status column, you can see the status of the switch and if the switch is a principal switch.
The pagination bar at the bottom of the VSAN summary slide-in pane displays the number of VSANs for the fabric.
Zone
-
Click on the VSAN node in the fabric topology diagram to display the VSAN summary slide-in pane.
-
Click on a VSAN node to display the Zone Devices summary slide-in pane where you can view the connected host and storage devices.
You can also view the grouping of the VSAN with the connected host and storage devices in the fabric topology diagram.
You can advance to the next page in the Zone Devices summary slide-in pane by clicking a zone name.
Hosts and storage
-
Single-click on a zone in the fabric topology diagram to view the Zones Devices summary slide-in pane where you can view the connected hosts and storage devices.
You can also view the grouping of hosts and storage devices in the fabric topology.
-
Click on a switch directly in the fabric topology to view a summary of the switch.
The switch topology displays the hosts and storage devices connected to the switch.
Hosts
-
Click on the host device to view more information about the host in the slide-in pane.
-
From the Zone Devices slide-in pane, you can click on a host to open the Host Overview dashboard.
-
You can also right-click on the host device and click the Detailed View to open the Host Overview dashboard.
Storage
-
Click on the storage device to view more information about the storage in the Zone Devices slide-in pane.
-
From the Zone Devices slide-in pane, you can open the Storage Overview dashboard.
-
You can right-click on the storage device and click the Detailed View to open the Storage Overview dashboard.
Links
In the switch topology, click on the link that connects two devices, for example, the switch and the storage to open the Link slide-in pane.
This slide-in pane displays the details related to the last polling of the performance data.
You must have configured performance monitoring for the fabric in Performance Data Collection Settings.
Performance monitoring allows the Nexus Dashboard to collect the traffic information and the aggregated information is displayed along with a graph showing traffic utilization. The Nexus Dashboard updates the last poll metric every five minutes for all the ports, links, and so on for all the switches in the fabric. If the date and time displayed in this slide-in pane is current, then the last poll metric details are up to date.
| Field | Description |
|---|---|
|
General Information |
Specifies general information such as link capacity, VSAN, and status. |
|
Information |
Specifies information about the traffic for the last 24 hours with details such as average, maximum, and minimum Rx and Tx in bytes. The slide-in panel includes the following poll metrics details:
Note that the table is paginated. |
Zoom, Pan, and Drag
You can zoom in and zoom out using the controls that are provided at the bottom left of the pages or by using your mouse’s wheel.
To pan, click and hold anywhere in the whitespace and drag the cursor up, down, left, or right.
To drag switches, click, hold, and move the cursor around the whitespace region of the topology.
Layouts
The topology supports different layouts along with a Save Layout option that remembers how you positioned your topology.
-
Hierarchical and Hierarchical Left-Right - Provide an architectural view of your topology. You can define various switch roles that will draw the nodes on how you configure your CLOS topology.
When running a large-scale setup, viewing all your switches on a leaf-tier can become difficult. To mitigate this issue, Nexus Dashboard splits your leaf-tier every 16 switches.
-
Circular and Tiered-Circular - Draw nodes in a circular or concentric circular pattern.
-
Random - Nodes are placed randomly on the page. Nexus Dashboard tries to make a guess and intelligently place nodes that belong together in close proximity.
-
Custom saved layout - Drag Nodes around according to your preference. After you position as required, click Save to retain the positions. The next time you come to the topology, Nexus Dashboard will draw the nodes based on your last saved layout positions.
Before a layout is chosen, Nexus Dashboard checks if a custom layout is applied. If a custom layout is applied, Nexus Dashboard uses this layout. If a custom layout is not applied, Nexus Dashboard checks if switches exist at different tiers, and chooses the Hierarchical layout or the Hierarchical Left-Right layout. Force-directed layout is chosen if all the other layouts fail.
Status
The color coding of each node and link corresponds to its state. The operational colors and what they indicate are described in the following list:
-
Green - Indicates that the element is in good health and functioning as intended.
-
Blue - Indicates that the element is in a warning state and requires attention to prevent any further problems.
-
Yellow - Indicates that the element has minor issues.
-
Orange - Indicates that the element has major issues and requires attention to prevent any further problems.
-
Red - Indicates that the element is in critical state and requires immediate attention.
-
Gray: Indicates lack of information to identify the element or the element has been discovered.
The configurational colors and what they indicate are described in the following list:
-
Green - Indicates that the element is element is In-Sync with the intended configuration.
-
Blue - Indicates that the element has pending deployments.
-
Yellow - Indicates that active deployments are in-progress.
-
Red - Indicates that the element is Out-of-Sync with the intended configuration.
-
Gray: Indicates lack of information or no support for Configuration Sync calculation.
NOTE:
-
On the Topology page, FEX appears in gray (Unknown or n/a) because the operation and configuration status is not calculated for FEX.
-
After moving a cable from one port to another port, the old fabric link is retained on the Topology page, and it is shown in red, indicating that the link is down. Right-click on the link and delete it if the removal was intentional. A manual rediscover of the switch will also delete and re-learn all the links to that switch.
-
Show Interfaces Option
-
Navigate to the Home > Topology page.
-
Click on Data Center.
The network topology diagram appears.
-
Double-click on a fabric within the network topology diagram.
A VSAN node with connected switches or zones appears in the network topology diagram.
-
Double-click on a switch or a zone.
The Show Interfaces toggle displays if the switch or the zone has a connected host or storage device.
-
Enable the Show Interfaces option to display all the interface nodes connected to the switch or the zone.
You can view all the interface nodes when viewing active zones or zones.
View Dashboards
Dashboards provide a centralized platform to gain insights into critical data and enable you to efficiently monitor the Nexus Dashboard. You can create custom dashboards and add widgets to display top-level information about each widget pinned to the dashboard.
To view dashboards, navigate to Home > Dashboards.
The Dashboards home page displays the following information.
| Field | Description |
|---|---|
|
Title |
Displays the name of the dashboard. |
|
Visibility |
Specifies if the custom dashboard is shared or private. |
|
Created By |
Allows you to view who created the dashboard. |
|
Last Updated |
Allows you to view when the dashboard was last updated. |
Create a new dashboard
Follow these steps to create a new dashboard.
-
Navigate to Dashboards.
Go to Home > Dashboards.
-
If there are no dashboards, click New dashboard.
If you have existing dashboards, from the Actions drop-down list, choose New dashboard.
The New Dashboard page displays.
-
Choose one of the following options.
-
Choose Start with a pre-built template to use an existing dashboard template to create your dashboard. You can add or remove widgets to customize later.
-
Choose Start with a blank dashboard to create a custom dashboard from scratch.
The New Dashboard page also displays the Most Popular template, that includes common widgets.
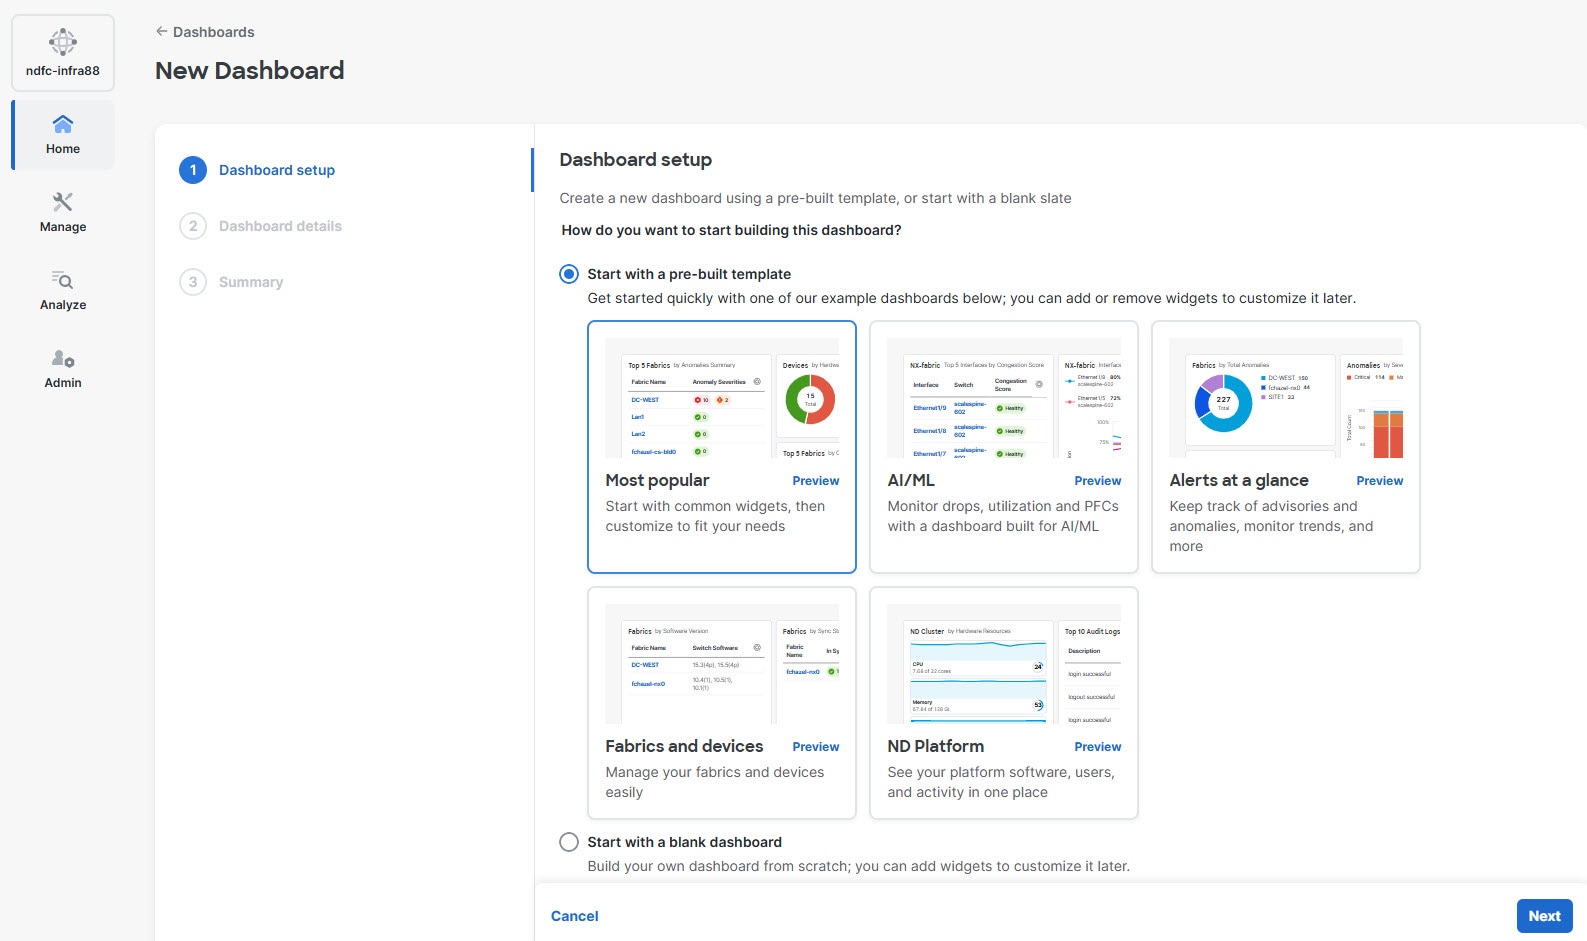
-
-
Click Next.
The Dashboard details page displays.
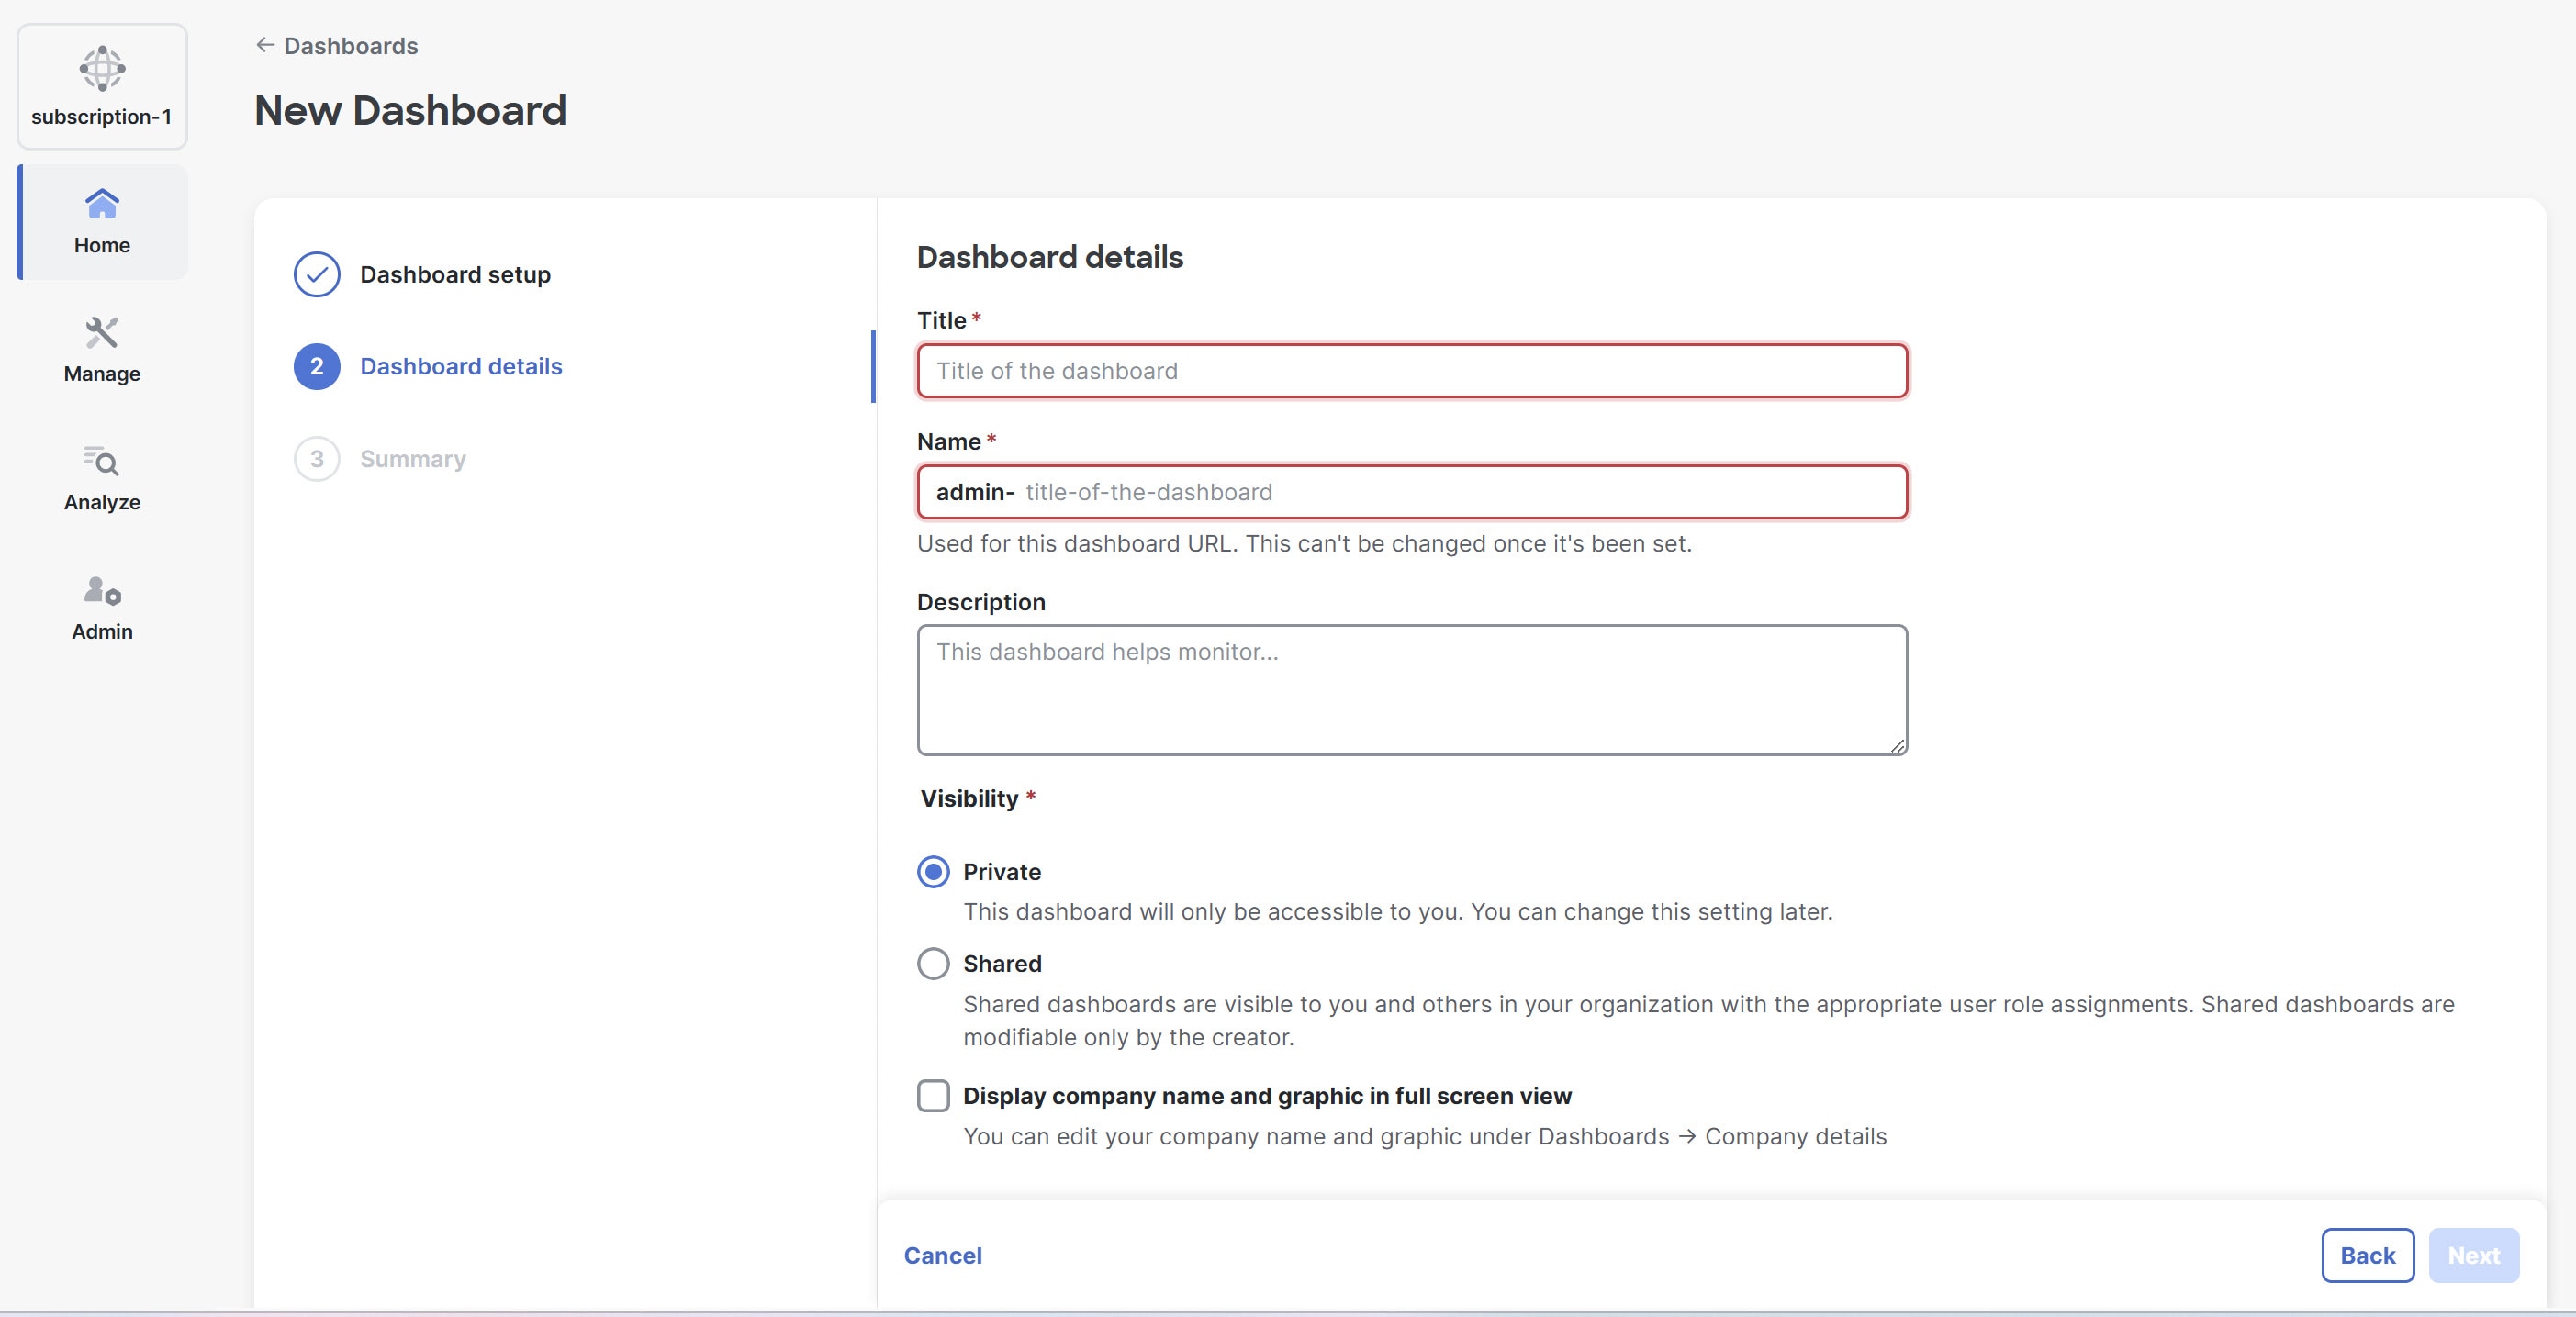
-
In the Title field, provide the title for the dashboard.
-
In the Name field, enter the name of the dashboard.
The name of the dashboard is unique and in the format,
<user name>-name-of-the-dashboard. Note that the <user name> prefix is fixed and automatically prepended by the UI. -
In the Description field, provide a brief description of the dashboard.
-
Choose one of the following visibility types.
-
Private — The dashboard is accessible only to you. You can share it with selected individuals within your organization.
-
Shared — The dashboard is visible and accessible to all users in your organization with appropriate user role assignments, but only you can modify the settings.
When you share a dashboard, other users can access only the data for the fabrics they have permission to view. Widgets scoped to specific fabrics will appear unavailable to users without access to those fabrics. A super-admin can view, modify, and delete any dashboard.
-
-
Check the Display company name and graphic in full screen view check box, if you want to display the company name in full screen mode.
The full screen mode displays the company name and logo. In the full screen mode the left navigation pane and top heading bar are hidden to maximize the screen space.
For more information, see Modify the dashboard and Customize company details.
-
Click Next.
You can view the summary of the dashboard that you created.
-
Click Save to save your dashboard.
A confirmation message appears that your new dashboard was created successfully and is ready to customize.
-
Click Open Dashboard to view and customize your dashboard.
You can create multiple dashboards. The user who creates a dashboard can modify or delete it, except for the super-admin user role.
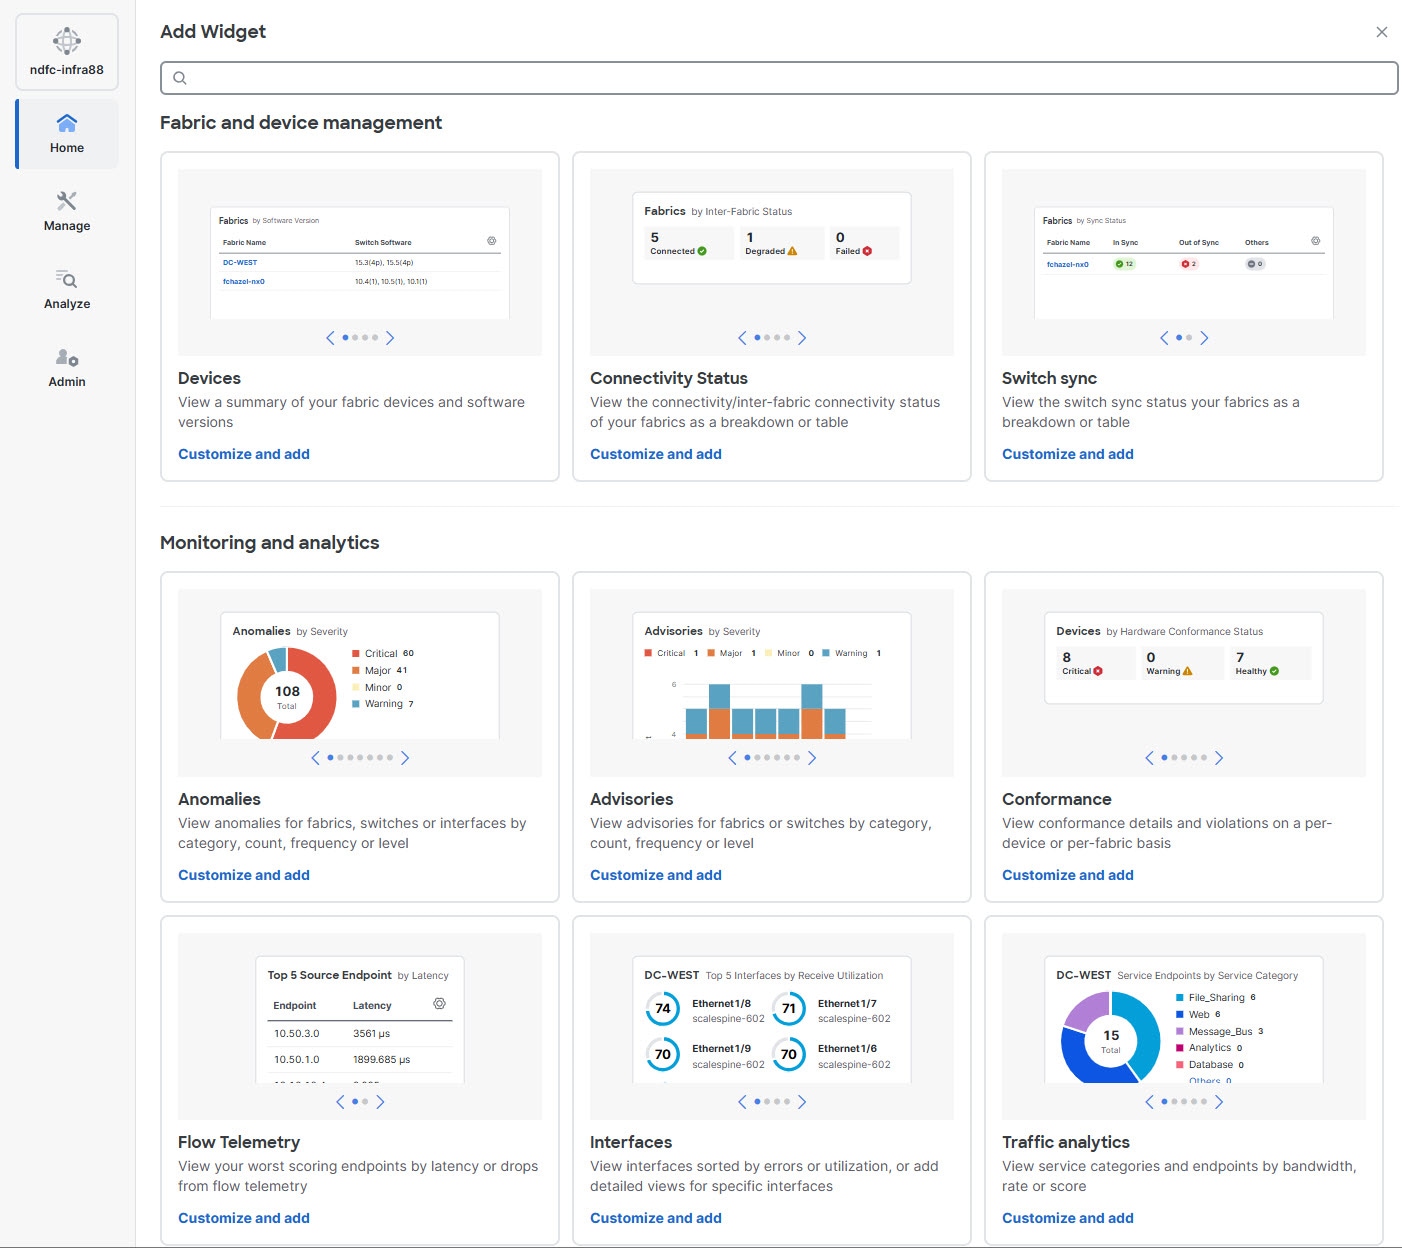
Add widgets to a dashboard
A dashboard is a collection of multiple widgets. You can customize your dashboard by adding widgets that provide summary of specific features within the Nexus Dashboard. You can add, remove, and re-organize widgets on the dashboard.
Follow these steps to add widgets to your dashboard.
-
Navigate to Dashboards.
Go to Home > Dashboards.
-
Choose the dashboard that to which you want to add the widget.
-
In the Dashboard page, click Add widget.
-
In the Add Widget page, explore the available widgets categorized as follows:
-
Fabric and device management
-
Monitoring and analytics
-
Platform
-
Energy management
-
Users and activity
You can add up to 20 widgets to your dashboard.
-
-
Choose the widget that you want to add and click Customize and add.
-
In the Widget page, you can customize the widget settings based on these parameters.
-
Data source
Allows you to customize the data source parameters based on the widget type you choose.
For more information see Understand data source parameters.
The parameters that you can customize under the Data source fields vary based on the widget type you choose.
-
Appearance
Allows you to choose how you want your widget to be displayed. The following options are available in the Visualization Type drop-down list.
-
Breakdown
-
Count
-
Donut
-
Table
-
Utilization
-
Metric Group
-
Line Chart
-
Bar Chart
-
Status Summary
-
-
A preview of the widget will appear at the top of the Widget page based on the Visualization Type you choose. The options under the Visualization Type drop-down list vary depending on the widget type.
Understand data source parameters
Data source selections consist of four main components.
-
Source — Allows you to define the type of data the widget displays. If the widget supports only one data type, this field remains hidden.
For example, in the Anomalies widget, the Source field allows you to choose Anomalies to view anomalies or Fabrics to view the fabrics.
-
Scope — Enables you to refine data to display. The widgets support a subset or all of the following scopes.
-
All Fabrics — Displays the data for all fabrics accessible to the user
-
Fabric — Displays the data for a specific fabric.
-
Switch — Displays the data for a specific switch.
-
Interface — Displays the data for a specific interface.
-
-
Fabric Name — Allows you to choose a fabric.
-
By — Allows you to specify how the data is sorted within the widget.
The Source and Scope fields appear depending on the widget you choose, and Fabric Name, Switch, and Interface fields appear depending on the Scope you choose. The By field is present for all the widgets.
Modify the dashboard
The user who creates a dashboard can modify or delete it. Any user can view a shared dashboard, but only in read-only mode.
Follow these steps to modify the dashboard.
-
Navigate to Dashboards.
Go to Home > Dashboards.
-
Choose the dashboard that you want to modify.
-
In the Dashboard page, click Settings.
The Dashboard Settings dialog box displays. You can modify your dashboard settings or delete the dashboard.
You can also delete your dashboard from the Dashboards home page. To delete a dashboard, from the Actions drop-down list, choose Delete dashboard.
-
Click Edit Layout, if you wish to rearrange or resize your widgets.
Click Save layout to save the changes.
-
Click Full screen, to view the dashboard in full screen mode.
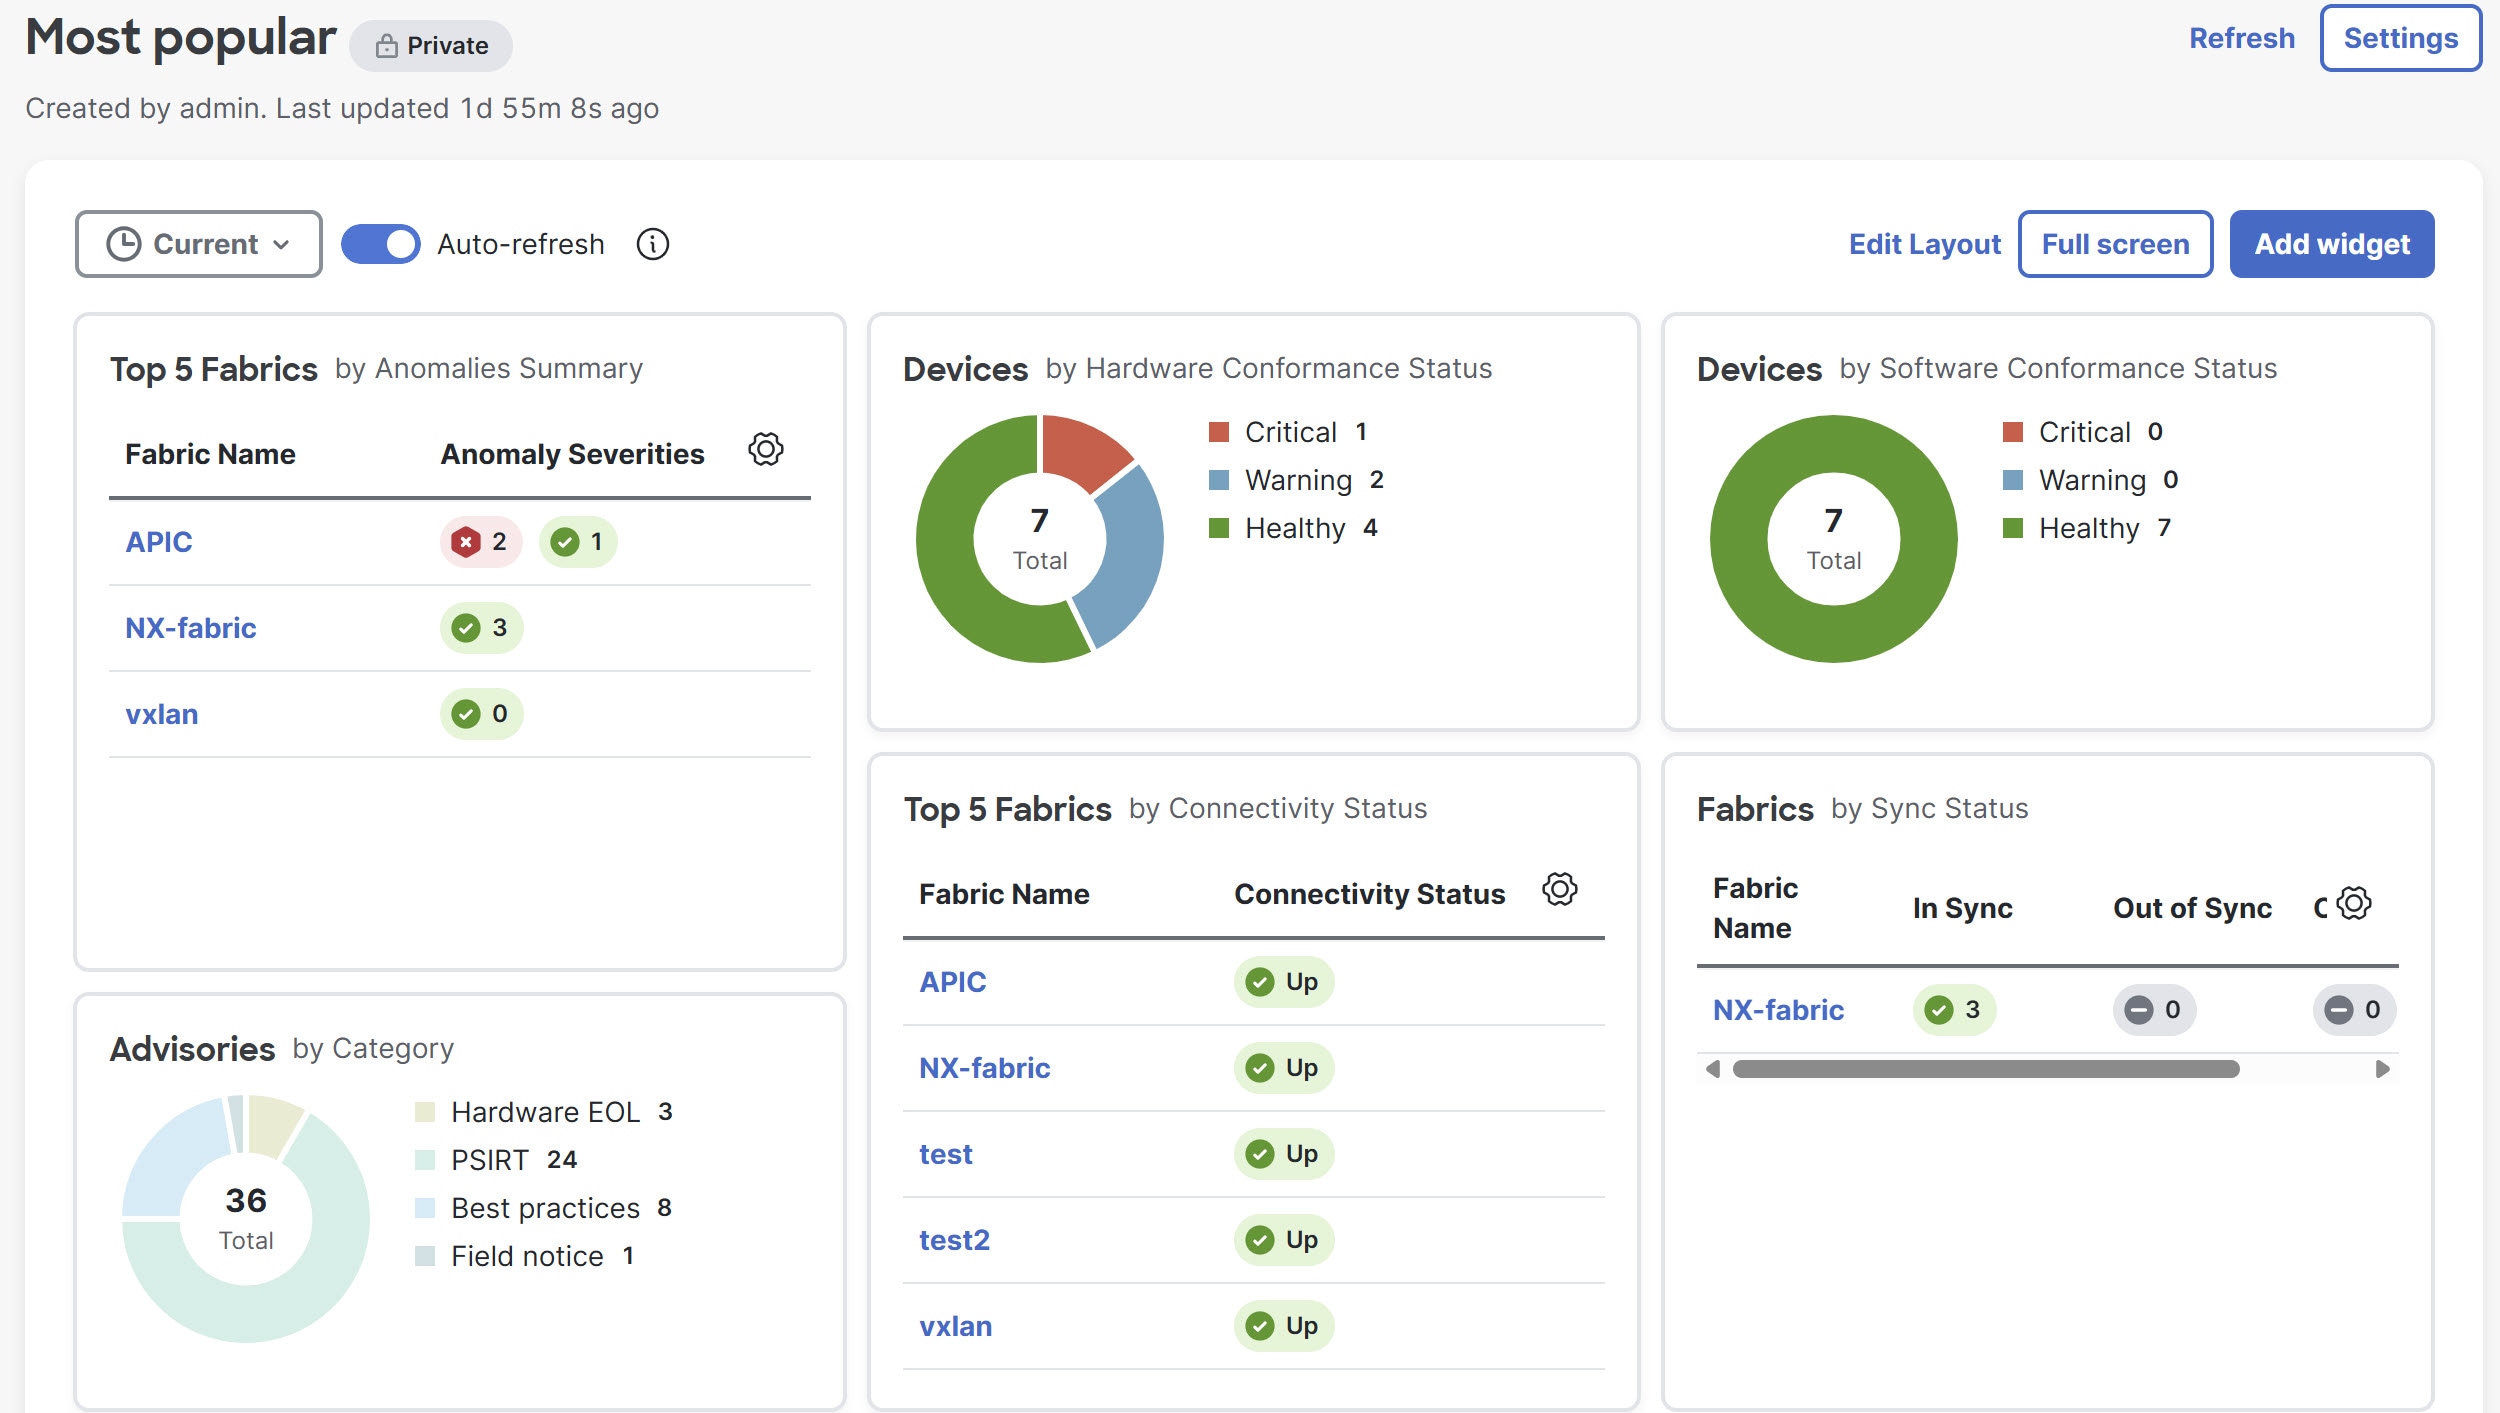
The full screen mode displays the company name and logo. In the full screen mode the left navigation pane and top heading bar are hidden to maximize the screen space. Click Exit full screen to leave full screen mode.
-
Click Add widget to add additional widgets to your dashboard.
-
Go to Current > Time Selection, to choose the date and time range.
By default, Current is chosen. You can customize the date and time range to determine the data displayed across all the widgets.
-
Toggle Auto-refresh on to automatically refresh your widgets periodically.
Each widget may have a different refresh rate. For details about the refresh rate of a specific widget, hover over the Clock icon on the widget.
-
Click the Settings icon located at the top right of each widget to edit the widget settings.
-
Click on a widget to access the main feature page associated with that widget.
Customize company details
You can edit the company details of your dashboard from the Dashboards home page.
Follow these steps to edit the company details.
-
Navigate to Dashboards.
Go to Home > Dashboards.
-
In the Actions drop-down list, choose Company details.
-
In the Company name field, provide the company name.
-
In the Company graphic field, upload the company logo.
Supported image formats include *.png, *.jpeg, or *.svg. If you upload an image with a height exceeding 32 pixels, Nexus Dashboard automatically scaled it down to 32 pixels. The image file size should not exceed 256 KB.

After you provide the company name and logo, Nexus Dashboard generates a custom-branded dashboard for full-screen viewing. If you do not provide these details, the dashboard will display only the Cisco logo.
Copyright
THE SPECIFICATIONS AND INFORMATION REGARDING THE PRODUCTS IN THIS MANUAL ARE SUBJECT TO CHANGE WITHOUT NOTICE. ALL STATEMENTS, INFORMATION, AND RECOMMENDATIONS IN THIS MANUAL ARE BELIEVED TO BE ACCURATE BUT ARE PRESENTED WITHOUT WARRANTY OF ANY KIND, EXPRESS OR IMPLIED. USERS MUST TAKE FULL RESPONSIBILITY FOR THEIR APPLICATION OF ANY PRODUCTS.
THE SOFTWARE LICENSE AND LIMITED WARRANTY FOR THE ACCOMPANYING PRODUCT ARE SET FORTH IN THE INFORMATION PACKET THAT SHIPPED WITH THE PRODUCT AND ARE INCORPORATED HEREIN BY THIS REFERENCE. IF YOU ARE UNABLE TO LOCATE THE SOFTWARE LICENSE OR LIMITED WARRANTY, CONTACT YOUR CISCO REPRESENTATIVE FOR A COPY.
The Cisco implementation of TCP header compression is an adaptation of a program developed by the University of California, Berkeley (UCB) as part of UCB’s public domain version of the UNIX operating system. All rights reserved. Copyright © 1981, Regents of the University of California.
NOTWITHSTANDING ANY OTHER WARRANTY HEREIN, ALL DOCUMENT FILES AND SOFTWARE OF THESE SUPPLIERS ARE PROVIDED “AS IS" WITH ALL FAULTS. CISCO AND THE ABOVE-NAMED SUPPLIERS DISCLAIM ALL WARRANTIES, EXPRESSED OR IMPLIED, INCLUDING, WITHOUT LIMITATION, THOSE OF MERCHANTABILITY, FITNESS FOR A PARTICULAR PURPOSE AND NONINFRINGEMENT OR ARISING FROM A COURSE OF DEALING, USAGE, OR TRADE PRACTICE.
IN NO EVENT SHALL CISCO OR ITS SUPPLIERS BE LIABLE FOR ANY INDIRECT, SPECIAL, CONSEQUENTIAL, OR INCIDENTAL DAMAGES, INCLUDING, WITHOUT LIMITATION, LOST PROFITS OR LOSS OR DAMAGE TO DATA ARISING OUT OF THE USE OR INABILITY TO USE THIS MANUAL, EVEN IF CISCO OR ITS SUPPLIERS HAVE BEEN ADVISED OF THE POSSIBILITY OF SUCH DAMAGES.
Any Internet Protocol (IP) addresses and phone numbers used in this document are not intended to be actual addresses and phone numbers. Any examples, command display output, network topology diagrams, and other figures included in the document are shown for illustrative purposes only. Any use of actual IP addresses or phone numbers in illustrative content is unintentional and coincidental.
The documentation set for this product strives to use bias-free language. For the purposes of this documentation set, bias-free is defined as language that does not imply discrimination based on age, disability, gender, racial identity, ethnic identity, sexual orientation, socioeconomic status, and intersectionality. Exceptions may be present in the documentation due to language that is hardcoded in the user interfaces of the product software, language used based on RFP documentation, or language that is used by a referenced third-party product.
Cisco and the Cisco logo are trademarks or registered trademarks of Cisco and/or its affiliates in the U.S. and other countries. To view a list of Cisco trademarks, go to this URL: https://www.cisco.com/go/trademarks. Third-party trademarks mentioned are the property of their respective owners. The use of the word partner does not imply a partnership relationship between Cisco and any other company. (1110R)
© 2017-2026 Cisco Systems, Inc. All rights reserved.
Americas Headquarters
Cisco Systems, Inc.
170 West Tasman Drive
San Jose, CA 95134-1706
USA
https://www.cisco.com
Tel: 408 526-4000
800 553-NETS (6387)
Fax: 408 527-0883