
New and changed information
The following table provides an overview of the significant changes up to this current release. The table does not provide an exhaustive list of all changes or of the new features up to this release.
| Release Version | Feature | Description |
|---|---|---|
|
Nexus Dashboard 4.1.1 |
Improved reports navigation and workflow |
Beginning with Nexus Dashboard 4.1.1, the navigation and workflow when creating reports in Nexus Dashboard LAN fabrics have been enhanced. |
Understanding programmable reports
The Reports area in Nexus Dashboard allows you to generate reports using Python 2.7 scripts. Report jobs are run to generate reports. Each report job can generate multiple reports. You can schedule a report to run for a specific device or fabric. These reports are analyzed to obtain detailed information about the devices.
The report template type is used to support the programmable reports feature. This template has two template subtypes: UPGRADE and GENERIC. For more information on the report template, see the "Report Template" section in the Managing Your Template Library article. A python SDK is provided to simplify report generation. This SDK is bundled with Nexus Dashboard Fabric Controller.
RBAC Support
-
An admin or a network operator can create a report.
-
A network operator can view reports created by other admins and operators.
-
A network operator cannot delete/edit/rerun any reports created by an admin and other network operators.
-
An admin can view and delete any report irrespective of the user creating them.
-
Due to fabric and device association, an admin cannot edit any report created by another user, including the network operator.

A Jython template supports a maximum file size of 100k bytes. In case any report template exceeds this size, Jython execution may fail.
Understanding programmable reports for performance monitoring
Support is available for several programmable reports, such as switch inventory, ISSU pre-upgrade, post-upgrade checks, fabric resources, and so on. For example, a switch performance monitoring programmable report is available to monitor CPU, memory, traffic, and interface utilization. Programmable reports for switch performance monitoring can be enabled for a specific switch (at the device level).
You can also use email as an out-of-band notification method to receive the programmable reports externally using the periodic programmable report generation. This allows you to receive periodic information about your data center fabric health, utilization, and performance state, and the statistics.
Navigate to Analyze > Reports to display the latest reports across all report definitions, at both the fabric level and the device level.
Prerequisites
Complete the following prerequisites before enabling performance monitoring using programmable reports:
-
Enable the Performance Monitoring option at the LAN fabric level:
-
Navigate to Manage > Fabrics.
The Fabrics page is displayed, with all of your configured fabrics listed.
-
Single-click the LAN fabric that you want to monitor.
The Overview page for this fabric is displayed.
-
Click Actions > Edit Fabric Settings.
The Edit fabric-name Settings page is displayed.
-
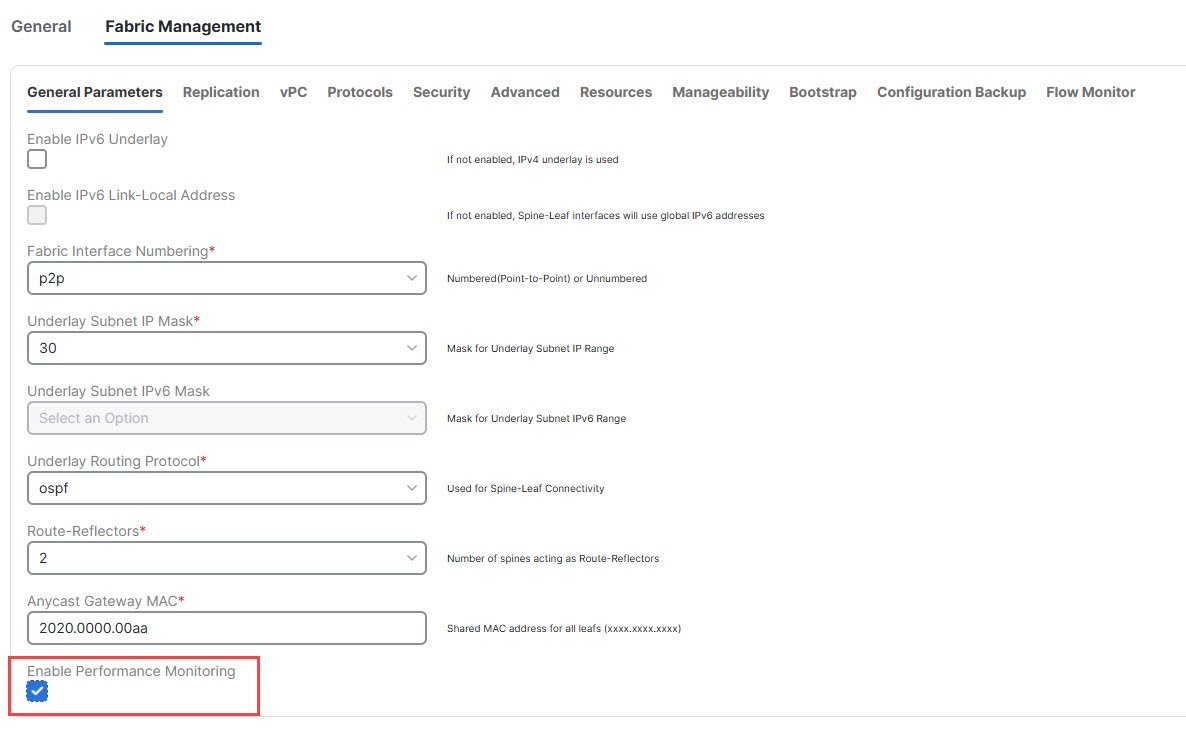
In the Fabric Management > General Parameters tab, click the box under the Enable Performance Monitoring option to enable this feature.
-
Click Save.
-
-
If you want to enable email notifications, update the SMTP host information in Admin > System Settings > General > Email.
Guidelines and limitations
Following are the guidelines and limitations for performance monitoring using programmable reports in Nexus Dashboard:
-
Only NX-OS switches are supported for switch performance monitoring using programmable reports in Nexus Dashboard.
-
Prior to Nexus Dashboard release 4.1.1, the number of backup days for the CPU/memory performance monitoring data was 90 days. Beginning with Nexus Dashboard release 4.1.1, that number has been reduced to 30 days.
Configure programmable reports
Complete all the tasks described in Prerequisites before proceeding with these procedures.
-
Navigate to Analyze > Reports.
The Reports page is displayed, with any configured report definitions displayed.
-
Click Create Report.
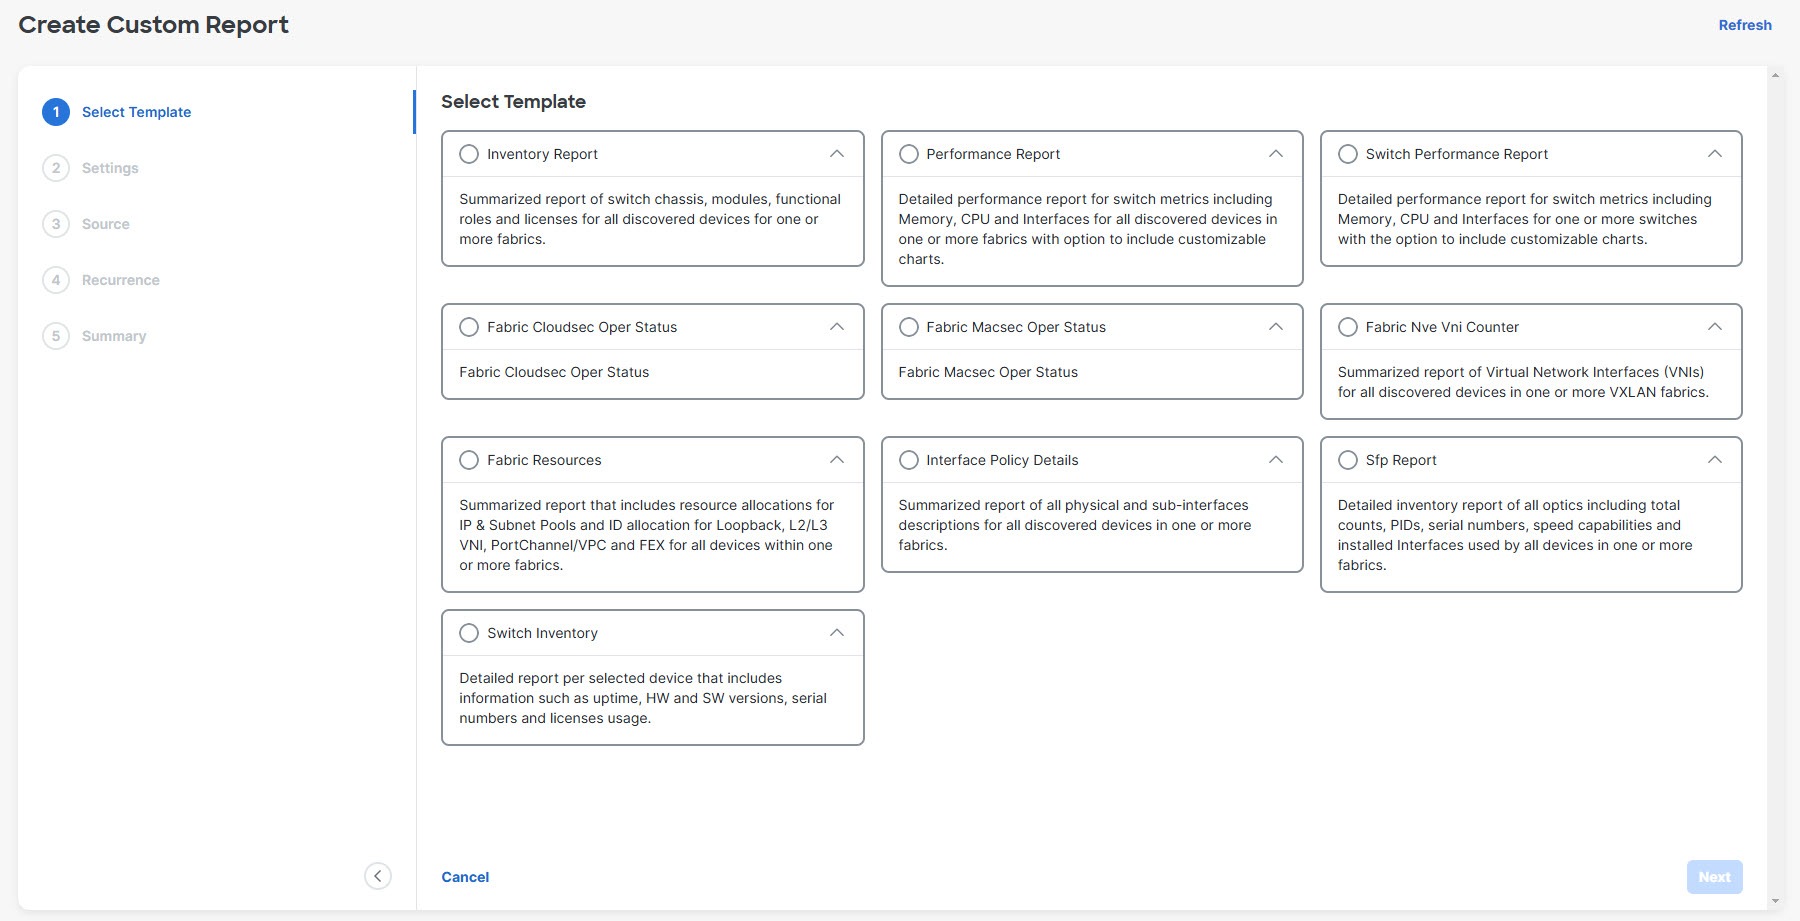
The Create Custom Report page is displayed.
-
Choose the report template that you want to use.
You have the following report templates to choose from:
-
Inventory Report: Choose this report template to monitor the inventory for a specific fabric or a set of fabrics, such as the number of switches that you have in that fabric. -
Performance Report: Choose this report template to monitor the CPU, memory, traffic, or interface utilization for a fabric and all the switches within that fabric. -
Switch Performance Report: Choose this report template to monitor CPU, memory, traffic, or interface utilization for a specific switch in a fabric. -
Fabric Cloudsec Oper Status: Choose this report template to monitor the operational status related to CloudSec. For example, if you enable a security mechanism using CloudSec on top of the external multi-site, then you can see the counters of the traffic that is going between the multi-site border gateways that is encrypted using CloudSec. -
Fabric Macsec Oper Status: Choose this report template to monitor the operational status related to MACsec encryption at the Layer 2 level. -
Fabric Nve Vni Counter: Choose this report template to collect the show nve vni counters command output for each VNI in the fabric. This is essentially the VXLAN NVE terminal interface. Whenever there is an encap/decap on a specific Nexus 9000 VTEP, it uses this report to capture the traffic that is coming on that NVE interface. -
Fabric Resources: Choose this report template to display information about resource usage for a specific fabric. It allows you to monitor the number of resources that you have in a given fabric. For example, you might use this report to determine how many IP subnet pools that you have for loopback 0 and loopback 1. -
Interface Policy Details: Choose this report template to display device information and interface details, such as interface descriptions. You can select a particular fabric or group of fabrics, and all devices across these fabrics will be shown under this report. -
Sfp Report: Choose this report to gather information about utilization of SFPs at a fabric and device level. Use this report template to determine the SFP that is attached to a port, the name of that SFP, and the speed of the transceiver. -
Switch Inventory: Choose this report to get a summary about the switch inventory.
Inventory Report,Performance Report, andSwitch Performance Reportreport templates are used for performance management reports. -
-
Click Next to select the template and move on to the next step of the Create Custom Report workflow.
-
Enter the name for the report in the Report Name field, then edit the parameters in the report template page to customize the report, if necessary.
The parameters that are available vary, depending on the type of report template you selected in the previous step. The following table provides additional information on the parameters that are available for each report template.
The following report templates do not have editable parameters and are therefore not included in the following table:
-
Fabric Cloudsec Oper Status -
Fabric Macsec Oper Status -
Fabric Nve Vni Counter -
Fabric Resources -
Sfp Report -
Switch InventoryParameters
Description
Inventory Report
Include Modules
Determine if you want to include modules if they are associated with the switch. Choices:
-
true
-
false
Include Licenses
Determine if you want to include licenses if they are associated with the switch. Choices:
-
true
-
false
Performance Report
Top records to Chart
Choose the number of top records to chart.
Max Number of Rows to show per Table
Choose the maximum number of rows to show per table.
Include CPU
Determine if you want to include CPU statistics in the performance report. Choices:
-
true
-
false
Include Memory
Determine if you want to include menory statistics in the performance report. Choices:
-
true
-
false
Include Links
Determine if you want to include links statistics in the performance report. Choices:
-
true
-
false
Include Other Ports
Determine if you want to include other ports statistics in the performance report. Choices:
-
true
-
false
Switch Performance Report
Include CPU
Determine if you want to include CPU statistics in the switch performance report. Choices:
-
true
-
false
Include Memory
Determine if you want to include menory statistics in the switch performance report. Choices:
-
true
-
false
Include Other Ports
Determine if you want to include other ports statistics in the switch performance report. Choices:
-
true
-
false
Top records to Chart
Choose the number of top records to chart.
Interface Policy Details
Switch serial number
Enter the serial number for the switch.
Inteface name filter
Filter based on the interface name (for example,
ethernet,port-channel, and so on). Regex is not supported. -
-
-
Click Next to move to the Source step.
-
Select the fabrics or devices where you want to generate the performance monitoring report.
-
Certain reports are generated at the fabric level, such as the
Inventory ReportandFabric Resourcesreports; for those reports, select the fabrics where you want to generate the performance monitoring report. You can select a single fabric or multiple fabrics in this area; any fabrics that you select will be captured in the generated report.Note that VXLAN fabric groups are displayed in this page in the following manner:
-
The parent fabric for the VXLAN fabric groups will be displayed as a single entry, with
Fabric Groupshown as the entry in the Fabric Type column. If you select a VXLAN fabric group type of fabric, both the parent and the child fabrics within that fabric group will be captured in the generated report. -
The child fabric for the VXLAN fabric group will be displayed as two entries separated by a slash (/), where the parent fabric is shown first and the child fabric is shown second, after the slash.
-
-
Other reports are generated at the device (switch) level, such as the
Switch Performance ReportandSwitch Inventoryreports; for those reports, select the devices (switches) where you want to generate the performance monitoring report. You can select a single device or multiple devices in this area; any devices that you select will be captured in the generated report. You can select a single device or multiple devices in this area; any devices that you select will be captured in the generated report. Use the filter field to show only devices within a specific fabric to select all the devices in a specific fabric:Fabric == fabric_name
-
-
Click Next to move to the Recurrence step.
-
Enter the necessary information in the Recurrence page.
-
If you have email notifications enabled, in the Email Report To field, enter an email ID or mailer ID if you want the report in an email.
Note that the title of the report that you receive in your email will include the time in a different format than the format that is shown under the Reports tab.
As described in Prerequisites, you must configure the SMTP settings in Admin > System Settings > General > Email. If the data service IP address is in a private subnet, the static management route for the SMTP server must be added in the Nexus Dashboard cluster configuration.
-
Choose the frequency at which the report job should be run.
The following table shows the options available and their description.
Available Option Description Now
The report is generated now.
Daily
The report is generated daily at a specified time between the Start Date and End Date that you provide.
Weekly
The report is generated once a week at a specified time between the Start Date and End Date that you provide.
Monthly
The report is generated once a month at a specified time between the Start Date and End Date that you provide.
Periodically
The report is generated periodically in a time period between the specified Start Date and End Date that you provide. The interval of time between the reports can be specified in minutes or hours.
-
-
Click Next.
You advance to the Summary page.
-
Verify that the information provided in the Summary page is correct, then click Save.
You are returned to the main Reports page. A new report and report definitions are created and appear on the Reports and Report Settings tabs, and the report that you just created begins to run in the background.
-
Review the information provided in the Report Settings tab.
The status for the new report shows as
RUNNINGin the Status column at first. Click the refresh icon or wait for a moment, then the status will change toSUCCESS.You can also view other information on the new report in the Report Settings tab, such as the report template used for each report, the user who generated the report, and the recurrence setting for each report.
-
Click the Reports tab.
Information is provided for each programmable report that you configured, including the type of template used for each report, who created the report, and what the recurrence is for each report.
-
To download a report, click the box next to the report, then click Actions > Download.
-
To compare two reports, click the boxes next to the reports that you want to compare, then click Actions > Compare (2 Reports).
-
-
In the Reports tab, double-click on the report that you just created.
The overview information for the report is displayed, with additional information provided under these two tabs:
-
Details: Provides detailed information on this programmable report, with additional details available in expandable areas that are specific to each type of programmable report.
For example, specifically for an
Inventory Reportprogrammable report, additional information is available underneath each of the following expandable areas:-
Summary: Provides general overview information, such as the number of chassis (switches), what version of NX-OS operation system is running on each switch, and the roles that are assigned to each switch within the selected fabric.
-
Chassis: Provides information on the chassis (switches) within the selected fabric.
-
Modules: For modular switches, provides information on the modules in each chassis (switch) within the selected fabric.
-
Switch Licenses: Provides license information on each switch within the selected fabric.
-
ND Licenses: Provides NDFC license information for a selected fabric.
-
-
Commands: Provides information on executed commands, if available.
-
-
If you enabled email notifications in Step 9, open the email that contains detailed information from the programmable report.
For example, if you enabled email notifications for a
Performance Reportprogrammable report, the emailed report will show performance information for a particular fabric and the switches within that fabric, such as:-
The top five CPUs in the last day
-
The top five memory and CPU utilization in the last day
-
The top five links and interfaces utilization in the last day
For this type of programmable report, in each area, you can click on multiple components within that area to get comparison information for those components, such as clicking on two links to compare information between those two links.
-
Example use case: Configure programmable report for switch performance monitoring
Complete all the tasks described in Prerequisites before proceeding with these procedures.
This section provides an example use case based on the procedures provided in Configure programmable reports. In this example use case, you will be configuring a programmable report specifically for switch performance monitoring.
-
Navigate to Analyze > Reports.
The Reports page is displayed, with any configured report definitions displayed.
-
Click Create Report.
The Create Custom Report page is displayed.
-
Choose the
Switch Performance Reporttemplate to use for this use case.You would choose this report template to monitor CPU, memory, traffic, or interface utilization for a specific switch in a fabric.
-
Click Next to select the template and move on to the next step of the Create Custom Report workflow.
-
Enter the name for the report in the Report Name field.
For this example use case, we will use the name
PM-VXLANfor this programmable report for switch performance monitoring. -
Edit the parameters in the report template page to customize the report.
Parameters
Description
Include CPU
Determine if you want to include CPU statistics in the switch performance report. Choices:
-
true
-
false
Include Memory
Determine if you want to include menory statistics in the switch performance report. Choices:
-
true
-
false
Include Other Ports
Determine if you want to include other ports statistics in the switch performance report. Choices:
-
true
-
false
Top records to Chart
Choose the number of top records to chart.
-
-
Click Next to move to the Source step.
-
Select the devices where you want to generate the performance monitoring report.
As described in Configure programmable reports, certain reports, such as the
Switch Performance Report, are generated at the device (switch) level, so you will select the devices where you want to generate the performance monitoring report in this page. You can select a single device or multiple devices in this area; any devices that you select will be captured in the generated report.You can also use the string
Fabric == fabric_namein the filter field to show only devices within a specific fabric to select all the devices in a specific fabric. -
Click Next to move to the Recurrence step.
-
If you have email notifications enabled, in the Email Report To field, enter an email ID or mailer ID if you want the report in an email.
As described in Prerequisites, you must configure the SMTP settings in Admin > System Settings > General > Email. If the data service IP address is in a private subnet, the static management route for the SMTP server must be added in the Cisco Nexus Dashboard cluster configuration.
-
In the Recurrence field, choose the frequency at which the report job should be run.
The following table shows the options available and their description.
Available Option Description Now
The report is generated now.
Daily
The report is generated daily at a specified time between the Start Date and End Date that you provide.
Weekly
The report is generated once a week at a specified time between the Start Date and End Date that you provide.
Monthly
The report is generated once a month at a specified time between the Start Date and End Date that you provide.
Periodically
The report is generated periodically in a time period between the specified Start Date and End Date that you provide. The interval of time between the reports can be specified in minutes or hours.
-
Click Next.
You advance to the Summary page.
-
Verify that the information provided in the Summary page is correct, then click Save.
You are returned to the main Reports page. A new report and report definitions are created and appear on the Report Settings and Reports tabs, and the report that you just created begins to run in the background.
-
Review the information provided in the Report Settings tab.
The status for the new report shows as
RUNNINGin the Status column at first. Click the refresh icon or wait for a moment, then the status will change toSUCCESS.You can also view other information on the new report in the Report Settings tab, such as the report template used for each report, the user who generated the report, and the recurrence setting for each report.
-
Click the Reports tab, then double-click on the report that you just created.
The overview information for the report is displayed, with additional information provided under these two tabs:
-
Details
-
Commands
-
-
Click the Details tab, if it’s not selected by default already, and expand on any area to get more information on this report.
For example:
-
Expand the Summary line to get information on all of the fabric’s switches from the CPU, memory, and traffic utilization points of view. Click on specific devices to get more information on those specific devices, or click on more than one device to compare information between those devices.
-
Expand the Performance-cpu line to get average and peak CPU performance information for the switches in the fabric.
-
Expand the Performance-memory line to get average and peak memory performance information for the switches in the fabric.
-
Expand the Links line to get link utilization information between devices, such as how a port on one switch is connected to a port on another switch, and the average transmit and receive time for the traffic between those ports. You can also see if there are any potential errors or discards between the links.
-
Expand the Performance-ethernet line to information about a switch’s speeds and traffic utilization, and if there are any errors on a particular ethernet port.
-
-
If you enabled email notifications in Step 10, open the email that contains the programmable report for switch performance monitoring.
The emailed report will show performance information for a particular fabric and the switches within that fabric, such as:
-
The top five CPUs in the last day
-
The top five memory and CPU utilization in the last day
-
The top five links and interfaces utilization in the last day
In each area, click on multiple components within that area to get comparison information for those components. For example, click on two links to compare information between those two links.
-