Get Started

Log in to Catalyst Center Global Manager and run it

After you have deployed and configured the Catalyst Center Global Manager virtual appliance, you can log in to its GUI. Use a compatible, HTTPS-enabled browser when accessing Catalyst Center Global Manager.

Follow these steps to log in and access Catalyst Center Global Manager:

Procedure


Step 1

Access the Catalyst Center Global Manager GUI by entering HTTPS:// URL and the IP address of the Catalyst Center Global Manager GUI displayed at the end of the configuration process.

The Catalyst Center Global Manager login page appears.

Note


It is recommended to use a private or incognito browser window when accessing the GUI. Ensure that you are using a supported browser. For more information on "supported browsers" and "screen resolution", see the Deployment requirements section.

Step 2

Log in to Catalyst Center Global Manager using the default username and password you configured for the new admin user.

  • In the Username field, type admin

  • In the Password field, type P@ssword9

Note


These are the default login credentials to access the GUI for the first time. The system deletes them after you create a new user account in step 3.

Step 3

Create a new user account for Catalyst Center Global Manager after the password is authenticated.

  • Catalyst Center Global Manager logs you out. Log back in using the newly created user account.

  • Each of the controllers managed by Catalyst Center Global Manager should have an identical user account created on it.

Step 4

Click Log In after creating the Catalyst Center Global Manager account to complete the first-time set up.

The Terms and Conditions window appears, providing links to the Cisco General Terms (formerly known as End User License Agreement (EULA)) and any supplemental terms that are currently available.

Step 5

Click Next to accept the terms and conditions.

The Login to Cisco.com window appears.

Ensure that you:

  • use the valid cisco.com user id for completing the registration workflow.

  • enable the pop-ups for the page in the browser.

Step 6

Click Next.

The Activate your device window appears.

Step 7

Click Next to get the activation code and activate the Catalyst Center Global Manager to Cisco Catalyst Cloud.

The Device activated window appears.

Then the Registration to Catalyst cloud completed window appears.

After you have logged in successfully, the screen will show the registration status between the Catalyst Center Global Manager and the Cisco Catalyst Cloud.

Note


If you cannot log in, a failure message appears indicating that registration with Cisco Catalyst Cloud could not be completed due to an authentication issue. In this case, wait a few minutes and sign in again, or check your browser pop-up settings.

Step 8

Click Launch the Global Manager to enter the Catalyst Center Global Manager GUI dashboard for the first time.

You will be redirected to the Overview page in Catalyst Center Global Manager, with instructions to enroll the Catalyst Center controller.

Note

 
  • The menu displays only a few options, such as Overview, Activities, and System, when there are no controllers enrolled on day-0 or after all controllers are deleted on day-n.

  • The Overview page displays a standard message regarding controller registration.


Enroll Catalyst Center to Catalyst Center Global Manager

To register Catalyst Center with Catalyst Center Global Manager, it's necessary to integrate Catalyst Center with the Cisco Catalyst Cloud. Log in to Catalyst Center to start the process.

Note


The minimum supported versions of the Catalyst Center are 2.3.7.9, 2.3.7.10, 3.1.3 and 3.1.5.


Procedure


Step 1

From the Overview menu, click Add a controller to enroll a new Catalyst Center controller.

You are redirected to the Controllers page to add a controller.

The Add Controller window appears.

Step 2

Enter these details:

  • Controller Name: Enter the name of controller. This is optional.

  • Controller IP Address or FQDN: Enter the reachable IP address or FQDN.

    Note


    This address is only used for initial enrollment setup completion.

  • Controller Member ID: Enter member ID of the Catalyst Center.

    Note


    Member ID is a global unique identifier for each instance of the controller that gets assigned when it gets created and is registered with the Catalyst Center Global Manager Cloud.

    To obtain the member ID of the Catalyst Center:

    1. Log into your Catalyst Center dashboard.

    2. Click the ? icon in the Catalyst Center product header, then select About > Member ID to view your member ID.

Step 3

Click Add.

The controller gets added to the Catalyst Center Global Manager. The Connect to controller window appears.

Step 4

Click Sign in to controller to complete the enrollment of Catalyst Center Global Manager from the controller side.

You will be prompted to login to the controller to finish enrollment.

The Catalyst Center page appears.

You need to finish enrollment in Catalyst Centerin the Settings > External Services > Global Manager Integration page. Once you successfully authenticate, it will show the Global Manager Integration page of the Catalyst Center to complete the enrollment.

Step 5

Click Enroll to link the Catalyst Center with Catalyst Center Global Manager.

Note


You can enroll a controller later when it appears as pending connection on the System > Controllers page. Select the controller and follow the instructions to enroll in the Controller Details window.

Alternatively, you can enroll or delete a controller from the System > Controllers page. Click the ellipses (...) adjacent to the controller you want to manage, then select the appropriate option to view, edit the controller name, enroll, or delete the controller.

Deleting a controller is a two-step process:

  1. Unenroll the controller. This action changes the controller status from Reachable to Pending configuration.

  2. Select the controller to delete from Catalyst Center Global Manager.

You cannot delete an unreachable controller from Catalyst Center Global Manager. You must wait until the controller comes online before deleting it.

Note


You must add a unique controller Member ID in the Catalyst Center Global Manager. The same controller Member ID cannot be added to multiple Catalyst Center Global Manager setups.


What to do next

Go to the Catalyst Center Global Manager dashboard. You will see a toast notification for the newly enrolled controller. This notification includes a Refresh link for you to update the page and view data from the controller.

Additionally, after the menu options are updated, you can go to the Controllers page to view the new Catalyst Center added to the Catalyst Center Global Manager.

Site Hierarchy

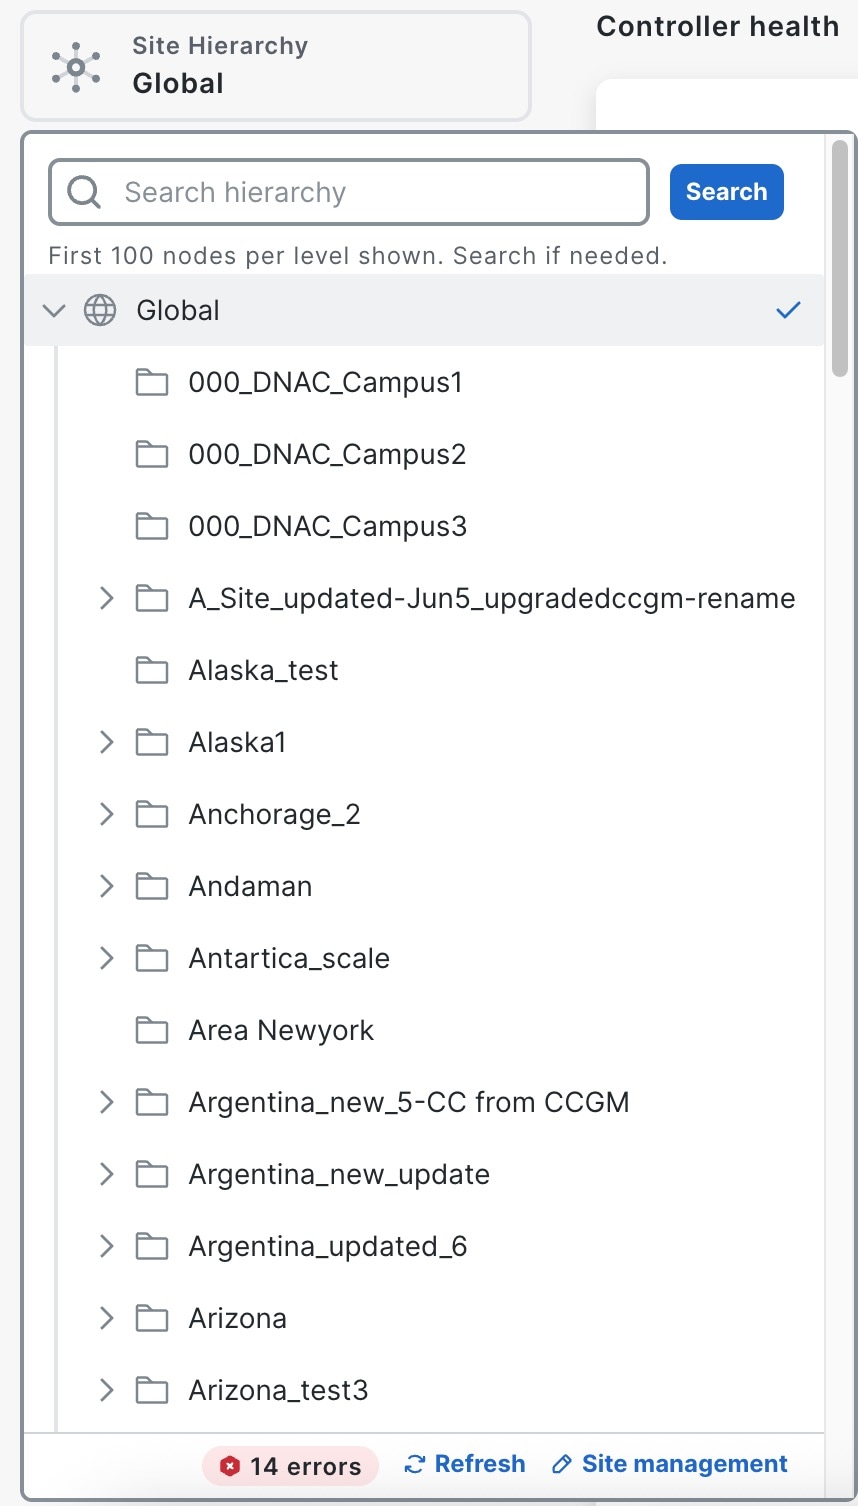
The Site Hierarchy selector in Catalyst Center Global Manager offers an aggregated view of all sites across different controllers. When multiple controllers share the same site (for example, Global/USA/East Coast), those sites are combined and presented as a single node in the site selector. The content displayed on the pages will be filtered based on the site that you select. An unfiltered view is also available.

The Site Hierarchy selector lists the first 100 nodes at each level. You can search for a specific site by entering a string and then click Enter or the Search button to initiate the search.

Refresh site hierarchy

There are effectively three scenarios to trigger a refresh of site hierarchy:

  1. If there any updates on the sites in any of the controllers, you need to manually click the Refresh button in the site selector to reload the data from all the controllers.

  2. If any updates on the controller’s reachability, such as updates on the controller or changes in reachability (for example, a controller becoming reachable or unreachable), then a manual Refresh is required in the site selector.


    Note


    Selecting a site will reflect the network health and alerts data on the Overview dashboard, as well as the other second-level pages data.

    The network health and alerts are specific to each site, whereas the controller health is not site-specific.


  3. In case of any error while populating the site data, an error count shows up in the bottom bar next to the Refresh.

The site selector does not automatically refresh for all changes; it only automatically refreshes the controller's sites in response to specific events such as:

  • Controller enrollment with toast notification refresh.

  • Unenrollment with toast notification refresh.

For these events, there's no need to manually click the Refresh button. In contrast, an on-demand refresh in the Catalyst Center Global Manager site selector is required when there are changes to the sites on the controller side, such as adding, deleting, or modifying sites.


Note


Catalyst Center Global Manager does not support non-global site-based RBAC for Catalyst Center sites; however, it displays globally scoped site-based RBAC sites in the site selector.


Rename a site

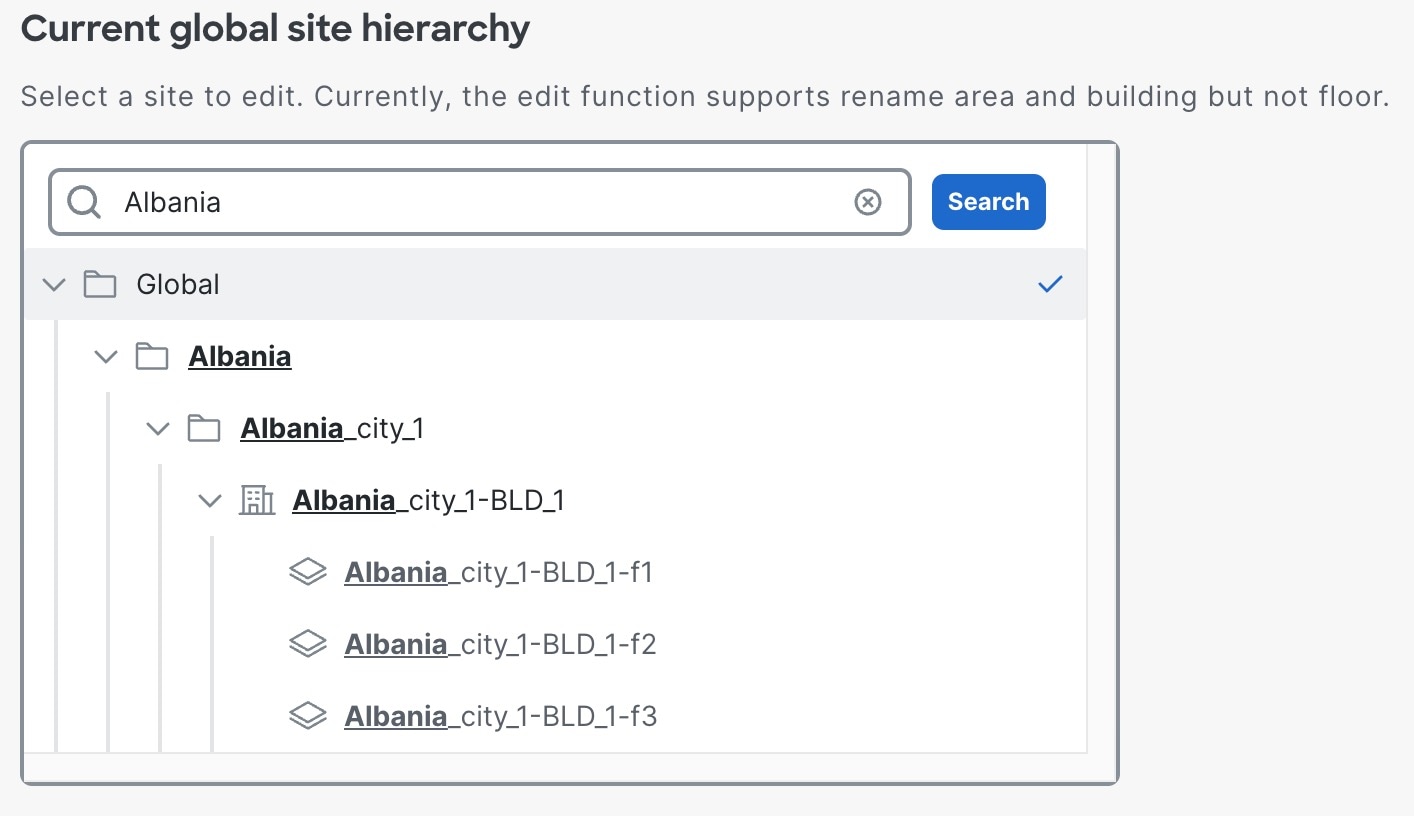
You can rename sites in the Site Hierarchy from Site management for all related controllers. These modifications are configured on the Catalyst Centers.


Note


You can only rename the buildings and areas; the global site and floors cannot be renamed.

You can edit the sites as long as they are included in the site hierarchy, regardless of whether they are fabric sites or non-fabric sites. There is no support for fabric zones functionality in Catalyst Center Global Manager, which means that the Catalyst Center Global Manager does not provide functionality to configure fabric zones.


Procedure


Step 1

From the Catalyst Center Global Manager dashboard, go to the Site Hierarchy Global > Site management to rename the site.

The Site Hierarchy Management window appears.

Step 2

Locate the site you want to rename and click Search on the Site Hierarchy Management page.

Step 3

Click on the site you want to rename.

A pop-up window appears showing the impacted controllers for this site.

Step 4

On the Edit page, update the site name or other relevant details you want to change.

Step 5

Click Save.

The site is renamed successfully, and the updated site name appears in the site selector.

Note


In the site selector, the updated site name appears immediately. On other second-level pages such as Alerts, Endpoints, Health, and Software-Defined Access, the new site name appears after about 15 to 30 minutes.

If any errors occur, they are displayed in the final status of the operation.


Monitor from the overview dashboard

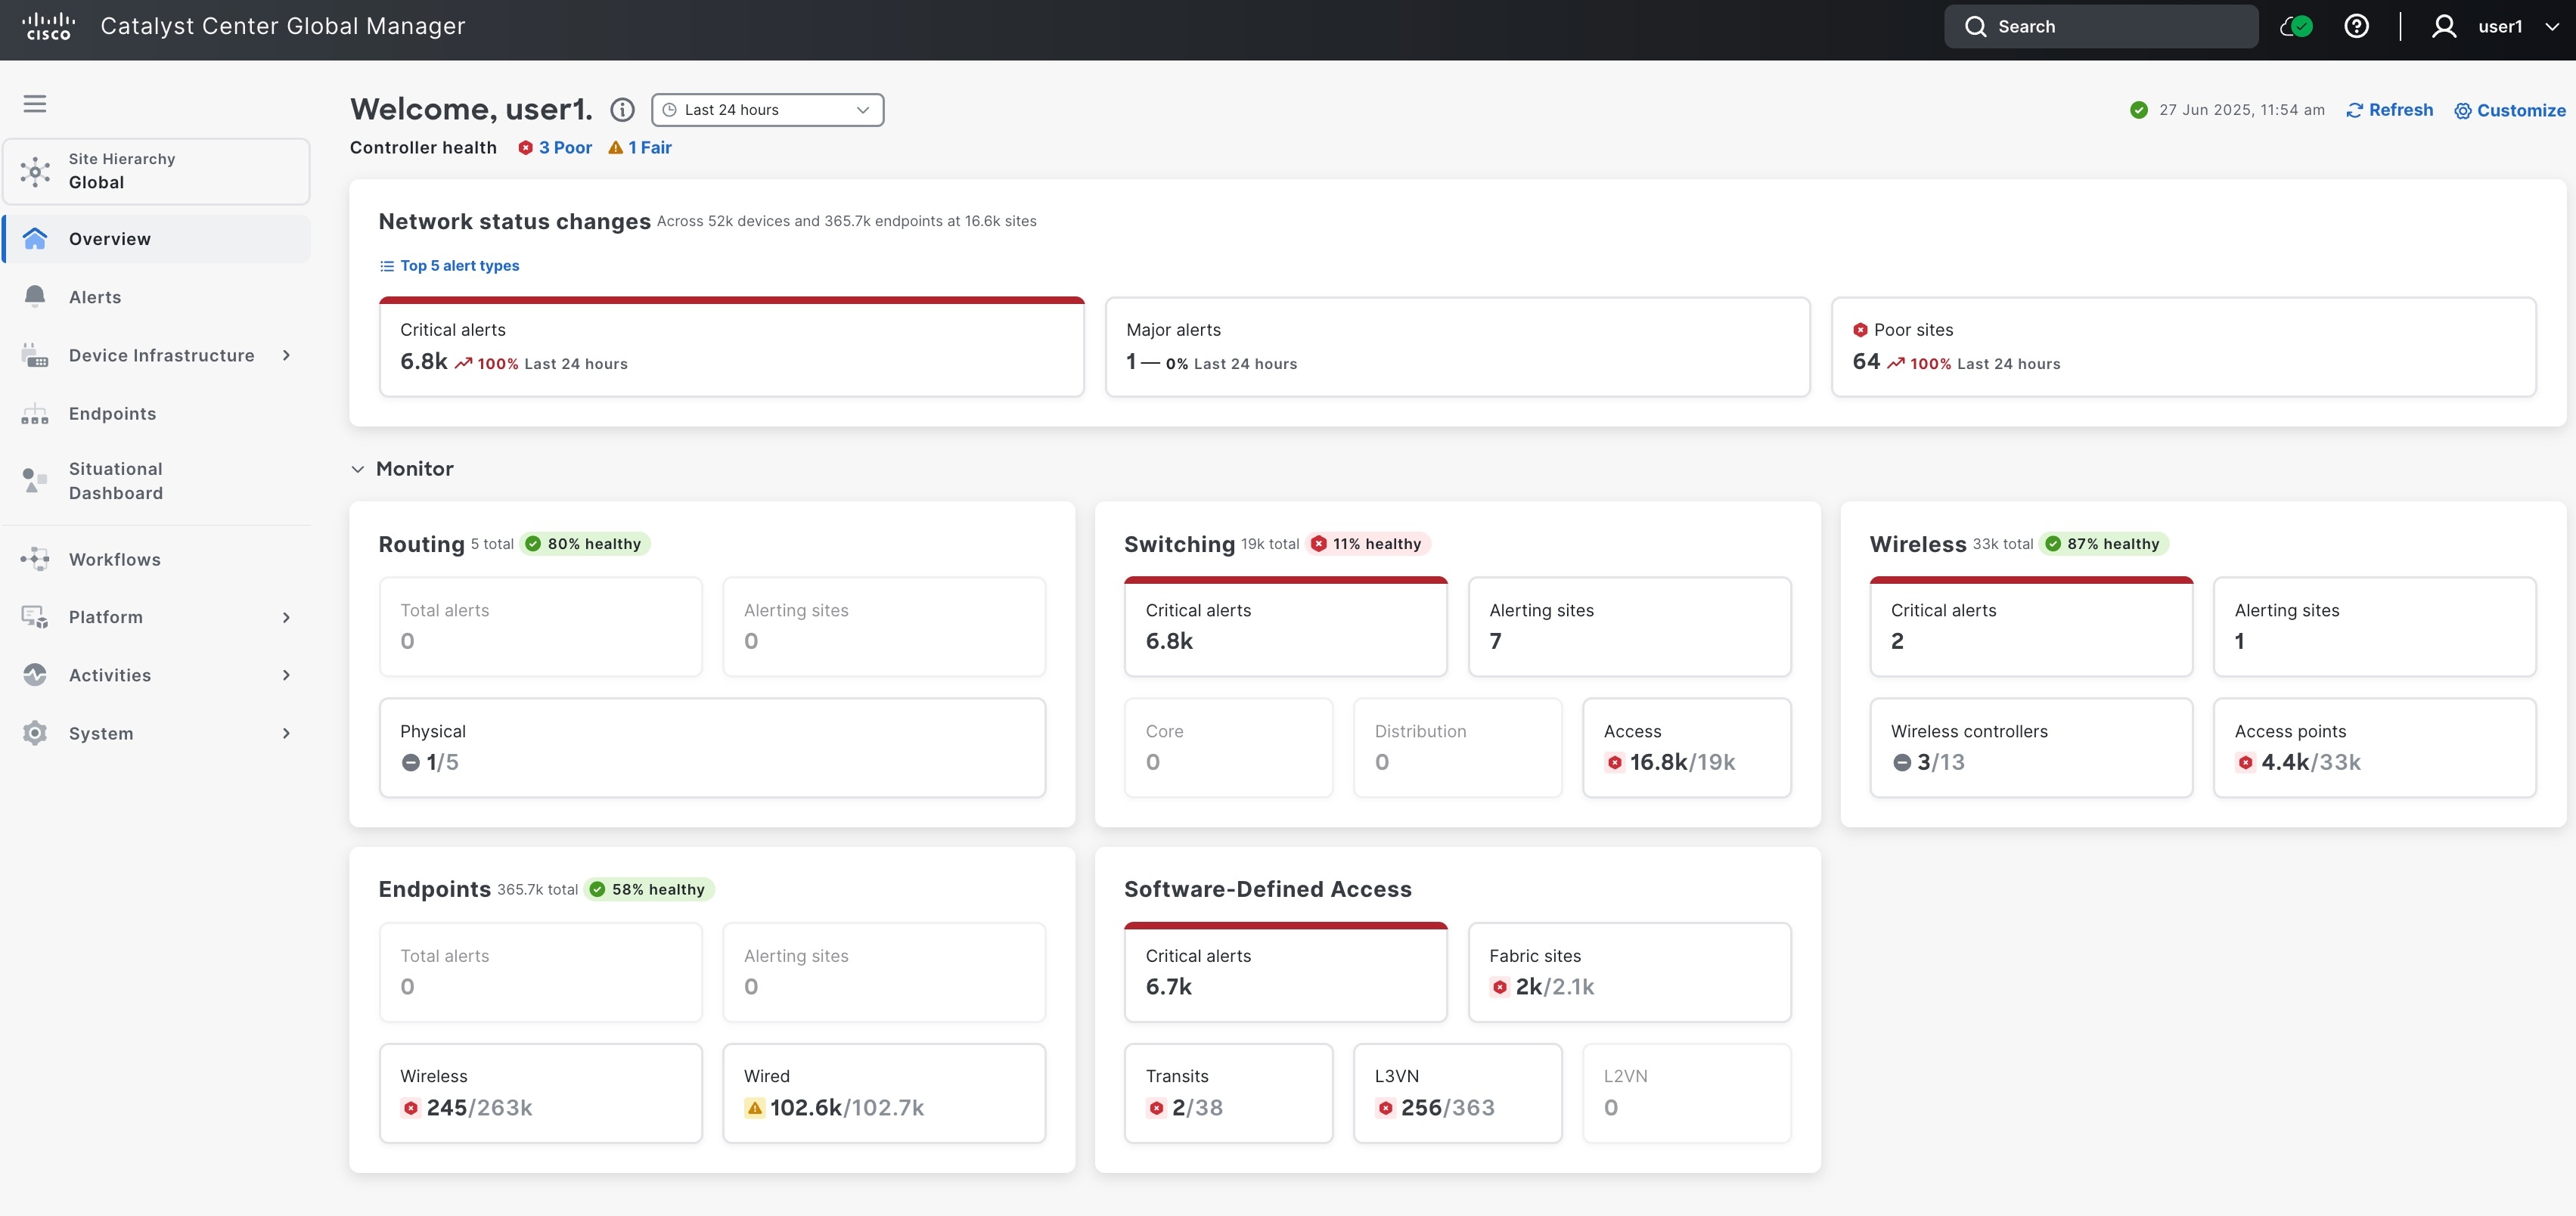
The Catalyst Center Global Manager Overview page includes controller health and additional details about individual controllers.

After you log in to Catalyst Center Global Manager and add controllers, the Catalyst Center Global Manager starts rendering data on the Overview page progressively. You can see a progress bar on the Overview page when the data loads incrementally as Catalyst Center Global Manager receives data from the enrolled controllers. This process is known as progressive loading.


Note


The total loading time of a page depends on the response time of each controller.

When all enrolled controllers respond with data, the progress bar turns green. The progress bar disappears within 5 seconds after the data load is complete.

All the second-level pages, including Alerts, Device infrastructure, Endpoints, and Situational Dashboards display a Loading complete progress indicator.

If the progess bar is:

  • Green- If the loading is success and it will vanish in five seconds.

  • Blue- While the loading is in progress.

  • Red- If the loading fails, and it will give you the loading error.


Note


If an error occurs while fetching data from enrolled controllers, the page displays a progress bar with error alerts. Hover over the bar to see how many controllers have responded. Click the loading status icon near the date and time to view detailed information about each failure for every dashlet in the Overview page.


Click Refresh to update the information displayed, ensuring you have the most current status of your network devices and components. This will provide you with the latest data on device health, performance, and any ongoing issues.

Click Customize to rearrange the dashlets within the different sections of the Overview page.

Monitor controller health

Support is available to view the controller health status from Catalyst Center Global Manager for individual Catalyst Centers.

From the Catalyst Center Global Manager Overview page, click on the controller's health status. This action will redirect you to the Controllers page within the Catalyst Center Global Manager displaying filtered data based on your selection.

Procedure


Step 1

On the Catalyst Center Global Manager dashboard, go to the Overview page and click the controller health status to view the health of the number of displayed controllers shown. Alternatively, go to System > Controllers to view the same information.

Step 2

Click one of the controller names to view the details. Use the cross-launch feature to access the respective controller's System health to view the health details and troubleshoot.

After this, you can proceed with additional troubleshooting steps on the Catalyst Center.

For information about controllers, see the Controllers.


Monitor network status changes

Network status changes provides an overview of networks across all devices and endpoints at multiple sites managed by all the Catalyst Centers. Use this information to identify potential issues that may require attention.

Procedure


From the Catalyst Center Global Manager dashboard, go to the Overview page to view the Network status changes section.

You can view these dashlets under Network status changes:

  • Critical Alerts

  • Major Alerts

  • Poor Sites


Monitor health of devices

Monitor these summaries and health of the devices:

  • Routing allows you to view:

    • Minor alerts

    • Alerting sites

    • Physical

  • Switching allows you to view:

    • Minor alerts

    • Alerting sites

    • Core

    • Distribution

    • Access

  • Wireless allows you to view:

    • Minor alerts

    • Alerting sites

    • Wireless controllers

    • Access points

  • Endpoints allows you to view:

    • Minor alerts

    • Alerting sites

    • Wireless

    • Wired

  • Software-Defined Access summaries allows you to view:

    • Total alerts

    • Fabric sites

    • Transits

    • L2 VN

    • L3 VN

Clicking each sub-card count opens the corresponding second-level pages, such as Alerts, Health, Software-Defined Access, and Endpoints.

Alerts

The Alerts feature in Catalyst Center Global Manager helps you view and explore details about alerts that require your attention. You can see different alert types and analytics, including the top site groups and segment types for each alert.

To view the alerts, navigate to the Catalyst Center Global Manager dashboard and click Alerts. The page progressively loads data as information is received from the enrolled controllers.

The alerts are categorized into four levels:

  • Critical

  • Major

  • Minor

  • Informational

To see more information about a specific alert, click the alert type name on Alert types to cross-launch or navigate to their respective controller.

The Alerts page also provides these details.

  • Analytics- Analytics shows the top site groups and top segment types.

  • Alert types- Alert types display a table of all alerts filtered by priority, segment type, and category.

Device infrastructure

The Device Infrastructure in Catalyst Center Global Managershows filtered details of each device health and fabric site. Use it to ensure your devices and fabric sites are secure and working well.

Device health

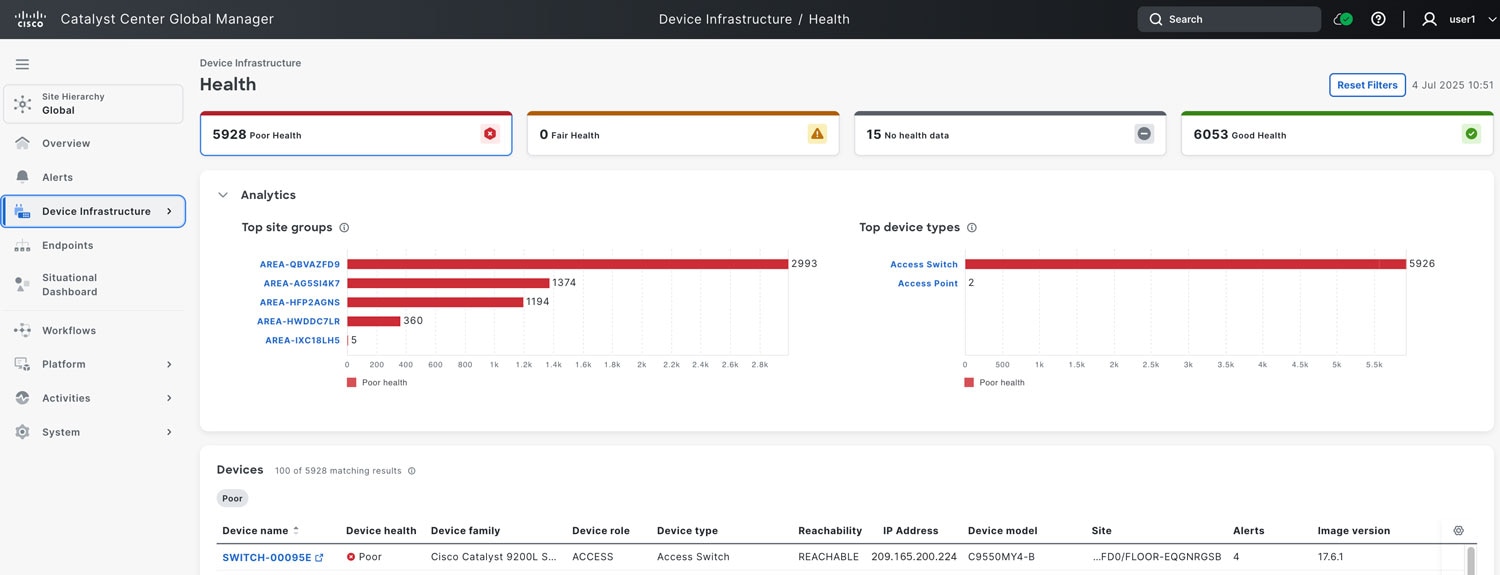
To view the health status of each device, navigate to the Catalyst Center Global Manager dashboard and click Device Infrastructure > Health. Then the page loads data progressively as it receives information from the enrolled controllers.

The health status categories are:

  • Poor Health: Devices with a health score range from 1 to 3.

  • Fair Health: Devices with a health score range from 4 to 7.

  • No Health Data: Devices with no data.

  • Good Health: Devices with a health score range from 8 to 10.

To see more information about a specific device, click the device name on Devices to cross-launch or navigate to their respective controller Device 360 page.

The Health page also gives information on:

  • Summary- Summary of network health based on each health category.

  • Analytics- Analytics shows the top site groups and top device types.

    You can interact with site groups and device types by selecting and unselecting the filter and based on the devices that are listed in a table as shown in the image.

    For example: When a site group is selected from the Top site groups chart, the Top device types chart will highlight the device types associated with that selected site group. Conversely, selecting a device type from the Top device types chart will highlight the site groups in the Top site groups chart that include those device types.

    You can select filters from both the Top site groups and Top device types analytics sections simultaneously. The Devices table below will then display devices filtered by the combination of these selected criteria, with the active filters visually highlighted. Unselecting a site group or device type selection from the analytics charts will clear the corresponding filter and update the Devices table accordingly.

  • Devices—Displays a table of all devices, including device name, device health, and device family, based on your selection.

    The devices table displays only 100 entries.

Data export allows you to export all the matching results from the table on the device Health page in CSV format.


Note


This feature is in beta.


You can apply filters to tables in Catalyst Center Global Manager; however, they are limited to display first 100 records of all the matching records in the list.

To export the device health:

  1. From the main menu, choose Device Infrastructure > Health.

  2. From the Devices section, click Export.

    The Device health export window appears.

  3. Click Export to export all results that match the applied filter.

  4. Click Download to see the exported data with the respective filter showing the health status.


Note


The data export process may take up to 30 minutes to complete because it progressively retrieves all matching results from the enrolled controller.

You can view the latest five exported reports, which are retained on the Download page for three days.


Software-Defined Access health

To view the Software-Defined Access health status of each fabric site, transit, layer 3 virtual network (L3 VN), and layer 2 virtual network (L2 VN), navigate to the Catalyst Center Global Manager dashboard and click Device Infrastructure > Software-Defined Access. Then the page loads data progressively as it receives information from the enrolled controllers.

The health status categories are:

  • Poor Health: Devices with a health score range from 1 to 3.

  • Fair Health: Devices with a health score range from 4 to 7.

  • No Health Data: Devices with no data.

  • Good Health: Devices with a health score range from 8 to 10.

The Software-Defined Access page also gives information on:

  • Fabric site health: It displays a table of fabric sites.

  • Transit health: It displays a table of transits.

  • Layer 3 virtual network health: It displays a table of L3 VNs.

  • Layer 2 virtual network health: It displays a table of L2 VNs.

End-of-Life Devices

To view the End-of-Life (EoL) of each device, navigate to the Catalyst Center Global Manager dashboard and click Device Infrastructure > End-of-life Devices. Then the page loads data progressively as it receives information from the enrolled controllers.


Note


This feature is in beta.


The End-of-Life devices feature delivers information on Cisco devices that have reached or are nearing their End-of-Life (EoL) status, including key hardware and software expiration dates. This feature is similar to the EoX (End-of-life) feature in Catalyst Center, offering detailed reports on device lifecycle milestones to help with product upgrade and substitution planning.

Support for this feature is available on Catalyst Center platforms running software versions later than 2.3.7.10 and build 3.1.5.

The EoL devices display counts for the following categories:

  • Routers

  • Switches

  • Wireless

  • Accessories (can be part of router/switches/wireless)

To see more information about a specific device, click the device name on Devices to cross-launch or navigate to their respective controller Inventory details page.

The End-of-life Devices page also gives information on:

  • Summary- Summary of EOL devices based on each device category.

  • Analytics- Analytics shows the top five site groups and top device series, along with their individual counts.

    You can interact with site groups and device series by selecting and unselecting the filter and based on the devices that are listed in a table.

    For example: When a site group is selected from the Top site groups chart, the Top device series chart will highlight the device types associated with that selected site group. Conversely, selecting a device type from the Top device series chart will highlight the site groups in the Top site groups chart that include those device types.

    You can select filters from both the Top site groups and Top device series analytics sections simultaneously. The Devices table below will then show devices filtered by the the selected criteria, with active filters visually highlighted. The filters correspond to your selections for routers, switches, wireless devices, and accessories at the top. Unselecting a site group or device type selection from the analytics charts will clear the corresponding filter and update the Devices table accordingly.

  • Devices—Displays a table of all devices, including device name, IP address, site, device type, device model, chassis + modules, accessories, last date of support, and next milestone, based on your selection.

    Click on Chassis+ modules counts to view the EOL details for each hardware component, including accessories and software EOL data.

    Click the Accessories counts to view the EOL details for accessories components, such as fans and power supplies.

    Click Advanced filter to do further filters based on the columns selected in the Devices table.

Endpoints

To view the endpoints, navigate to the Catalyst Center Global Manager dashboard and click Endpoints. Then the page loads data progressively as it receives information from the enrolled controllers.

Endpoints are also now available on the second-level page of the Catalyst Center Global Manager. You can access them from the endpoints dashlet on the Overview dashboard.

Endpoints:

  • It gives the health details about wireless and wired endpoints.

  • Both the wireless and wired endpoints populate top site groups and top metrics information.

  • The Endpoints page, like other second-level pages in the Catalyst Center Global Manager, provides additional health categories.

To see more information about Connected AP, click the Access Point (AP) name on the Endpoints page for wireless endpoints. This action cross-launches to the corresponding controller's Device 360 page for the specific AP page. Similarly, to see more information about Connected Switch, click the connected switch name on the Endpoints page for wired endpoints. This cross-launches to the related controller's Device 360 page for that specific controller switch page.

Situational dashboard

A situational dashboard enables you to design custom pages using pre-built dashlets available in Catalyst Center Global Manager, based on your requirements. The dashboard provides aggregated views of client and device health, connectivity, and performance metrics.

Note


This feature is in beta.


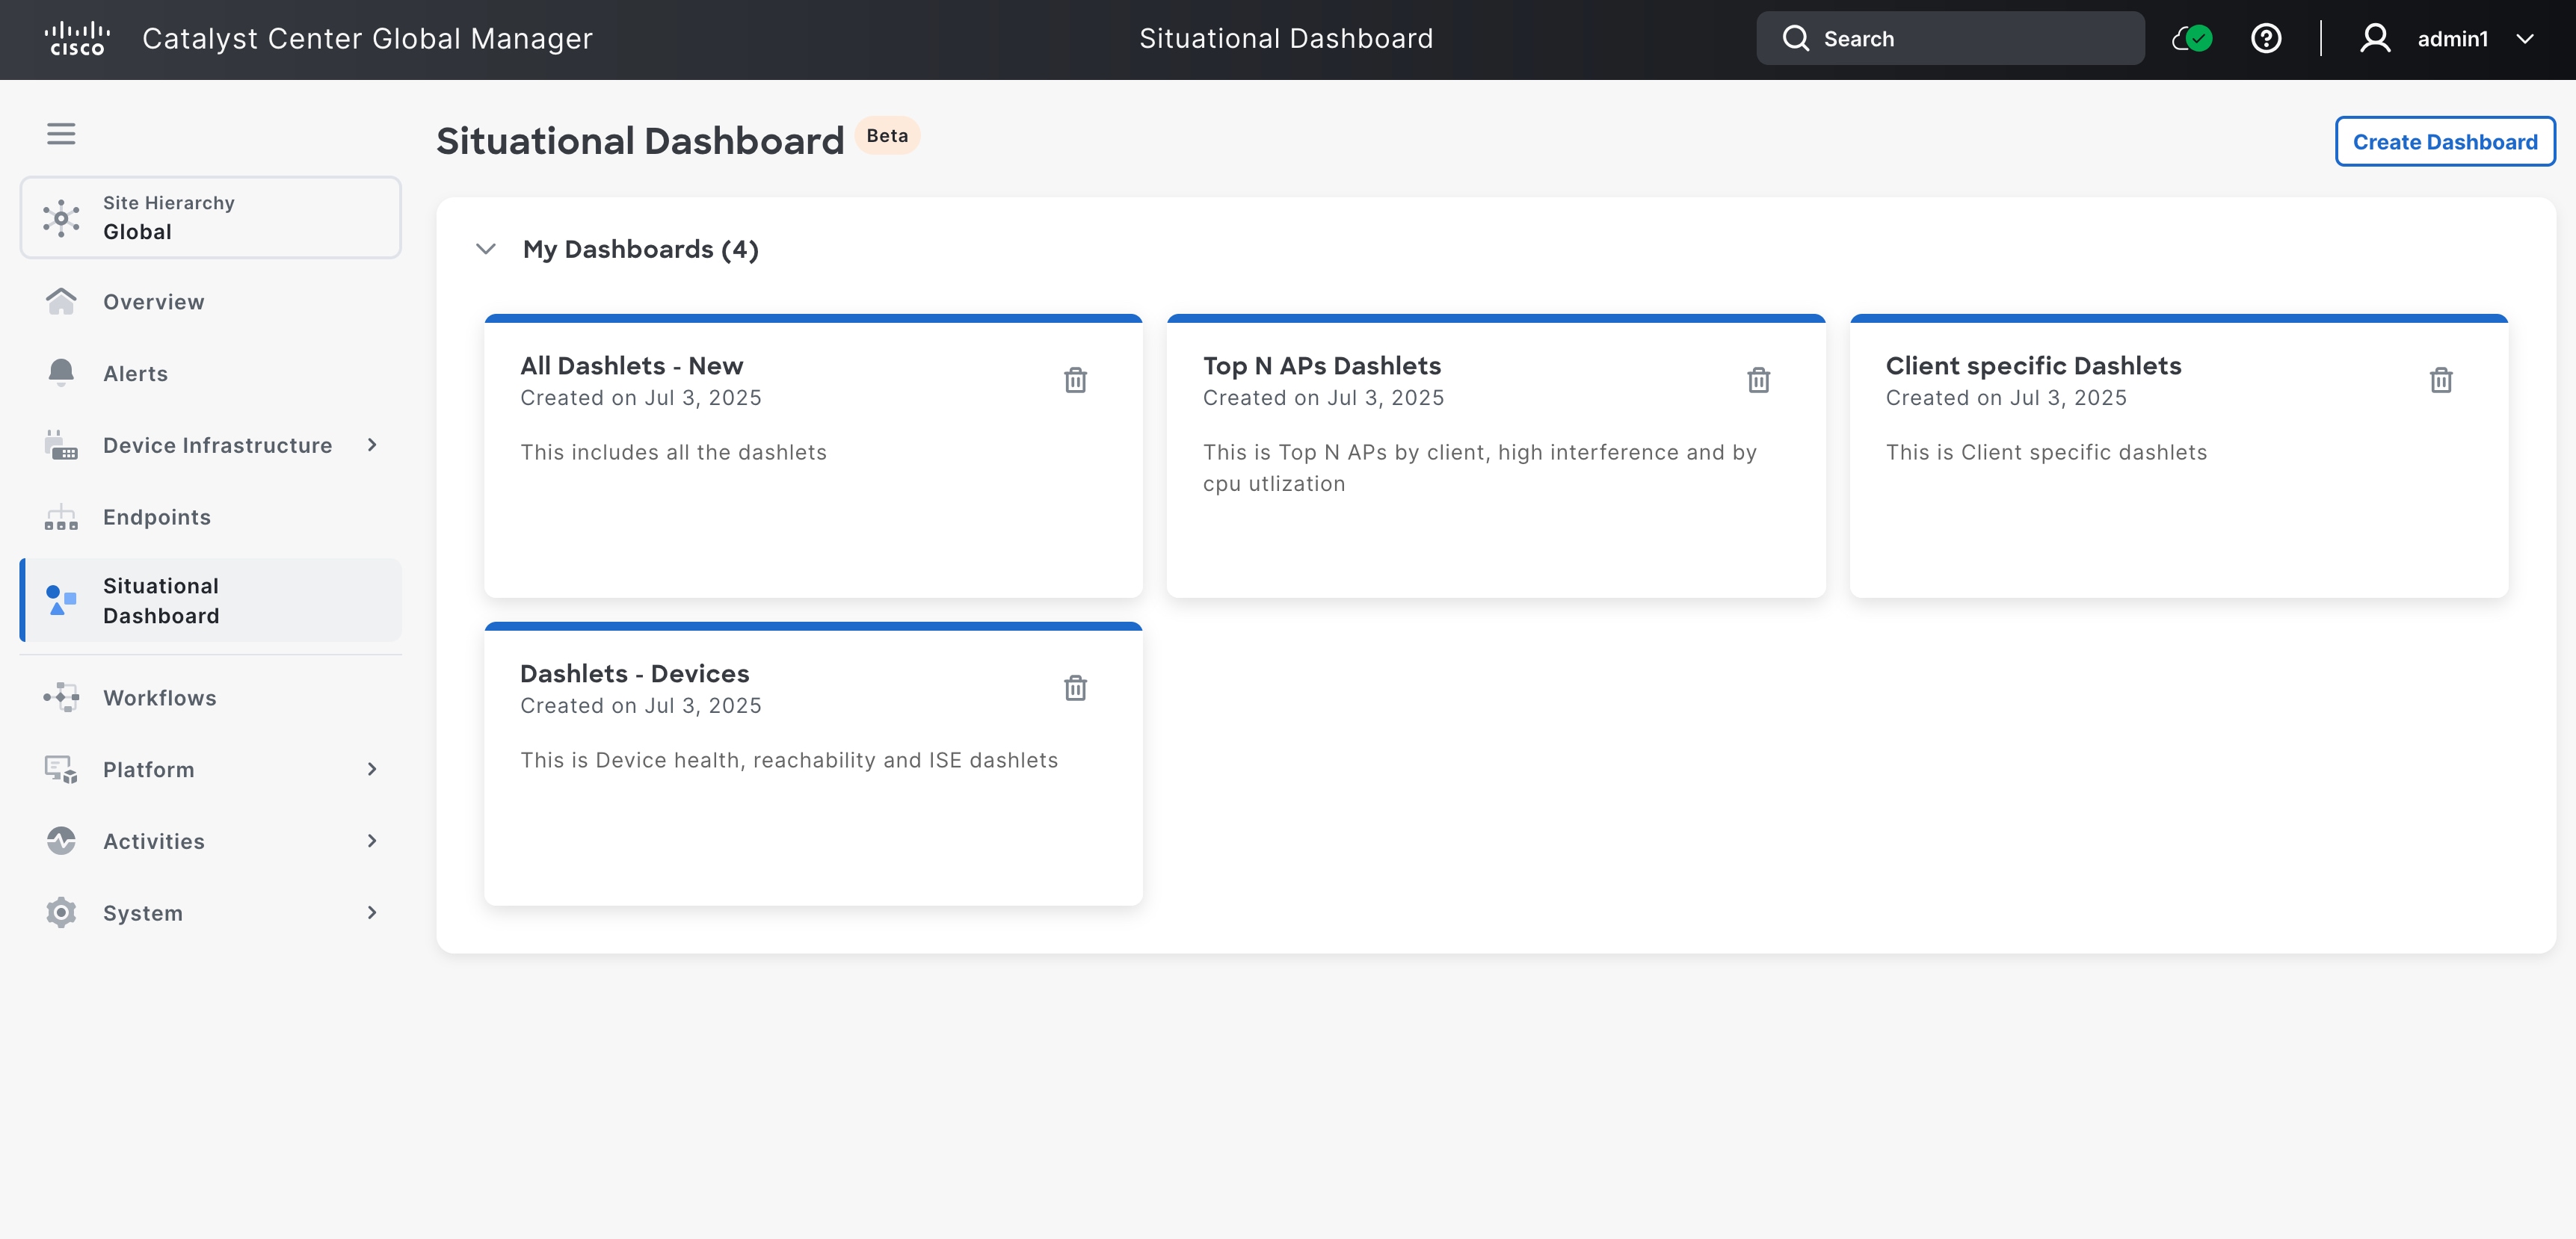
To view the situational dashboard, navigate to the Catalyst Center Global Manager dashboard and click Situational Dashboard. Then the page loads data progressively as it receives information from the enrolled controllers

The image here shows the situational dashboard page with different daslets.

Create a dashboard

Procedure


Step 1

From the Catalyst Center Global Manager dashboard, navigate to Situational Dashboard > Create Dashboard to create a customised page using the 32 available pre-defined dashlets.

The Create New Dashboard window appears.

Step 2

Enter the Dashboard Title, and the Description. Then, choose the views you want to enable in your dashboard from the available dashlets. These dashlets display various widgets categorized into separate sections.

Endpoint Performance

  • Endpoint onboarding times

  • Endpoint roaming times

  • Endpoint connectivity Received Signal Strength Indicator (RSSI)

  • Endpoint connectivity Signal-to-Noise Ratio (SNR)

  • Endpoint count per Service Set Identifier (SSID)

  • Endpoint physical link connectivity

  • Endpoint count per band

Access Point Metrics

  • Top N Access Points (APs) by client count

    Here, N refers to the number of APs displayed.

  • Top N APs by high interference (2.4 Ghz)

  • Top N APs by CPU utilization

  • Total APs up/down

Network Health

  • Device health count

  • Total network reachability

Integrations

  • Identity Services Engine (ISE)

Network Services

  • Authentication, Authorization and Accounting (AAA)

    1. AAA transactions

    2. AAA summary

    3. AAA servers top transactions by device

    4. Top AAA latency sites

    5. Top AAA failure sites

  • Dynamic Host Configuration Protocol (DHCP)

    1. DHCP transactions

    2. DHCP summary

    3. DHCP servers top transactions by WLC

    4. Top DHCP latency sites

    5. Top DHCP failure sites

  • Domain Name System (DNS)

    1. DNS transactions

    2. DNS summary

    3. DNS servers top transactions by WLC

    4. Top DNS server latency

    5. Top DNS failure sites

Power over Ethernet (PoE)

  1. Power usage

  2. PoE powered device distribution

  3. PoE operational state distribution

Step 3

Click Save.

Your customised page appears as one of the dashboards you have created under Situational Dashboards.

Note


This dashboard is specific to your user account and is not visible to other users.

Step 4

Click the page you have created to view aggregated data from multiple controllers.

Note


Click Refresh to update the information displayed, ensuring you have the most current status.

Select the dashlet, then choose Edit or Delete to modify or remove the dashboard.

You can switch between the created dashboard using the drop-down menu in the dashboard title’s arrow icon.

If you select the site under Site Hierarchy, the dashlets will reflect the specific site data.


Controllers

After the Catalyst Centers have been enrolled to Catalyst Center Global Manager, you can view all the Catalyst Centers on the Controllers page.

There are two ways to navigate to the Controllers page.

  • From the Overview page, click on the controller health status.

  • Alternatively, from the System > Controllers page.

Then select the controller name to view more detailed information.


Note


The health status of the controller may take up to 10 minutes to be displayed.


The Controllers page displays these details:


Note


  • Controller—Name of the Catalyst Center controller.

  • When the controller is upgraded to the latest version, the System version column on the controller page will automatically display the new updated version.


Click one of the Controllers to view the controller details. The Controller Details window appears, and you can click any link to cross-launch to the controller page for further information.

The Controller Details include:

  • Controller name- Shows the controller name, which is displayed as an IP address.

  • By default, the controller name is populated during enrollment using the configured hostname, VIP address, management IP address, or Enterprise interface IP address for the Catalyst Center controller. However, you have the option to update the name to a customized one using the Edit feature on the controller page.


    Note


    You can edit only the Controller name and the edited name is visible only on the Controllers page within the Catalyst Center Global Manager, and it will not propagate to the controller itself.


  • View details- Shows the cross-launch link to System 360.

  • IP Address- Shows the IP addresses of all the controllers that have been added to Catalyst Center Global Manager.

  • Connectivity: Shows whether the controllers are reachable or unreachable.

  • Health status- Shows the health of all the controllers.

  • Description- Shows the domain system certificate, an alert or a description of any system health event for all the controllers.

  • Type of controller- Shows whether the controller is Catalyst Center.

  • Enterprise VIP- Shows the virtual IP address of the controller.

  • Cluster configuration- Shows whether the controller is single-node or 3-node.

  • System Version- Shows the software versions running on Catalyst Centers.

  • Cloud Member ID- Shows the Cloud member ID of the controller.

  • Last collected on- Shows the controller details collected date.


Note


  • You can edit only the name of the controller.

    The name will determine how the controller is labeled in Catalyst Center Global Manager, but it will not be reflected on the controller itself. This is strictly a UI setting and does not affect the configuration of the controller. Additionally, this name will not be visible when you cross-launch to the controller.

    If you want to edit the controller, click one of the Controllers name that you want to edit. The Controller Details window is displayed. Click Edit and change the name of the controller and then save.

  • You can edit the table settings.

    You can decide what you want to see and what you want to hide from the Controllers page. For this, the table settings for the Controllers page can be adjusted by clicking the gear icon in the table header. The Table Settings window appears. You can check or uncheck the items under Table Density and Table Columns based on your requirement and click Apply.


For information about adding and deleting a controller, see Enroll Catalyst Center to Catalyst Center Global Manager.

Once a controller is added to the controller page, it appears in the list as a "Pending configuration" controller. When a controller is in this status, you cannot edit any of its fields. To modify any user-provided information, the controller must be deleted and then re-added with the corrected details.

Cross-launch to controllers

The Controllers page displays various types of cross-launches in the Controller Details for each controller. These include system 360, system health, and software management.

Cross-launch is available from all pages within the Catalyst Center Global Manager. With a single login to the Catalyst Center Global Manager, you can access all registered controllers without the need to log in again.

System 360

The System 360 provides detailed information about the app stacks and services running on the selected Catalyst Center. You can use this information to assist in troubleshooting issues with specific applications or services.

Procedure

Step 1

In the Controllers page, click one of the controllers.

The Controller Details window is displayed.

Step 2

Click System 360 to view the details.

A new window opens from the Catalyst Center Global Manager dashboard after cross-launching to a specific page of the selected controller.

Note


For cross-launch to function properly for an enrolled Catalyst Center, the same users in Catalyst Center Global Manager must exist in all the controllers managed by Catalyst Center Global Manager.


System health

The System Health provides detailed information about the health of the selected Catalyst Center from the Controllers page.

When you click System Health in the Controller Details window of the selected controller, the system cross-launches to the corresponding Catalyst Center page.

Software management

The Software Management displays the available installed applications or system updates of the selected Catalyst Center from the Overview page.

When you click Software Management in the Controller Details window of the selected controller on the Overview page, the system cross-launches to the corresponding controller page.

Workflows

Catalyst Center Global Manager provides support to trigger notifications when certain events occur. You can choose your preferred method of receiving event notifications. The notification channels supported are:

  • EMAIL- Send an email notification.

  • PAGERDUTY- Post event notifications to PagerDuty.

  • REST- Send data via HTTP push API.

  • SNMP- Send data via an SNMP trap.

  • SYSLOG- Send data to a Syslog server.

  • WEBEX- Post event notifications to Webex.

Platform

Catalyst Center Global Manager provides an extensible platform that Cisco customers and partners can use to create value-added applications that can be built on top of its native capabilities. You can leverage the platform features to enhance the overall network experience by optimizing end-to-end IT processes, reducing the Total Cost of Ownership (TCO), and developing new value networks:

  • Intent APIs: The Intent APIs are northbound REST APIs that expose specific capabilities of Catalyst Center Global Manager platform. The Intent APIs provide policy-based abstraction of business intent, allowing you to focus on an outcome to achieve instead of struggling with the mechanisms that implement that outcome. The APIs conform to the REST API architectural style. The APIs are simple, extensible, secure to use, and support the standard REST methods, which include the GET, POST, PUT, and DELETE operations through HTTPS.

  • Integration Flows: Integration capabilities are part of westbound interfaces. To meet the need to scale and accelerate operations in modern data centers, IT operators require intelligent, end-to-end work flows built with open APIs.

  • Events and Notifications Services: Supported services are available for Catalyst Center Global Manager events.


Note


The Catalyst Center Global Manager platform application is accessible to a user with a SUPER-ADMIN-ROLE. Log in as a user with a SUPER-ADMIN-ROLE to view the Catalyst Center Global Manager platform and do tasks through its GUI. Additionally, as a user with a SUPER-ADMIN-ROLE, you can create a custom role with read, write, or deny permissions to various platform functionality (APIs, bundles, events, and reports). From the main menu, choose System > Users & Roles > Role Based Action Access Control to access this feature.


Overview

To access the Platform window, navigate to the Catalyst Center Global Manager dashboard and click Platform > Overview.

The platform Overview window supports these features:

  • Displays brief summaries and direct links to the Catalyst Center Global Manager platform GUI features, including:

    • Bundles: Provides access to bundles that you can use to integrate your own applications to Catalyst Center Global Manager with or to enhance the performance of Catalyst Center Global Manager itself. Bundles are defined as groupings of APIs, events, integration flows, data services, or applications. Additionally, provides access to a GUI (Configurations) where you can configure general or event global settings or settings for multiple bundles.

    • Developer Toolkit: Provides tools (APIs and integration flows) for accessing Catalyst Center Global Manager and integrating Catalyst Center Global Manager with other applications.

  • Accesses the Notifications slide-in pane that presents any current Catalyst Center Global Manager platform notifications, including bundle updates. Click View Details to view detailed data about the bundle under the Bundles tab. Click Dismiss to dismiss the bundle notification.

Manage

The Catalyst Center Global Manager platform Manage window provides access to these features:

To access the Manage window, navigate to the Catalyst Center Global Manager dashboard and click Platform > Manage.

  • Bundles: Access to bundles that you can use to integrate Catalyst Center Global Manager with your own applications or to enhance the performance of Catalyst Center Global Manager itself. Bundles are comprised of groupings of APIs, events, data services, or applications.

Bundles

Catalyst Center Global Manager platform provides access to bundles that you can use to integrate Catalyst Center Global Manager with your own applications or to enhance the performance of Catalyst Center Global Manager itself.

This Catalyst Center Global Manager platform information is accessible using the GUI:

  • Bundle name, vendor, version, version release date, tags, and description.

  • Status of the bundle:

    • NEW: Bundle that is available through Catalyst Center Global Manager platform, but has not yet been enabled. Click Enable to enable the bundle for configuration and subsequent activation.

    • ENABLED: Bundle that has been enabled, but not yet configured. Once enabled, the bundle's API code can be viewed under the Contents tab. Click Configure to configure at the bundle level.

      The enablement and configuration of bundles are two separate steps, because a business manager will usually enable a particular bundle as a business decision. The follow-up configuration of the bundle will usually be performed by an IT or network administrator.

    • DISABLED: The bundle has been stopped from executing any further.

    • ACTIVE: After either reviewing and/or configuring the bundle (configuring bundle-specific values), you can activate the bundle in your network by clicking Activate.

    • UPDATE: When you upgrade from one version of Catalyst Center Global Manager platform to a later version of Catalyst Center Global Manager platform.

    • ERROR: There is an issue with the bundle and it cannot be activated within your network.

Developer toolkit

The Catalyst Center Global Manager platform provides you with these software developer tools to access and program with Catalyst Center Global Manager, as well as to integrate Catalyst Center Global Manager with other applications:

  • APIs: Available APIs organized within categories by functionality (for example, Operational Tasks or Site Management APIs).

  • Event Notifications: Lets you view and subscribe to specific events that may occur in your network.

To view the developer toolkit, navigate to the Catalyst Center Global Manager dashboard and click Platform > Developer Toolkit.

This toolkit provides a new set of intent APIs:

  • Authentication

  • Event Management

  • Know Your Network

  • Site Management

  • System

For more information on these APIs, see or download the Swagger docs from the APIs GUI.

Activities

The Activities page allows you to view the audit log details of Catalyst Center Global Manager.

To view the audit logs, navigate to the Catalyst Center Global Manager dashboard and click Activities > Audit Logs.

Audit logs in Catalyst Center Global Manager capture detailed information about various activities and events within the system performed by the logged in user, system-level changes such as user login options, controller operation initiated from the Catalyst Center Global Manager, and controller connectivuy status.

It provides the following information:

  • Created date and time

  • Description

  • Category

  • Severity

  • User


Note


  • You can refine the search summary for the following periods:

    • last 2 weeks

    • last 7 days

    • last 24 hours

    • last 3 hours

    • by date

  • You can also enhance the search summary by categorizing it according to different severity levels:

    • critical

    • warning

    • info


The Catalyst Center Global Manager audits the following operations:

  • All user logins.

  • Catalyst Center Global Manager operations such as:

    • backup and restore

    • upgrade

    • create user

    • configure AAA Server

    • enroll or unenroll controller

    • controller connectivity status change (reachable or unreachable)

  • Controller operations initiated from Catalyst Center Global Manager.

System

The System page allows you to view these basic details of Catalyst Center Global Manager.

Use System 360

The System 360 tab provides at-a-glance information about Catalyst Center Global Manager.

Procedure


Step 1

From the main menu, choose System > System 360.

Step 2

On the System 360 dashboard, review the following displayed data metrics:

The System 360 GUI offers a view of cluster-level services under hosts and allows monitoring of services through cluster tools. It also provides system management operations such as software management and information about backups.

Cluster

  • Hosts: Displays information about the Catalyst Center Global Manager hosts. The displayed information includes the hosts IP addresses and detailed data about the services running on the host. Click the View Services link to view detailed data about the services running on the hosts.

    Note


    The host IP address has a color badge next to it. A green badge indicates that the host is healthy. A red badge indicates that the host is unhealthy.

    The side panel displays the following information:

    • Node Status: Displays the health status of the node.

      If the node health is unhealthy, hover over the status to view additional information for troubleshooting.

    • Services Status: Displays the health status of the services. Even if one service is down, the status is Unhealthy.

    • Name: Service name.

    • Appstack: App stack name.

      An app stack is a loosely coupled collection of services. In this environment, a service is a horizontally scalable application that adds instances when demand increases and removes instances when demand decreases.

    • Health: Status of the service.

    • Version: Version of the service.

    • Tools: Displays metrics and logs for the service. Click the Metrics link to view service monitoring data in Grafana. Grafana is an open-source metric analytics and visualization suite. You can troubleshoot issues by reviewing the service monitoring data. For information about Grafana, see https://grafana.com/. Click the Logs link to view service logs in Kibana. Kibana is an open-source analytics and visualization platform. You can troubleshoot issues by reviewing the service logs. For information about Kibana, see https://www.elastic.co/products/kibana.

  • Cluster Tools: Lets you access only the monitoring tool.

    • Monitoring: Access multiple dashboards of Catalyst Center Global Manager components using Grafana, which is an open-source metric analytics and visualization suite. Use the Monitoring tool to review and analyze key Catalyst Center Global Manager metrics, such as memory and CPU usage. For information about Grafana, see https://grafana.com/.

      Note


      In a multihost Catalyst Center Global Manager environment, expect duplication in the Grafana data due to the multiple hosts.

System Management

  • Software Management: Displays the status of application or system updates.

    Click View Installed Applications or View Release Activities to view the update details.

    Note


    An update has a color badge next to it. A green badge indicates that the update or actions related to the update succeeded. A yellow badge indicates that there is an available update.

  • Backup & Restore: Displays the status of the most recent backup. Catalyst Center Global Manager allows both Network File System (NFS) and physical disk backup to be configured in the backup configuration. It schedules a backup with 2 options: Now or Daily.

    Note


    A backup has a color badge next to it. A green badge indicates a successful backup with a timestamp. A yellow badge indicates that the next backup is not yet scheduled.

    Click Configure Settings to configure backup settings, including adding or updating NFS configurations for storing backups. Additionally, you can restore the system using these backups through the interface.

Step 3

Click System Health to view detailed information about the health and topology of Catalyst Center Global Manager and lets you run the validation tool for Catalyst Center Global Manager.

On the System Health topology view, click one of the nodes of the Catalyst Centers to view details which will list the Controller Details similar to the Controller Details on the Controllers page:

  • Controller name

  • View details

  • IP address of controller

  • Connectivity

  • Health status

  • Description

  • Type of controller

  • Enterprise VIP

  • Cluster configuration

  • Node hostname

  • Node health

  • Node serial number

  • System Version

  • Cloud Member ID

  • Last collected on

On the System Health page, choose Validation Tool from the Tools drop-down to view the validation runs and status. The validation tool provides these information:

  • Name

  • Description

  • Selected set(s)

  • Status

  • Start time

  • Duration

  • Actions

A validation tool is provided to you to assess the system health of Catalyst Center Global Manager, which can be run on demand. The tool is divided into two sections: 'infra' and 'upgrade,' each containing its own specific set of validations. These validations are provided to you as part of the Catalyst Center Global Manager release.

Additionally, the same validations are uploaded to the validation catalog. To update your validation set, navigate to System > Settings > System Health to download and import the latest set of validations.

Click Refresh to view the displayed health status of your network devices and components. This ensures that you are viewing the most current information regarding the health and performance of your system.


Software Management

The Catalyst Center Global Manager provides many of its functions as individual applications, packaged separately from the core infrastructure. This enables you to view installed applications or system updates and uninstall those you are not using, depending on your preferences.

The number and type of application packages shown in the Software Management window vary depending on your Catalyst Center Global Manager release and your Catalyst Center Global Manager licensing level. All the application packages that are available to you are shown, whether or not they are currently installed.

Some applications are basic that they are required on nearly every Catalyst Center Global Manager deployment.

Each Catalyst Center Global Manager application package consists of service bundles, metadata files, and scripts.

The Software Management page provides you a view of these details.

  • Installed applications

    To view the description of a package, click the View Installed Applications and place your cursor over its name.

  • Upgrade summary report

    Click the View Upgrade Summary to view the results of the latest upgrade of Catalyst Center Global Manager and its applications. This report allows you to:

    • Identify the current and previous Catalyst Center Global Manager version that was installed on your appliance.

    • Determine when the upgrade took place.

    • In the Activity tab, view the application packages that were upgraded and their current version number.

    • In the Timeline tab, see whether the post-upgrade checks performed by Catalyst Center Global Manager were completed successfully.

  • Release activities

    Click the View Release Activities to view all installed applications that are in progress, success, or failed state.

About backup and restore

The backup and restore functions enable you to create backup files and restore them on a different appliance if necessary for your network configuration.

Backup

  • You can back up Catalyst Center Global Manager data only.

  • Catalyst Center Global Manager backup consists of database backups which includes:

    • All the enrolled controllers

    • Users and roles

    • Situational dashboards created by the users

    • All the system settings saved by the users


  • Important


    Do not modify or delete the backup files. If you do, you might not be able to restore the backup files to Catalyst Center Global Manager.


  • Catalyst Center Global Manager creates the backup files and posts them to a remote server. Each backup is uniquely stored using the UUID as the directory name. For information about the remote server requirements, see Backup server requirements.

  • Only a single backup can be performed at a time. Performing multiple backups at once is not supported.

  • When a backup is being performed, you cannot delete the files that have been uploaded to the file service, and changes that you make to these files might not be captured by the backup process.

  • Options available are:

    • Perform a daily backup to maintain a current version of your database and files.

    • Perform a backup after making changes to your configuration. For example, when changing or creating a new policy on a device.

    • Perform a backup only during a low-impact or maintenance period.

  • You can schedule weekly backups on a specific day of the week and time.

Restore

  • You can restore the backup files from the remote server using Catalyst Center Global Manager.

  • When you restore the backup files, Catalyst Center Global Manager removes and replaces the existing database and files with the backup database and files. While a restore is being performed, Catalyst Center Global Manager is unavailable.

  • You can restore a backup to a Catalyst Center Global Manager with a different IP address. This situation could happen if the IP address is changed on Catalyst Center Global Manager and you need to restore from an older system.

Backup server requirements

The backup server must run one of the supported operating systems:

  • Red Hat Enterprise 8 or later

  • Ubuntu 16.04 (or Mint, etc) or later

Server requirements for data backup

To support data backups, the server must meet these requirements:

  • Must use SSH (port22)/remote sync (rsync). Catalyst Center Global Manager does not support using FTP (port 21) when performing a backup.

  • The Linux rsync utility must be installed.

  • The C.UTF-8 locale must be installed. To confirm whether C.UTF-8 is installed, enter:

    # localectl  list-locales | grep -i c.utf
    C.utf8
    en_SC.utf8
    
  • The backup user must own the destination folder for the backup or have read-write permissions for the user's group. For example, assuming the backup user is backup and the user's group is staff, this sample outputs show the required permissions for the backup directory:

    • Example 1: Backup directory is owned by backup user:

      $ ls -l  /srv/ 
      drwxr-xr-x  4 backup     root  4096 Apr 10 15:57 acme
      
    • Example 2: backup user's group has required permissions:

      $ ls -l  /srv/ 
      drwxrwxr-x. 7 root   staff  4096 Jul 24  2017 acme
      
  • SFTP subsystem must be enabled. The SFTP subsystem path depends on which Ubuntu or Red Hat release is installed. For the latest release, the following line must be uncommented and present in the SSHD configuration:

    • Ubuntu-based Linux: Subsystem sftp /usr/lib/openssh/sftp-server

    • Red Hat-based Linux: Subsystem sftp /usr/libexec/openssh/sftp-server

    The file where you need to uncomment the preceding line is usually located in /etc/ssh/sshd_config.


Note


You cannot use an NFS-mounted directory as the Catalyst Center Global Manager backup server directory. A cascaded NFS mount adds a layer of latency and is therefore not supported.


Requirements for multiple Catalyst Center Global Manager deployments

If your network includes multiple Catalyst Center Global Manager clusters, you cannot use the same backup location. For multiple Catalyst Center Global Manager deployments, the best practice is to separate the backup directory structure for each Catalyst Center Global Manager cluster. This example configuration shows how to separate your backup directory structure.

Resource Example configuration

Catalyst Center Global Manager clusters

  1. cluster1

  2. cluster2

Backup server hosting backups

The example directory is /data/, which has ample space to host the Catalyst Center Global Manager backups.

Directory ownership and permissions

Earlier in this section, see "Server Requirements for Data Backup."

NFS export configuration

The content of the /etc/exports file:

/data/cluster1 *(rw,sync,no_subtree_check,all_squash)

Backup storage requirements

Catalyst Center Global Manager stores backup copies of data on an external NFS device on an external target location. You must allocate enough external storage for your backups to cover the required retention. We recommend that the daily NFS storage backup size be limited to a maximum of 1 GB, with a maximum retention capacity of 60 GB for disk backups..

Add a physical disk for backup and restore

Use this procedure to add a physical disk that can be used for only Catalyst Center Global Manager on ESXi backup and restore operations.

Procedure

Step 1

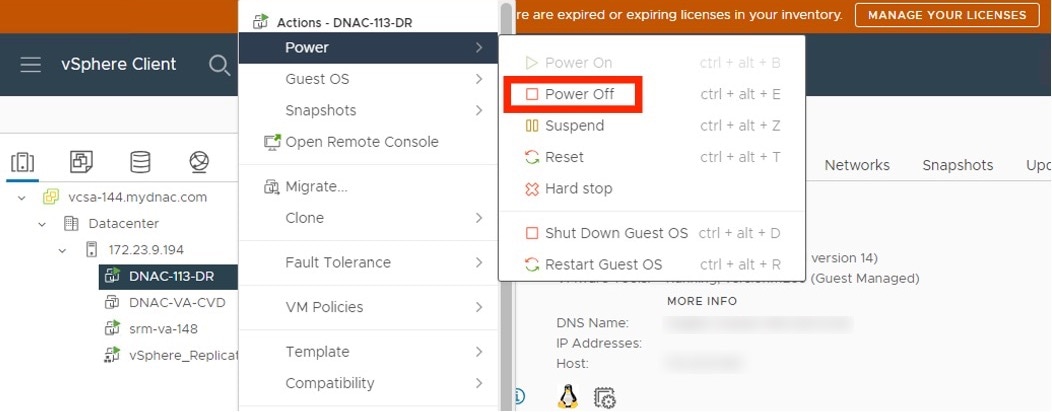
If your appliance is running on the machine that's hosting Catalyst Center Global Manager on ESXi, power off the appliance's virtual machine.

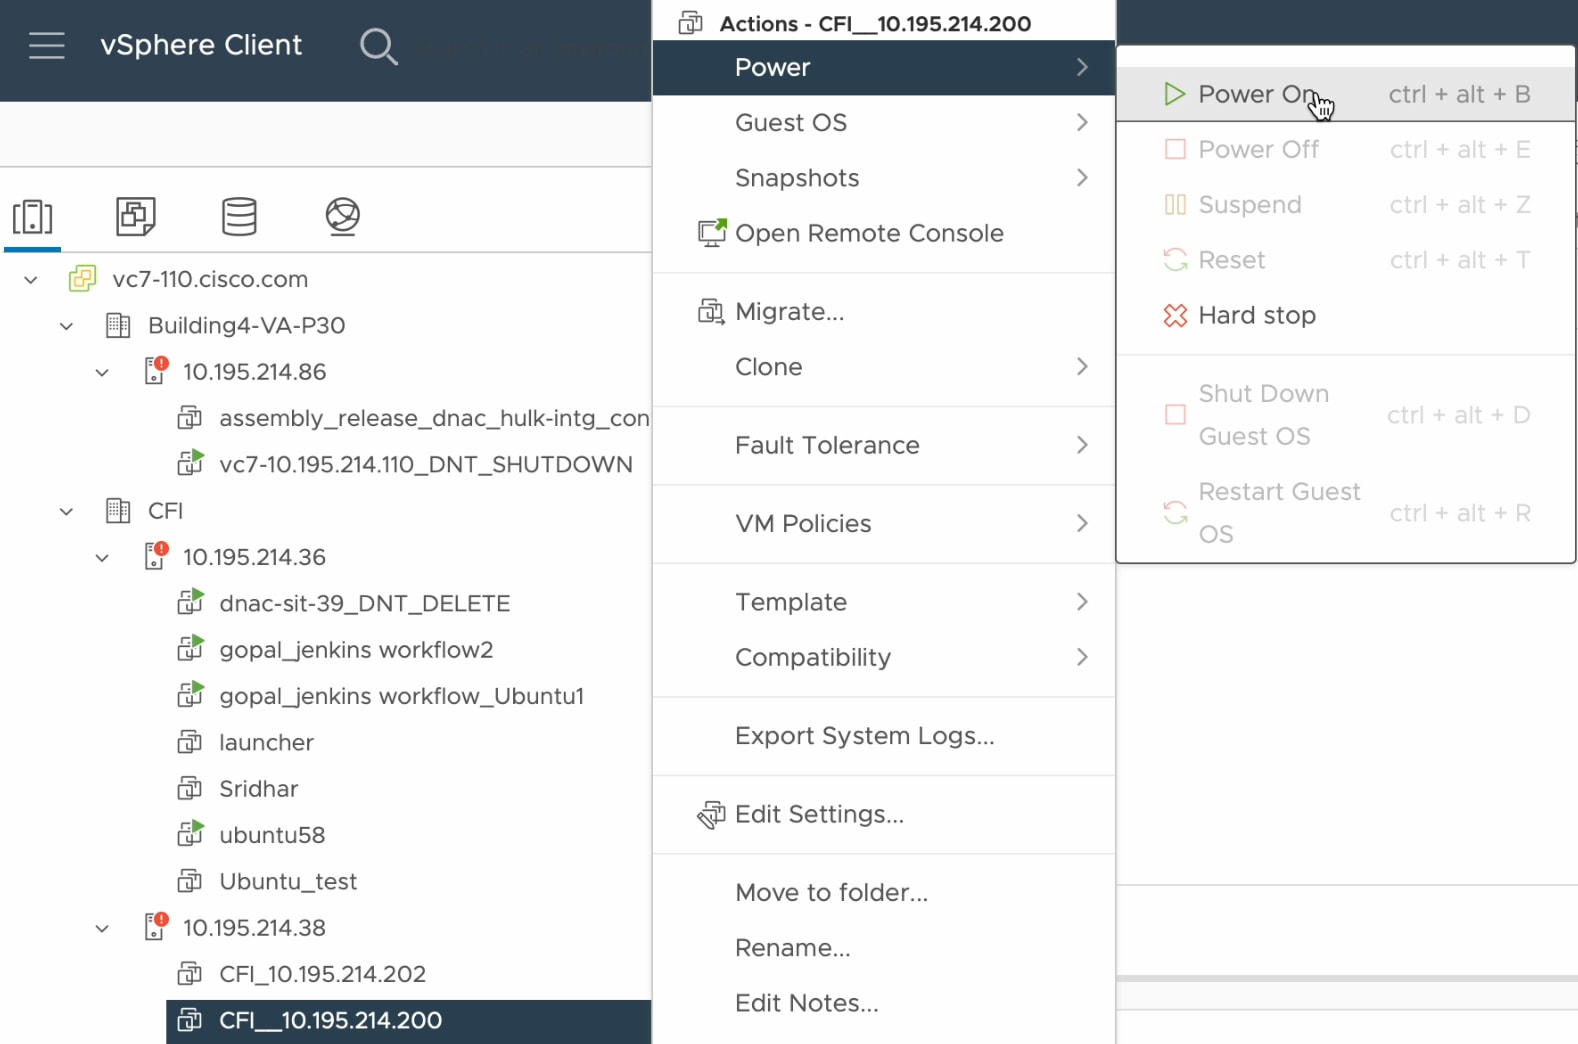
The Power menu shows the available power options for the virtual machine, with power off emphasized.

Step 2

Log in to VMware vSphere.

Step 3

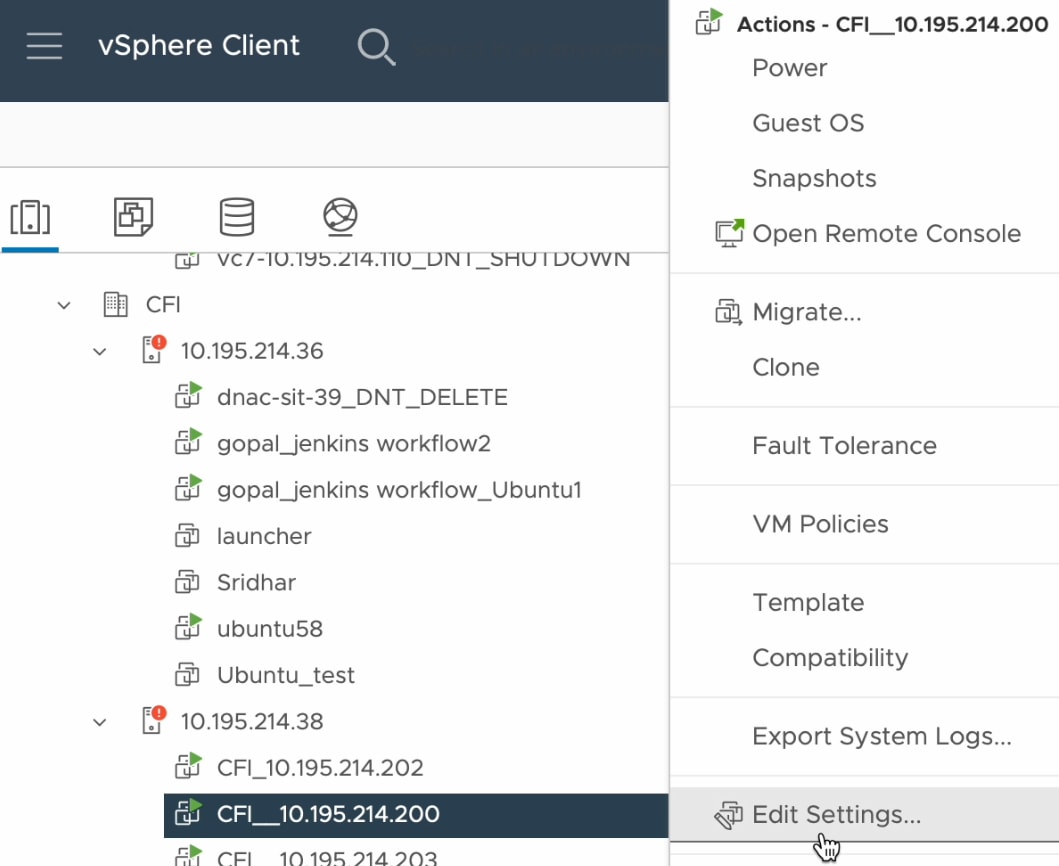
From the vSphere client left pane, right-click the ESXi host and then choose Edit Settings.

The Edit Settings option in the list of available actions.

Step 4

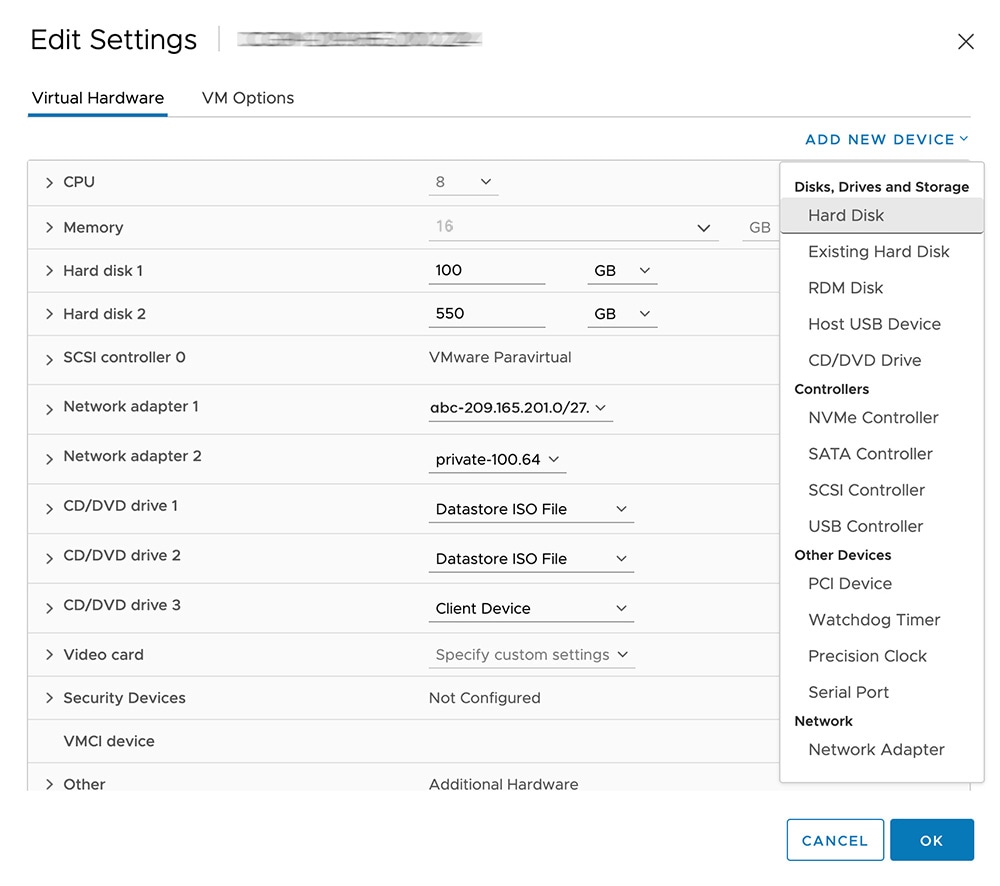
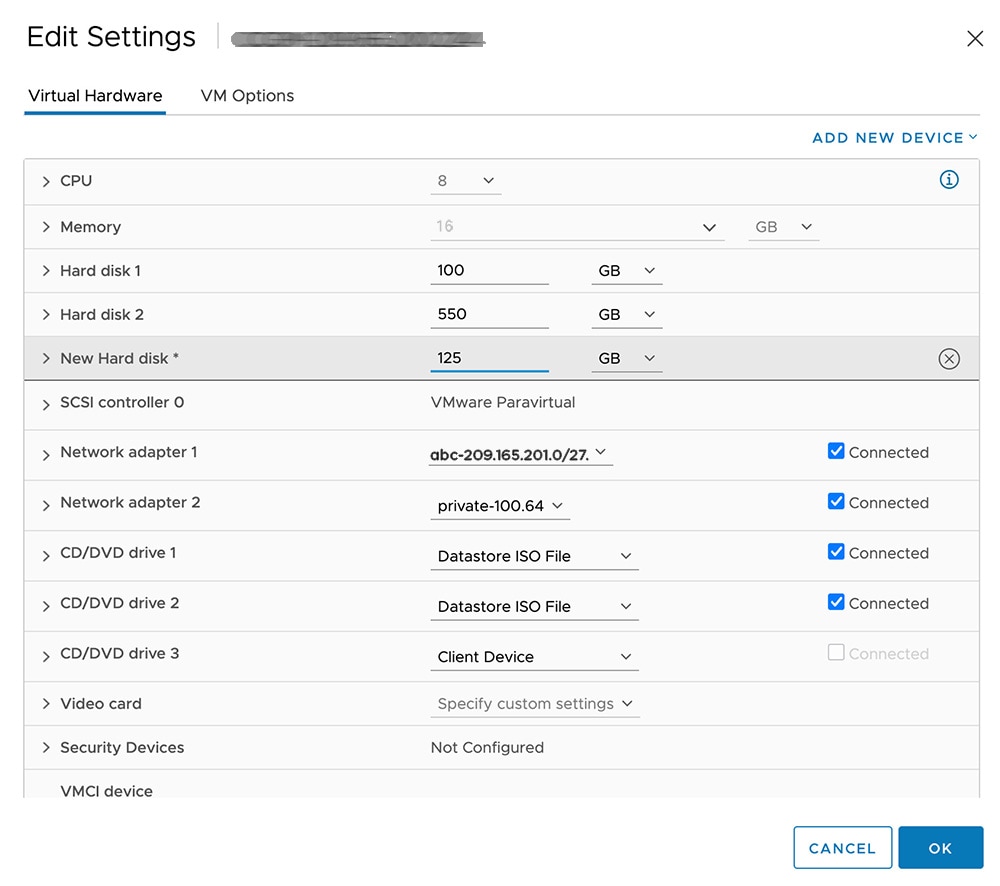
In the Edit Settings dialog box, click Add New Device and then choose Hard Disk.

Step 5

In the New Hard disk field, enter the desired storage size.

Note


For information on the recommended storage space for backup, see Backup storage requirements.

Step 6

Click OK.

Step 7

Power on the appliance's virtual machine.

The Power On option is shown in the list of available actions.

What to do next

You can now configure the added physical disk for backup. For information on how to configure the physical disk, see Configure the location to store backup files.

Add the NFS server

Catalyst Center Global Manager allows you to add multiple Network File System (NFS) servers for backup purposes. Use this procedure to add an NFS server that can be used for the backup operation.

Procedure

Step 1

From the main menu, choose System > Settings > Backup Configuration.

Step 2

Click Add NFS.

Step 3

In the Add NFS slide-in pane, complete these steps:

  1. Enter the Server Host and Source Path in the respective fields.

  2. Choose NFS Version from the drop-down list.

  3. The Port is added by default. You can leave the field empty.

  4. (Optional) Enter the Port Mapper number.

  5. Click Save.

Step 4

Click View NFS List to view the available NFS servers.

The NFS slide-in pane displays the list of NFS servers, along with details.

Step 5

In the NFS slide-in pane, click the ellipsis under Actions to Delete the NFS server.

Note


You can delete the NFS server only when there is no backup job in progress.


What to do next

Configure the added NFS server for backup. For more information, see Configure the location to store backup files.

Configure the location to store backup files

Use this procedure to configure the storage location for backup files.

Before you begin

Make sure that the following requirements are met:

  • Only a user with SUPER-ADMIN-ROLE permissions can perform this procedure.

  • The data backup server must meet the requirements described in Backup server requirements.

Procedure

Step 1

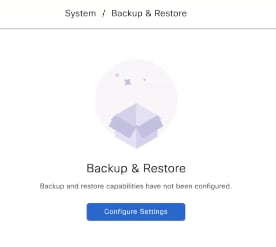
From the main menu, choose System > Backup and Restore.

You can view this window:

Step 2

Click Configure Settings.

Alternatively, choose System > Settings > System Configuration > Backup Configuration.

Step 3

Choose the Physical Disk or NFS server option.

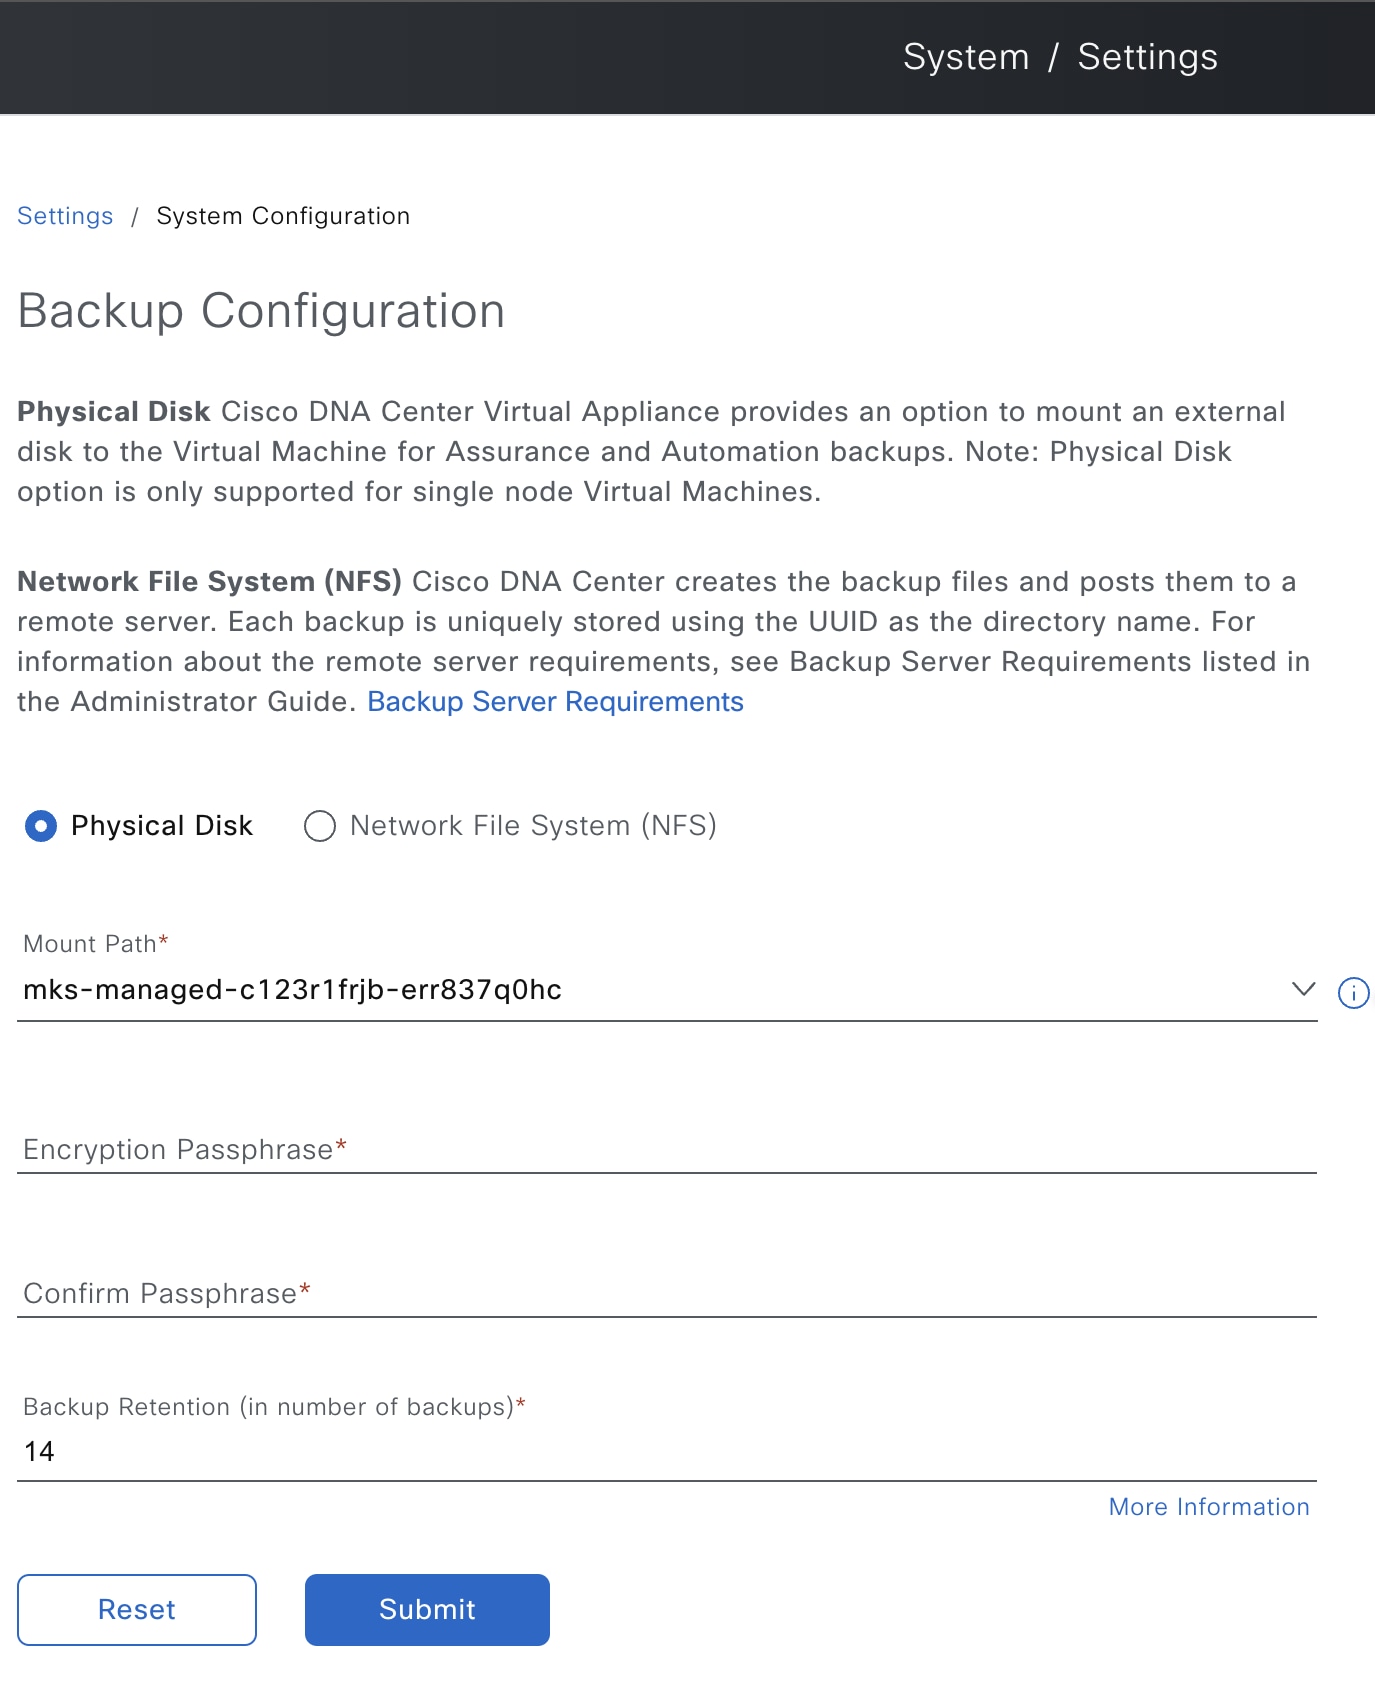
The Backup Configuration page shows the physical disk option, mount path, encryption passphrase, and backup retention.

Step 4

Physical Disk: Catalyst Center Global Manager provides an option to mount an external disk to the virtual machine, to store a backup copy of data. To configure a physical disk, click the Physical Disk radio button and define these settings:

Note


The physical disk option is only supported for single-node virtual machines.

Field Description

Mount Path

Location of the external disk.

Encryption Passphrase

Passphrase used to encrypt the security-sensitive components of the backup. These security-sensitive components include certificates and credentials.

This passphrase is required, and you will be prompted to enter this passphrase when restoring the backup files. Without this passphrase, backup files are not restored.

After the passphrase is configured, if you want to change the passphrase, click Update Passphrase.

Backup Retention

Number of backups for which the data is retained.

Data older than the specified number of backups is deleted.

Step 5

NFS: Catalyst Center Global Manager creates the backup files and posts them to a remote NFS server. For information about the remote server requirements, see Backup server requirements. To configure an NFS backup server, click the NFS radio button and define these settings:

Field Description

Mount Path

Location of the remote server.

Encryption Passphrase

Passphrase used to encrypt the security-sensitive components of the backup. These security-sensitive components include certificates and credentials.

This passphrase is required, and you will be prompted to enter this passphrase when restoring the backup files. Without this passphrase, backup files are not restored.

After the passphrase is configured, if you want to change the passphrase, click Update Passphrase.

Backup Retention

Number of backups for which the data is retained.

Data older than the specified number of backups is deleted.

Step 6

Click Submit.

After the request is submitted, you can view the configured physical disk or NFS server under System > Backup & Restore.


Create a backup

Use this procedure to create a backup of your Catalyst Center Global Manager.

Before you begin
You must configure the backup location. For more information, see Configure the location to store backup files.
Procedure

Step 1

From the main menu, choose System > Backup & Restore.

Step 2

Click Schedule Backup.

The Schedule Backup slide-in pane opens.

Do the following in the Schedule Backup slide-in pane:

  1. Enter a unique name for the backup.

  2. In the Schedule Type area, choose one of the following options:

    • Backup now: To immediately create a backup.

    • Schedule backup daily: To schedule the backup on a daily basis.

    • Schedule backup weekly: To schedule the backup on a weekly basis.

  3. Click Save.

Step 3

Catalyst Center Global Manager begins the backup process. An entry for the backup is added to the Backup & Restore window.

When the backup is complete, its status changes from Creating to Success.


Schedule data backup

You can schedule recurring backups and define the day of the week and the time of day when they will occur.

Before you begin

Make sure that the following requirements are met:

Procedure

Step 1

From the main menu, choose System > Backup & Restore.

The Backup & Restore window is displayed.

Step 2

Click Schedule Backup.

Note


You can schedule a new backup only when there is no backup job in progress.

Step 3

In the Schedule Backup slide-in pane, do the following:

  1. In the Backup Name field, enter a unique name for the backup.

  2. Choose a schedule option:

    • Schedule backup daily: To schedule a daily backup job, choose the time of day when you want the backup to occur.

    • Schedule backup weekly: To schedule a weekly backup job, choose the days of the week and time of day when you want the backup to occur.

  3. Click Save.

The Backup & Restore window displays a banner message that shows the day and time for which the backup is scheduled.

Step 4

(Optional) Click View Upcoming Backups to make any changes to the upcoming schedules. If you don't want the backup to occur on a scheduled date and time, in the Upcoming Schedules slide-in pane, click the toggle button to disable a particular schedule.

Step 5

(Optional) Click Edit Schedule to edit the schedule.

Step 6

(Optional) Click Delete Schedule to delete the schedule.

Step 7

After the backup starts, it appears in the Backup & Restore window. Click the backup name to view the lists of steps executed.

Alternatively, you can click View Activities at the top left of the Backup & Restore window and click the Execution ID. The Create Backup Details slide-in pane opens and shows the list of steps executed.

Step 8

In the Backup & Restore window, click the In Progress, Success, or Failure tab to filter the list of backups to show only those tasks with a status of In Progress, Success, or Failure.

During the backup process, Catalyst Center Global Manager creates the backup database and files. The backup files are saved to the specified location. You are not limited to a single set of backup files, but can create multiple backup files that are identified with their unique names. The status of the backup job changes from In Progress to Success when the process is finished.

Note


If the backup process fails, there is no impact on the Catalyst Center Global Manager operation or its database. The most common reason for a failed backup is insufficient disk space. If your backup process fails, make sure that there is sufficient disk space on the remote server and attempt another backup.


Restore data from backups

Use this procedure to restore backup data from your Catalyst Center Global Manager.

Caution


The Catalyst Center Global Manager restore process restores only the database and files. The restore process does not reflect any changes made since the last backup. This mean that any changes made after the last backup, including adding or deleting controllers, may be lost.


Before you begin

Make sure that the following requirements are met:

  • Only a user with SUPER-ADMIN-ROLE permissions can perform this procedure.

  • You have backups from which to restore data.

When you restore data, Catalyst Center Global Manager enters maintenance mode and is unavailable until the restore process completes. Make sure that you restore data at a time when Catalyst Center Global Manager can be unavailable.

Procedure

Step 1

From the main menu, choose System > Backup & Restore.

If you have created a backup, it appears in the Backup & Restore window.

Step 2

In the Backup Name column, locate the backup that you want to restore.

Step 3

In the Actions column, click the ellipsis and choose Restore.

Step 4

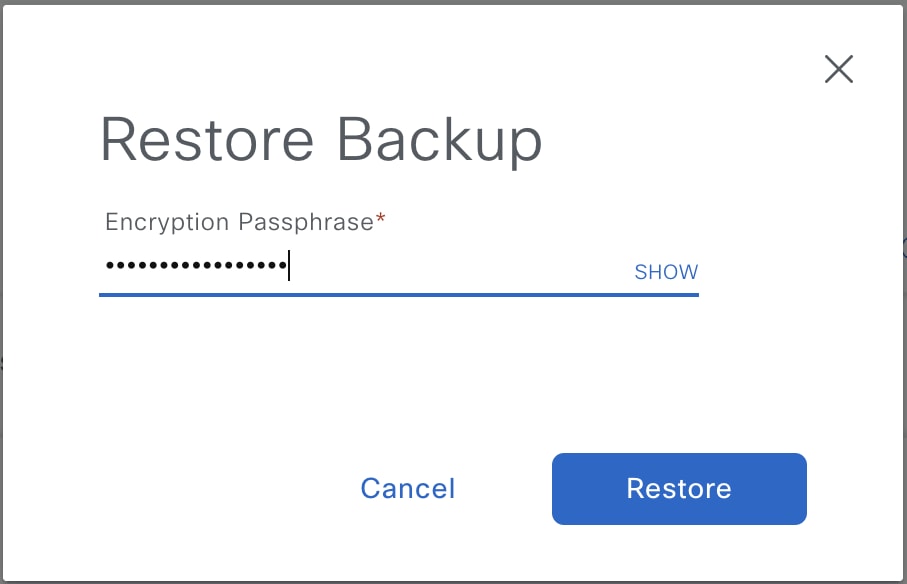
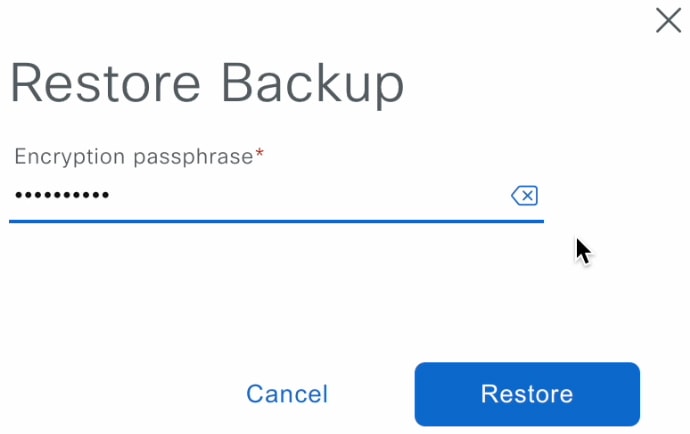
In the Restore Backup dialog box, enter the Encryption Passphrase that you used while configuring the backup location and click Restore.

Enter the passphrase used while configuring backup settings.

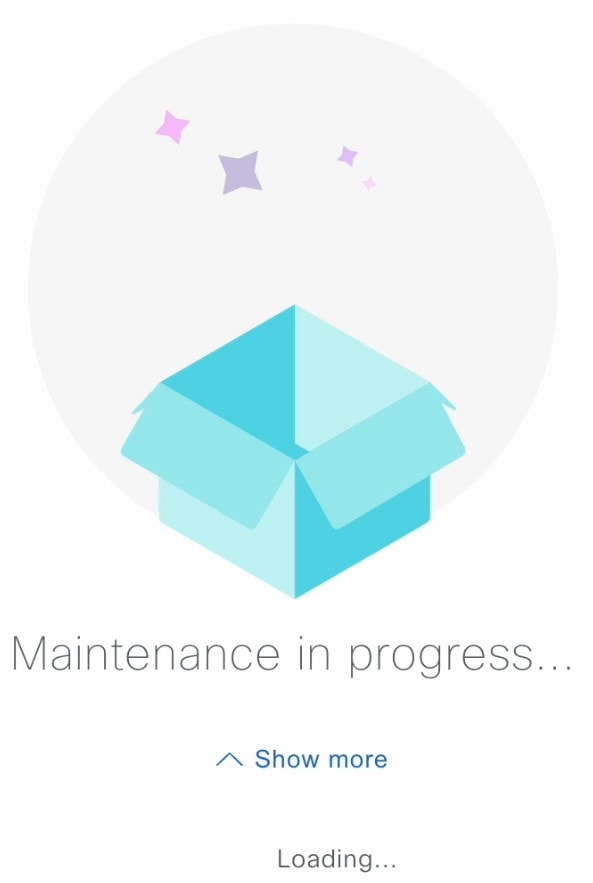
The appliance goes into maintenance mode and starts the restore process.

When the restore operation is complete, its status in the Backup & Restore window table changes to Success.

Step 5

After the restore operation completes, click Log In to log back in to Catalyst Center Global Manager.

Step 6

Enter the admin user's username and password, then click Login.


Restore data from a physical disk for a faulty Catalyst Center Global Manager

Use this procedure to restore data from a physical disk for Catalyst Center Global Manager that has failed or is faulty.

Procedure

Step 1

For your new virtual appliance, complete these steps to configure Catalyst Center Global Manager to use the storage disk that you configured for the faulty virtual appliance:

  1. Power OFF the appliance's virtual machine.

  2. Open a vSphere Client, right-click the Catalyst Center Global Manager virtual machine in the left pane, and then choose Edit Settings.

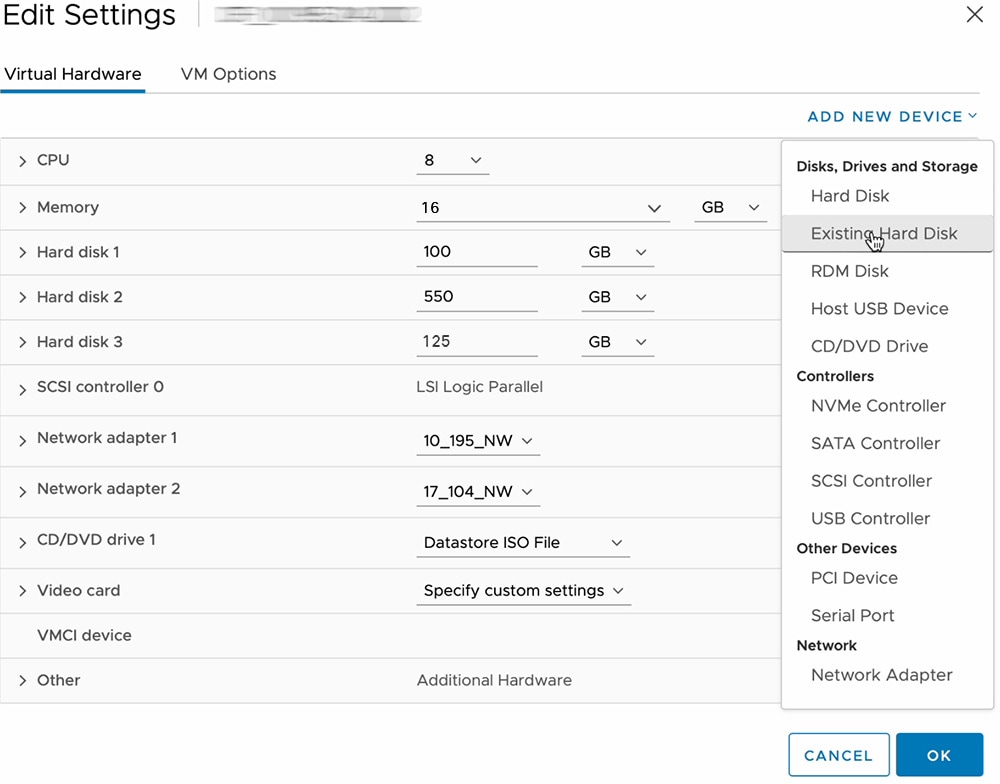
  3. In the Edit Settings dialog box, click Add New Device and then choose Existing Hard Disk.

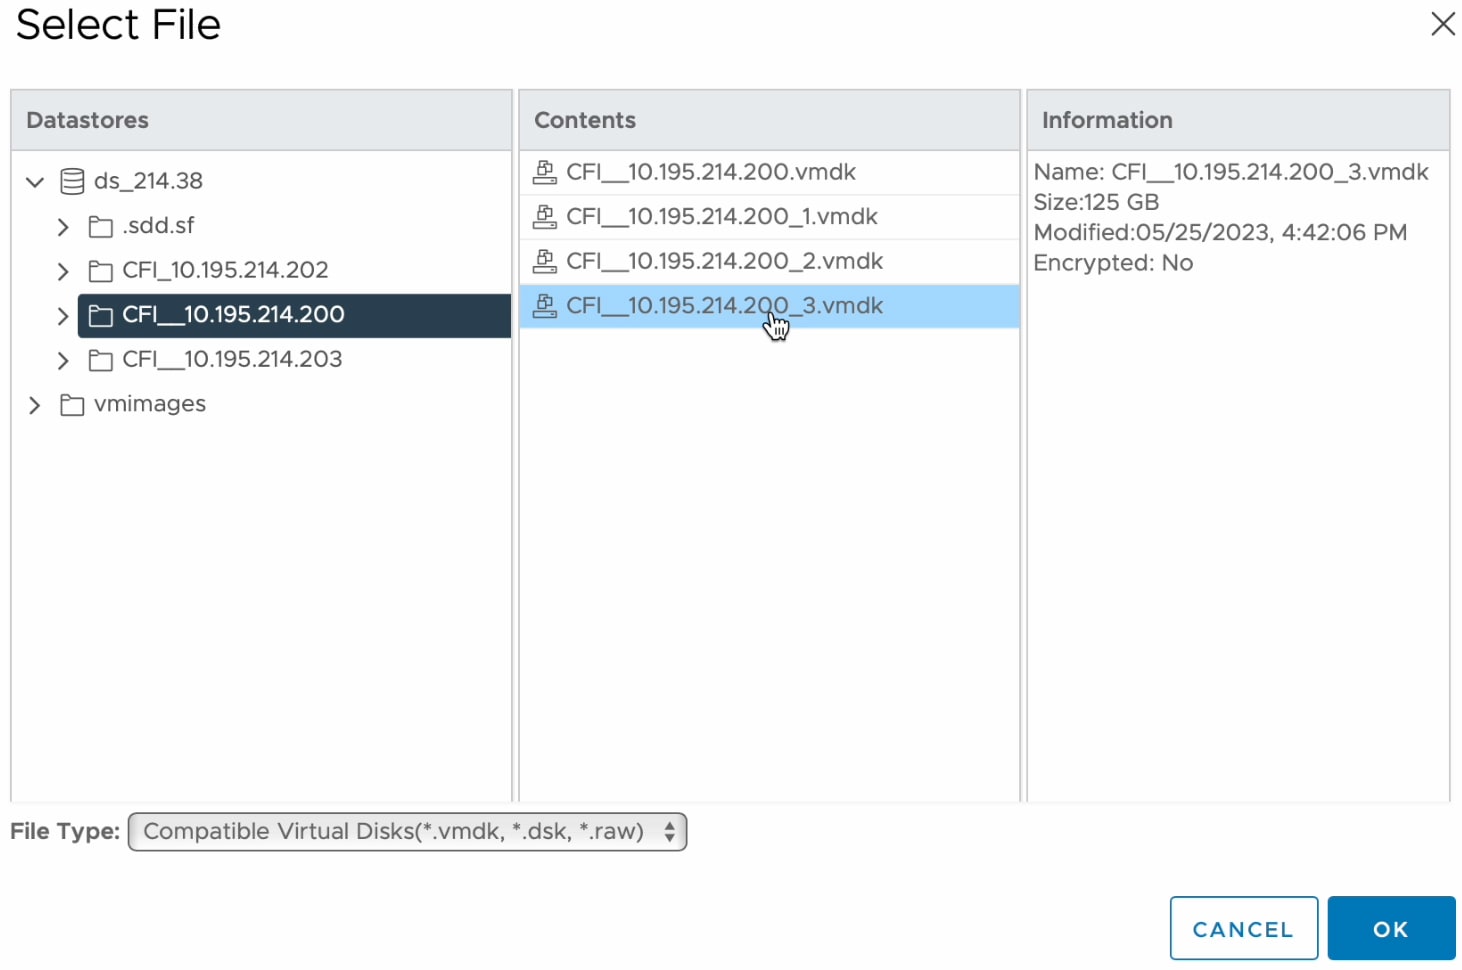
  4. In the Select File dialog box, click your ESXi host, click the storage disk (.vmdk) that was created, and then click OK.

  5. Power on the appliance's virtual machine.

It takes approximately 45 minutes for all the services to restart.

Note


After the virtual machine comes back up, run the magctl appstack status command to confirm that the services are running.

Step 2

To configure the storage location for the backup, complete these steps:

  1. From the Catalyst Center Global Manager menu, choose System > Settings > System Configuration > Backup Configuration.

  2. Click the Physical Disk radio button.

  3. Choose the physical disk from the Mount Path drop-down list.

  4. Enter the passphrase that will be used to encrypt the security-sensitive components of the backup (such as certificates and credentials).

    Important


    Make sure that you don't lose this passphrase. You'll need to enter it later in the succeeding steps and won't be able to restore the backup you're about to create without it.

  5. Set how long backup files are kept before they are deleted.

  6. Click Submit.

Step 3

To restore the backup, complete these steps:

  1. From the Catalyst Center Global Manager menu, choose System > Backup & Restore.

  2. Locate the backup in the Backup & Restore window, click the ellipsis under Actions column, and choose Restore.

    This image displays the Restore option for the backup created.
  3. Enter the same encryption passphrase that you entered in the preceding step, and click Restore.

    The appliance goes into maintenance mode and starts the restore process.

    When the restore operation is complete, its status in the Backup & Restore window changes to Success.

  4. After the restore operation completes, click Log In to log back in to Catalyst Center Global Manager.

  5. Enter the admin user's username and password, then click Login.


Restore data from an NFS server for a faulty Catalyst Center Global Manager

Use this procedure to restore data from an NFS server for Catalyst Center Global Manager that has failed or is faulty.

Procedure

Step 1

For your new virtual appliance, complete these steps to configure Catalyst Center Global Manager to use the NFS server that you configured for the faulty virtual appliance:

  1. From the Catalyst Center Global Manager menu, choose System > Settings > System Configuration > Backup Configuration.

  2. Click the NFS radio button.

  3. Choose the NFS server from the Mount Path drop-down list.

  4. Enter the passphrase that will be used to encrypt the security-sensitive components of the backup (such as certificates and credentials).

    After the passphrase is configured, if you want to change the passphrase, click Update Passphrase.

    Important


    Make sure that you don't lose this passphrase. You'll need to enter it later in the succeeding steps and won't be able to restore the backup you're about to create without it.

  5. Set how long backup files are kept before they are deleted.

  6. Click Submit.

Step 2

To restore the backup, complete these steps:

  1. From the Catalyst Center Global Manager menu, choose System > Backup & Restore.

  2. Locate the backup in the Backup & Restore window, click the ellipsis under the Actions column, and choose Restore.

  3. Enter the same encryption passphrase that you entered in the preceding step, and click Restore.

    The appliance goes into maintenance mode and starts the restore process.

    When the restore operation is complete, its status in the Backup & Restore window changes to Success.

  4. After the restore operation completes, click Log In to log back in to Catalyst Center Global Manager.

  5. Enter the admin user's username and password, then click Login.


System settings

To start using Catalyst Center Global Manager, you must first configure the system settings. This allows the server to communicate outside the network, ensures secure communications, authenticates users, and supports other key tasks. Use the procedures in this chapter to configure the system settings.


Note


Any changes that you make to the Catalyst Center Global Manager configuration—including changes to the proxy server settings—must be done from the Catalyst Center Global Manager GUI.


The Catalyst Center Global Manager Settings page provides you with these details:

  • Certificates

    • System Certificates- Helps you to view information about the server's currently active SSL certificate or information about how to replace it.

      For more information on security best practices and managing certificates in Catalyst Center Global Manager, see Cisco Catalyst Center Security Best Practices Guide.

  • External Services

    • Destinations- Allows you to configure these types of destinations to deliver event notifications from Catalyst Center Global Manager: webhook, email, syslog, and SNMP.

      To configure REST Endpoint, email settings, syslog server, or SNMP trap server, go to the main menu, choose System > Settings > External Services > Destinations.

    • Cisco Catalyst Cloud- Allows you to register Catalyst Center Global Manager with Cisco Catalyst Cloud to access and download Catalyst Center Global Manager configurations.


      Note


      The settings page will show the Catalyst Center Global Manager configuration claimed through First Time Setup workflow.


      De-registering will unclaim the Catalyst Center Global Manager profile and unenroll all controllers registered on the server. Following this, the Catalyst Center Global Manager will display the absence menus for controllers.

  • System Configuration

    • System Health- Allows you to update Catalyst Center Global Manager with most recent validation catalog. The validation catalog serves as a repository of validation sets, which define the specific checks or tests to be performed.

      The purpose of updating the Validation Catalog in Catalyst Center Global Manager is to keep the set of validation checks or tests current, accurate, and relevant. This update refreshes the repository of validation criteria that the validation tool uses to perform system checks and enabling the detection of new issues.

    • Proxy- Allows you to configure the system proxy to access the internet.

    • Debugging Logs- Use this form to configure the logging of internal processes and errors.

    • Backup Configurations- Allows you to configure backup mount path, encryption passphrase and data retention.

    • Authentication API Encryption- Allows you to configure AES Encryption settings.

    • Integration Settings- Allows you to configure platform details

    • Login Message- This shows a message for users when they log in.

  • Terms and Conditions

    • Product Offer- This provides the general terms and conditions for Catalyst Center Global Manager. Catalyst Center Global Manager is governed solely by the Cisco General Terms (formerly "End User License Agreement").

  • Trust and Privacy

    • Account Lockout- Manages user login attempts, account lockout period, and login retries.

    • Password Expiry- Sets the user password expiry check.

    • IP Access Control- Configures IP addresses list for access restriction.

    • Product Telemetry- Provides product telemetry terms for Catalyst Center Global Manager. Catalyst Center controller collects Systems Information (formerly "Product Usage Telemetry") to improve your product experience. Catalyst Center Global Manager does not collect or process Systems Information.

Users and roles

The Catalyst Center Global Manager uses both users and roles to manage access. Each user is assigned roles to access controller functionality.

  • User Management- The Catalyst Center Global Manager uses users, roles and access groups to manage access. A user is mapped to an access group to determine the scope and permission(s).

  • Role Based Access Control- Role-Based Access Control (RBAC) in Catalyst Center Global Manager currently supports only the default roles: super-admin-role, observer-role, and network-admin-role. Custom role creation is not supported. Additionally, the user experience in Catalyst Center Global Manager may be impacted if there is a mismatch in permissions for the same user between Catalyst Center Global Manager and Catalyst Center. For example, if a user in Catalyst Center Global Manager does not have identical privileges in Catalyst Center due to site-based restrictions or custom roles, the Catalyst Center Global Manager may display limited data based on the user's access privileges.

    Also, accessing Catalyst Center Global Manager with a custom role or a site-based user from Catalyst Center is currently not supported, which may result in a suboptimal user experience.

    • The SUPER-ADMIN-ROLE has full control over the Catalyst Center Global Manager deployment, with all access permissions enabled.

    • The OBSERVER-ROLE has read-only access and cannot view certain sensitive data within the system settings.

    • The NETWORK-ADMIN-ROLE is a general-purpose role that does not have the capability to alter system configurations.

    On installation of Catalyst Center Global Manager, a user with super-admin privilege is created. The user in super-admin role will have the ability to create local users on Catalyst Center Global Manager.

  • External Authentication- Catalyst Center Global Manager supports external Authentication, Authorization and Accounting (AAA) servers for access control. If you are using an external server for authentication and authorization of external users, you should enable external authentication in Catalyst Center Global Manager. The default AAA attribute setting matches the default user profile attribute.

    Catalyst Center Global Manager enables external authentication with either AAA–RADIUS/TACACS or Cisco ISE server type. The external authentication process disables local user authentication.


    Note


    If external authentication is enabled on a specific Catalyst Center and it is integrated with Catalyst Center Global Manager, data specific to this controller is not fetched if the user has not logged in at least once using their external authentication credentials. Consequently, any cross-launch to that Catalyst Center fails. Users must log in to Catalyst Center at least once before they can view any controller-specific data in Catalyst Center Global Manager or perform a cross-launch to that Catalyst Center.