The documentation set for this product strives to use bias-free language. For the purposes of this documentation set, bias-free is defined as language that does not imply discrimination based on age, disability, gender, racial identity, ethnic identity, sexual orientation, socioeconomic status, and intersectionality. Exceptions may be present in the documentation due to language that is hardcoded in the user interfaces of the product software, language used based on RFP documentation, or language that is used by a referenced third-party product. Learn more about how Cisco is using Inclusive Language.
Log into the web UI by entering the following URL in the browser’s address bar:
https://<Crosswork Management Network Virtual IP (IPv4)>:30603/
https://[<Crosswork Management Network Virtual IP (IPv6)>]:30603/
Note
The IPv6 address in the URL must be enclosed with brackets.
In the Log In window, enter the username and password configured during installation and click Log In.
Self-signed certificate: At first-time access, some browsers display a warning that the site is untrusted. When this happens,
follow the prompts to add a security exception and download the self-signed certificate from the server. After downloading
the certificate, the browser accepts the server as a trusted site in all future login attempts.
CA signed certificate: For production use, a CA signed certificate may be installed and is recommended to avoid a warning
that the site is untrusted.
Note
For information on installing CA signed certificates, see the Manage Certificates topic in Crosswork Network Controller Administration Guide.
Dashboard
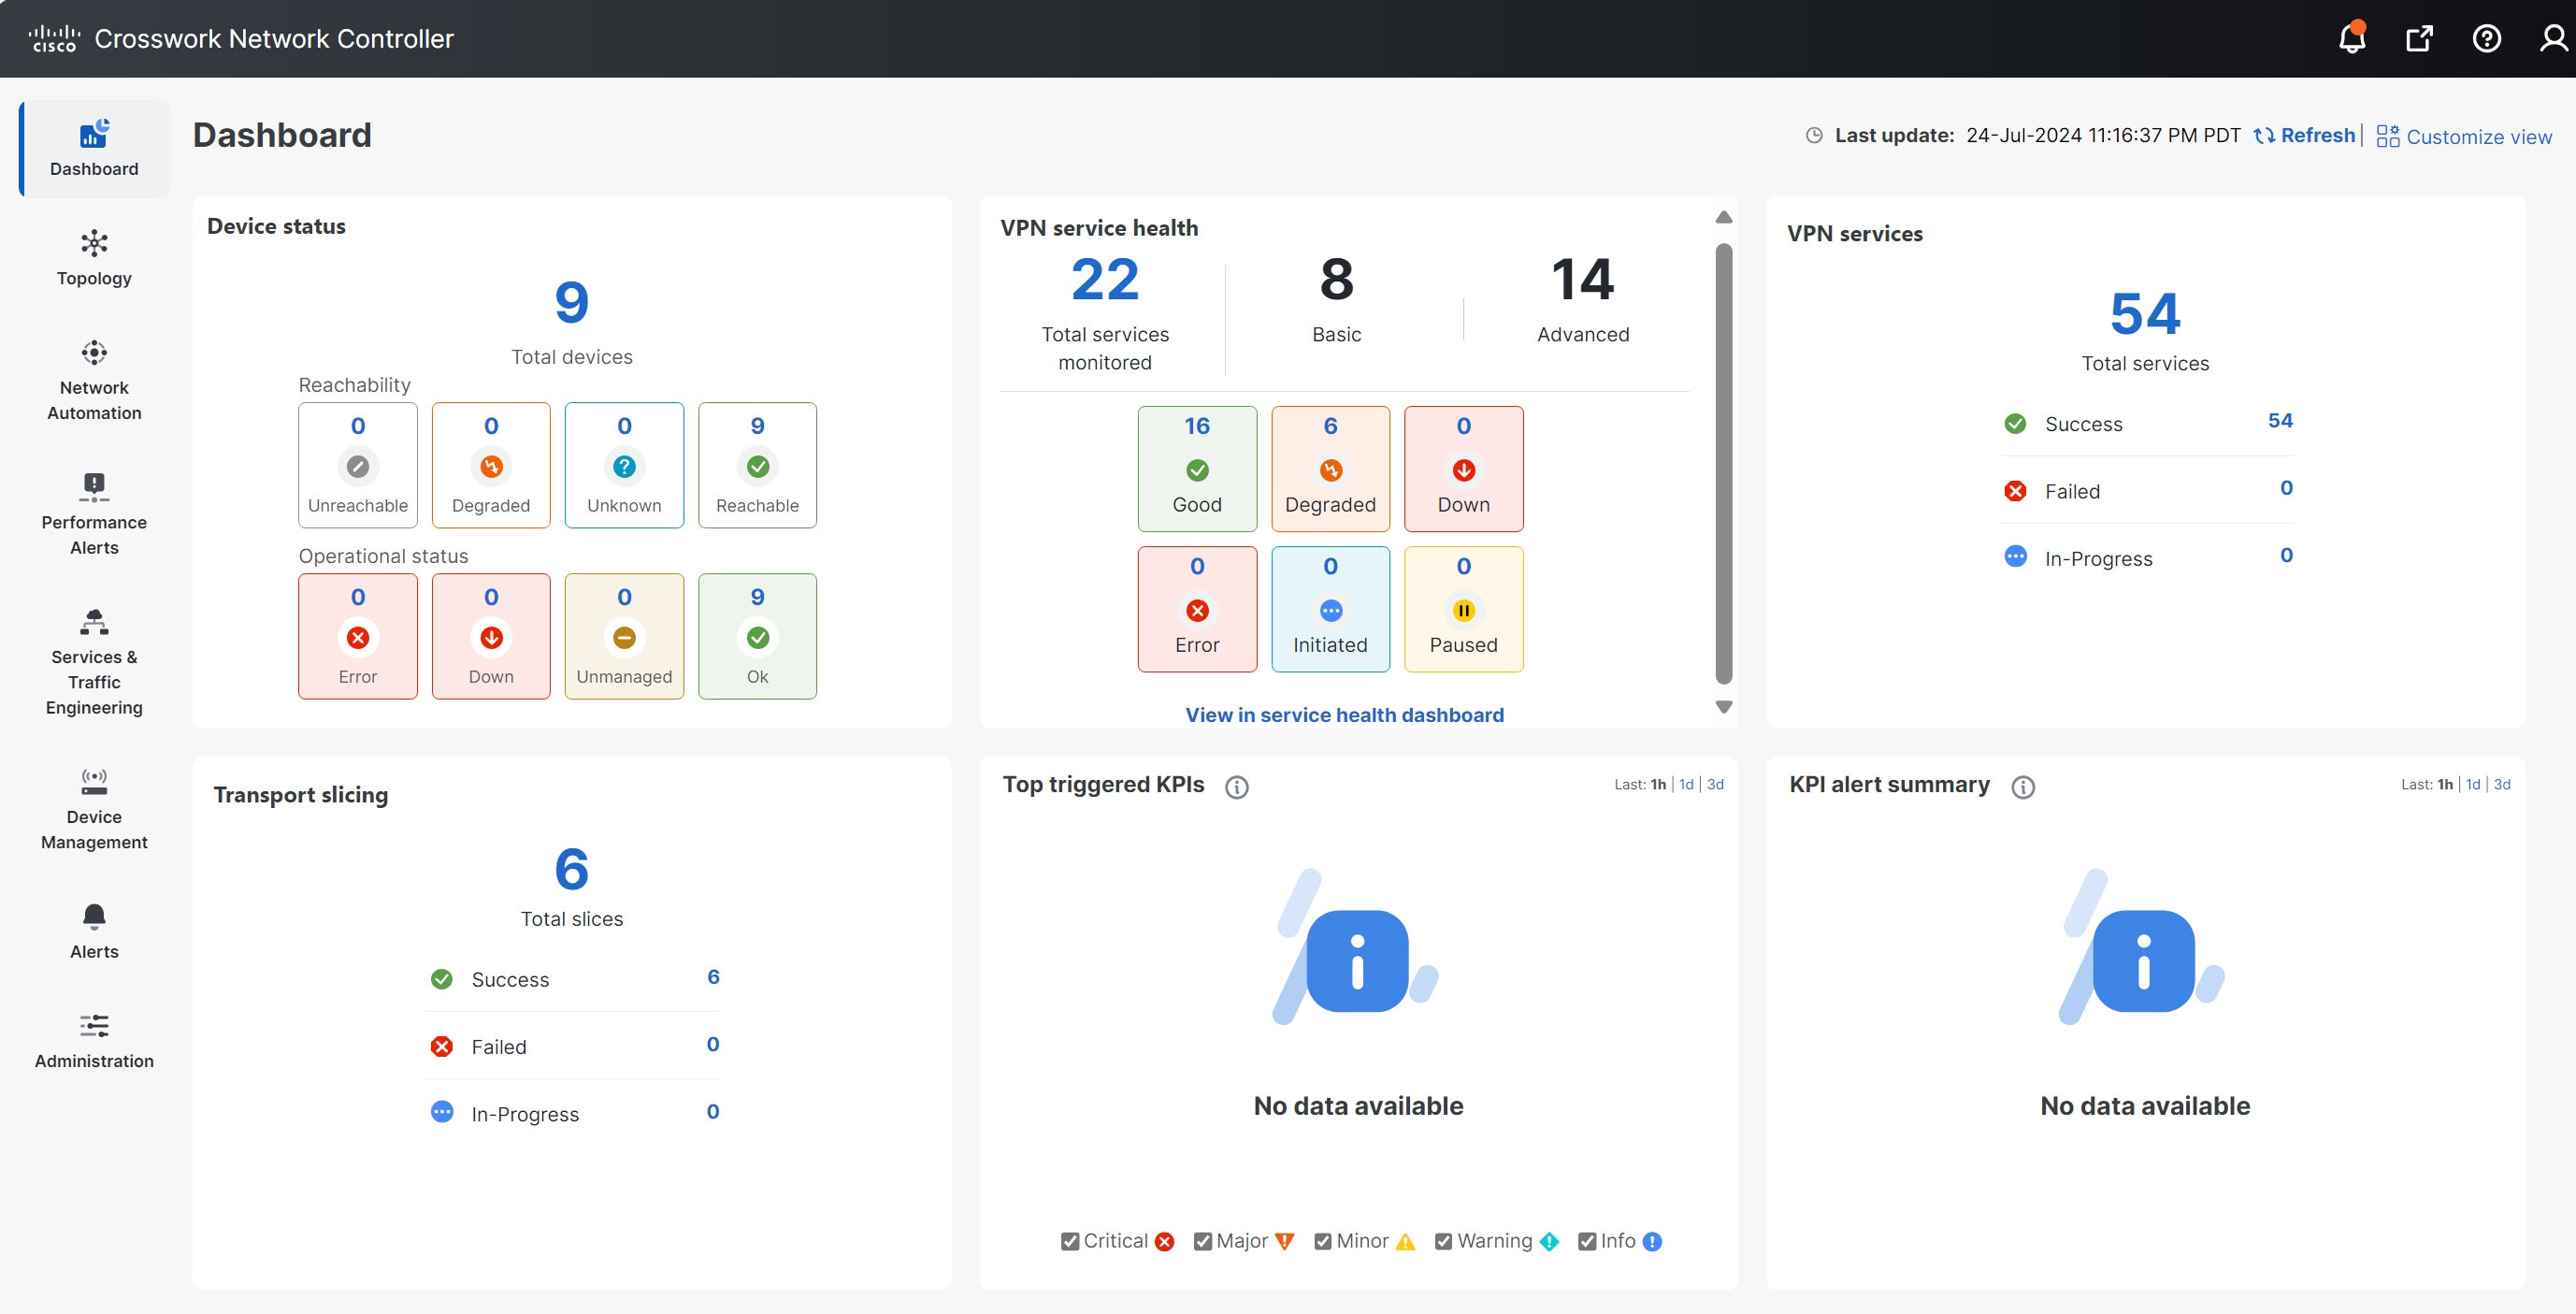
After successful login, the Home page opens. The Home page displays the dashboard, providing an at-a-glance operational summary
of the managed network. The dashboard is made up of a series of dashlets. The specific dashlets included in your dashboard
depend on which Cisco Crosswork applications you have installed. Links in each dashlet allow you to drill down for more details.
Figure 1. Dashboard Home Page
Note
Your Dashboard may differ from this screen capture, which displays optional components you may not have installed.
Navigation
The main menu along the left side of the window provides access to all features and functionality in the Crosswork Network
Controller, as well as to device management and administrative tasks. The Dashboard, Topology, Services & Traffic Engineering,
Device Management, and Administration menu options are available when all native Crosswork Network Controller components are
installed. Additional menu options are available in the main menu depending on which Cisco Crosswork add-on applications are
installed.
Dashboard
The home page contains the dashboard, as described in the Dashboard topic.
Topology
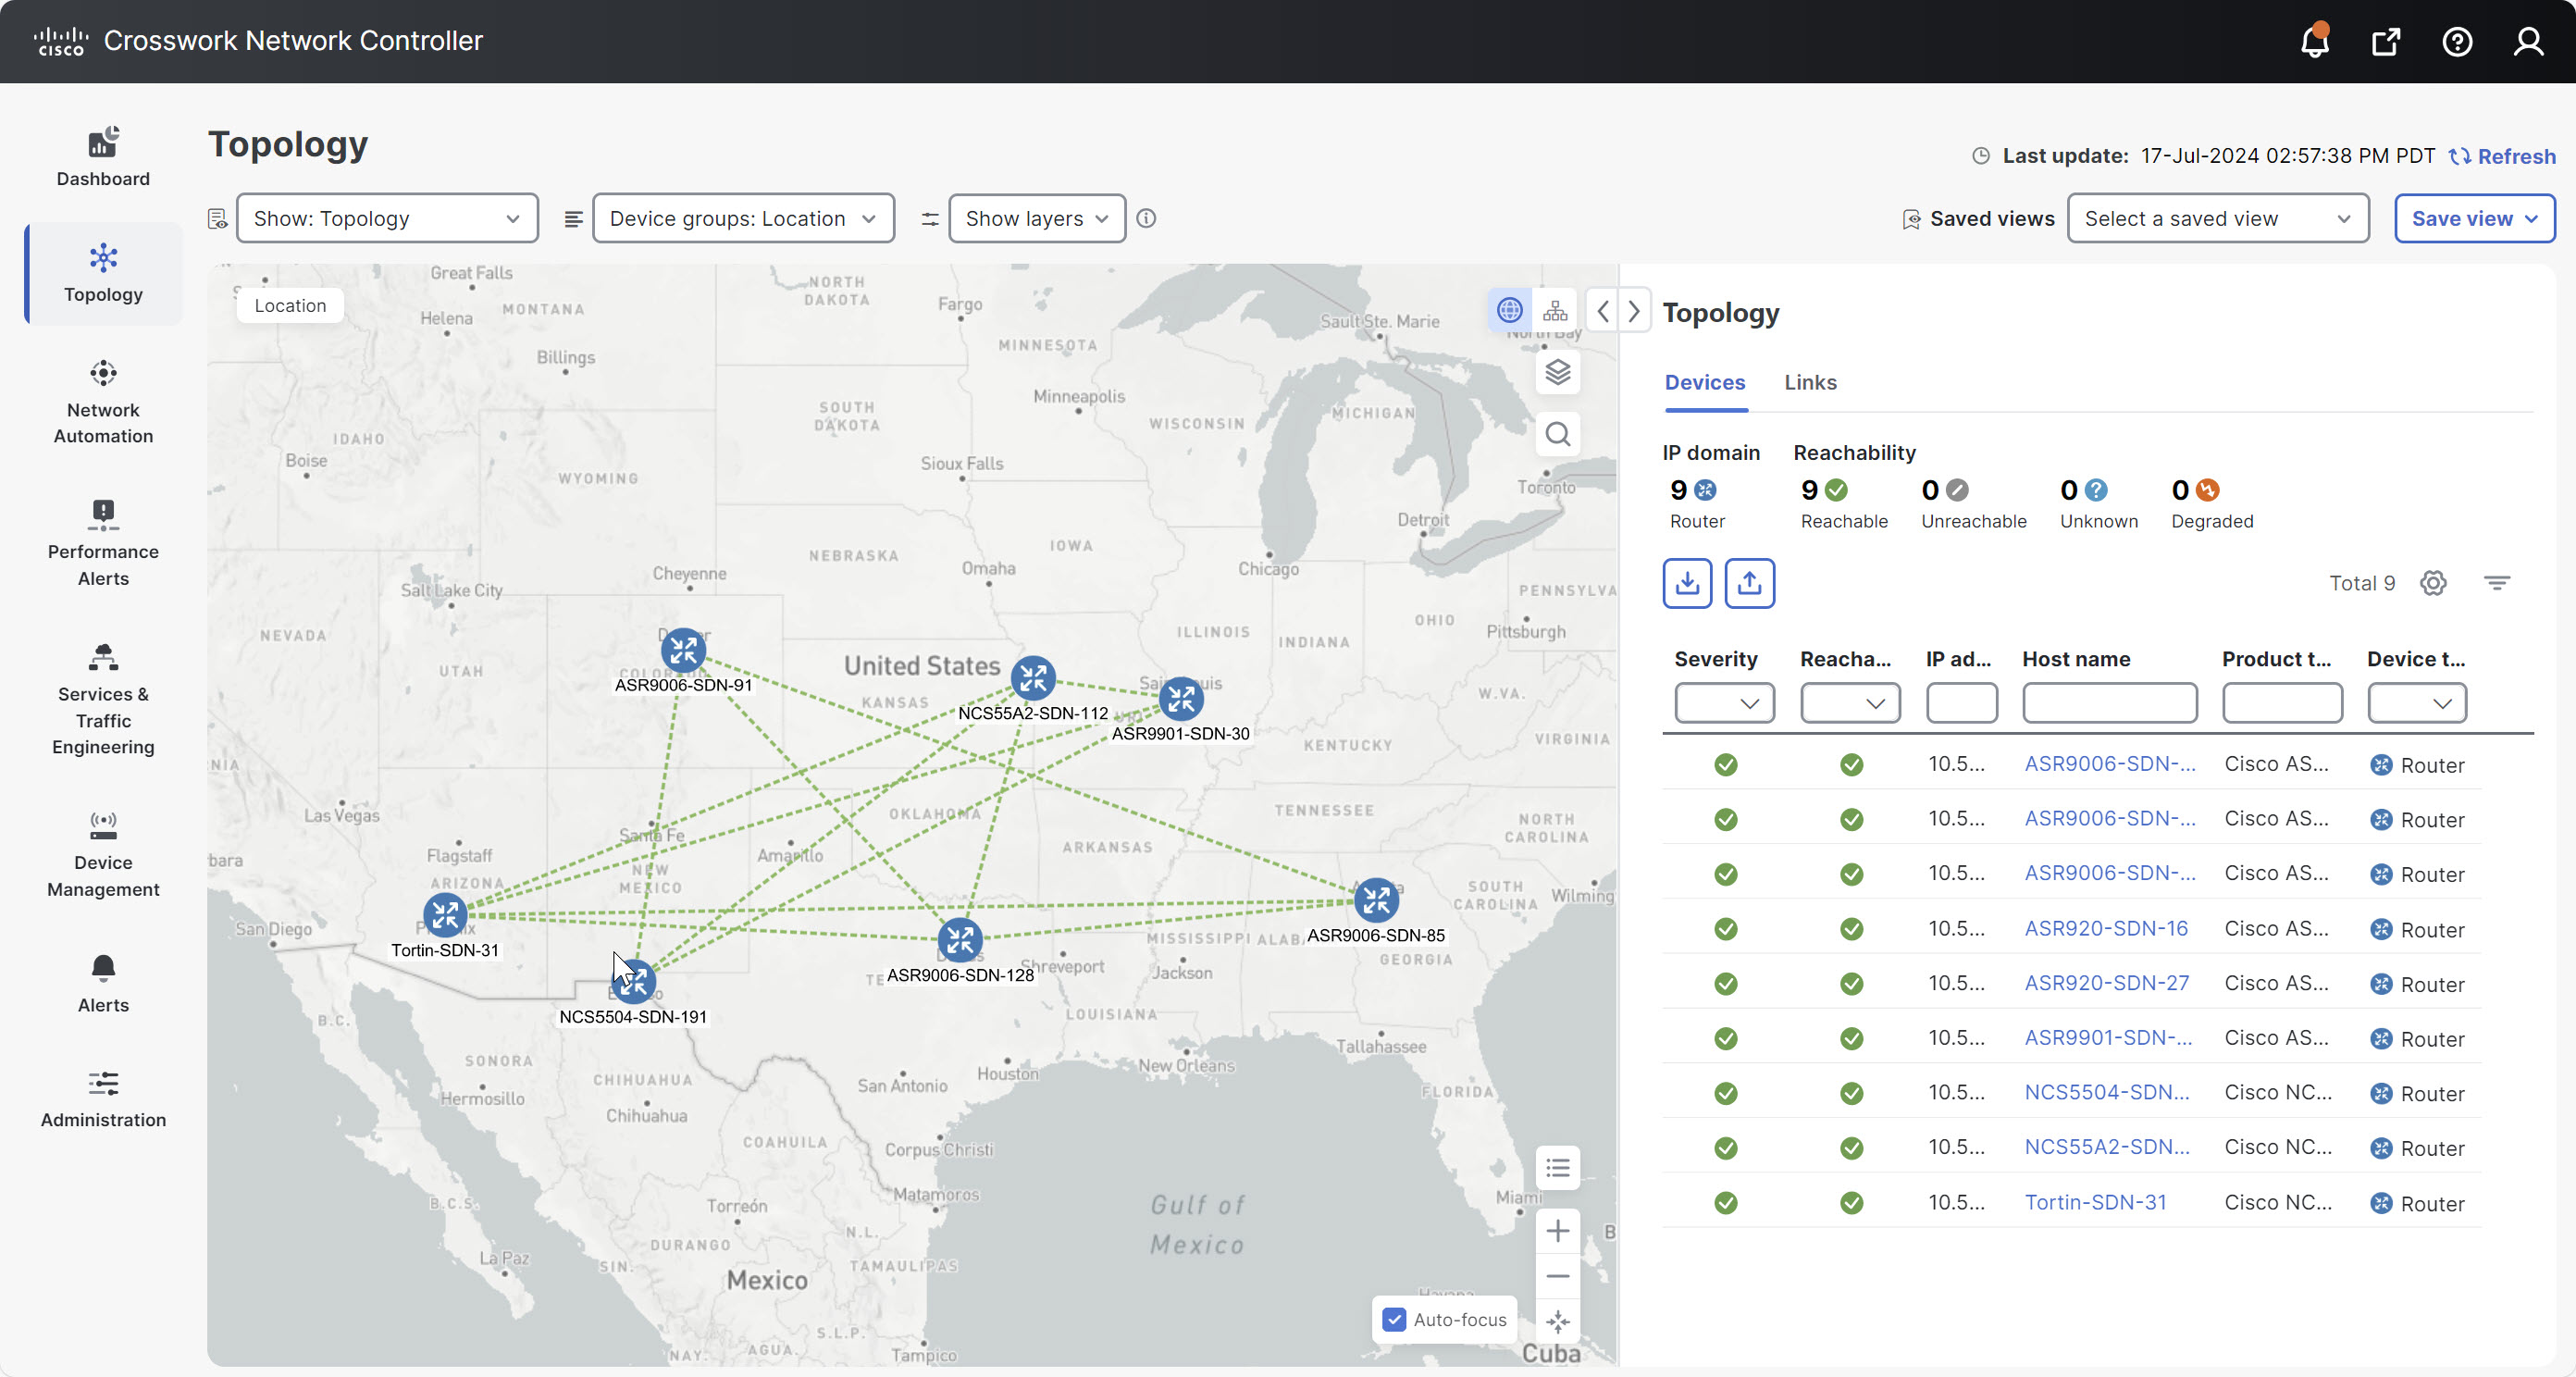
Figure 2. Topology Page
Users can display the network device and link topology on a geographical (geo) or logical map. The geo map shows single devices,
device groups, clusters, links, and tunnels superimposed on a world map. Each device's location on the map reflects its GPS
coordinates (longitude and latitude). Operators supply this location information in CSV or KML files uploaded using Cisco
Crosswork UI or Device UI. The logical map shows devices and their links positioned according to a user-selected algorithm
without considering their physical location.
The Topology page offers options to customize the data display based on the installed applications. You can select Topology,
Traffic Engineering, VPN Services, or Transport Slicing using the Show drop-down list. The map can be filtered to display
device groups, devices, and links for specific layers. In addition to quickly visualizing device status and health, you can
view detailed information about a device and its associated links by selecting the device in the table or on the map. A global
topology search can also be done using device names, location, or civic location.
Network Automation
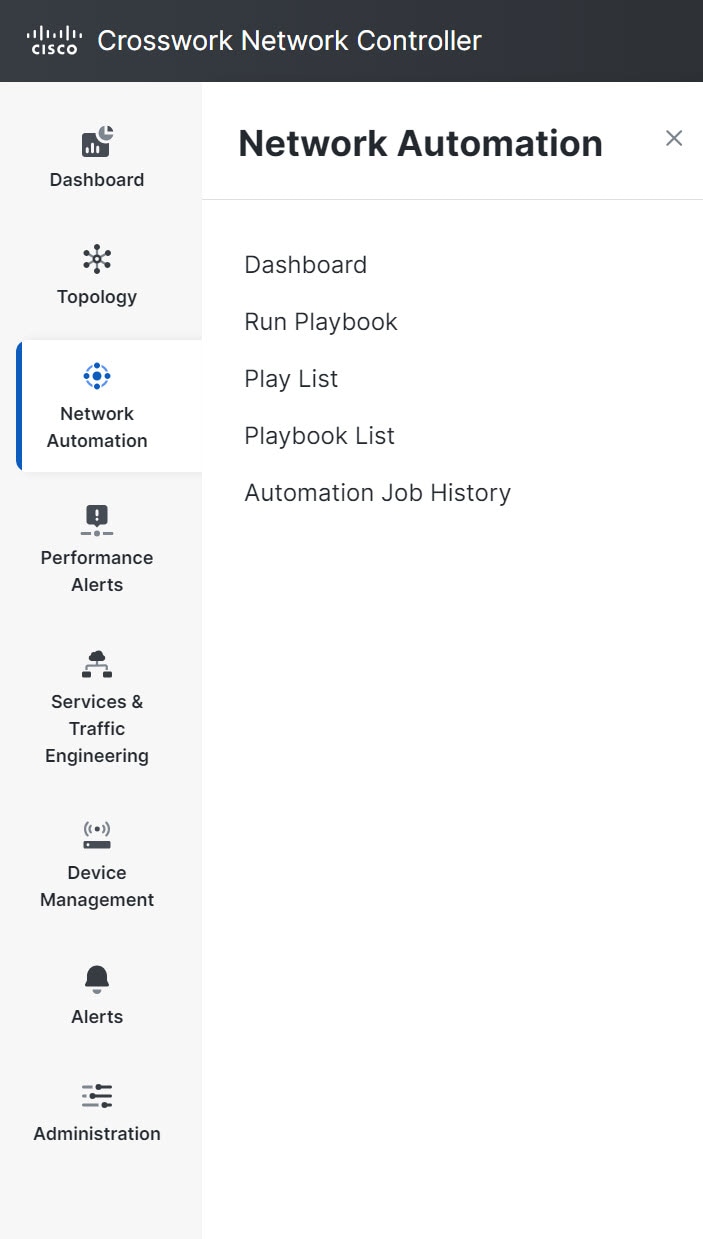
Figure 3. Network Automation Menu
The Network Automation menu facilitates the automation of deploying network changes. Using Playbooks, which are comprised
of YAML-written Plays, you can define automation tasks to achieve the desired network states. The Dashboard provides an overview
of all Playbook-related activity, including pre-defined and custom Playbooks, and allows for the initiation of Playbook runs.
Playbooks can be executed in various modes, such as Dry Run, Single Stepping, or Continuous, to align with specific requirements.
Furthermore, you can view, create, import, export, and manage custom Plays and Playbooks as needed. It is also possible to
schedule future Playbook runs as jobs and monitor their progress for diagnosing failures. Additionally, Crosswork Network
Controller allows for the manual execution of KPI-linked Playbooks and the automatic running of one or more KPI-linked Playbooks
when the associated KPI raises an alert of sufficient severity.
Performance Alerts
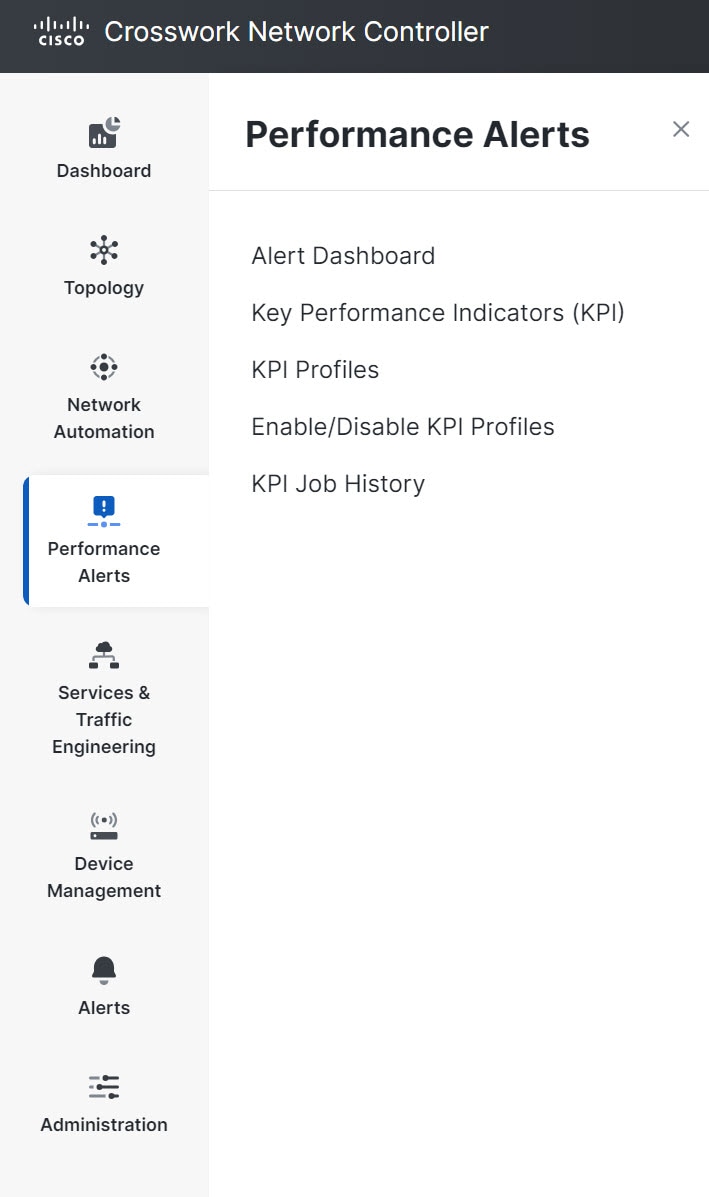
Figure 4. Performance Alerts Menu
The Performance Alerts menu offers real-time, telemetry-based Key Performance Indicator (KPI) monitoring and intelligent alerting.
The alerts are based on predefined templates or user-defined logic and can be tied to the Playbooks to implement closed-loop
automation workflows. The Alert Dashboard offers a summary of device health information based on real-time network state events.
With Performance Alerts, you have a complete access to Cisco-supplied and user-created KPIs. You can also create and manage
KPI Profiles by grouping KPIs and configuring parameters relevant to monitoring specific types of devices based on their purpose
(for example, environmental or health check). You can also enable or disable KPI profiles on desired devices and monitor the
progress of each KPI job deployment.
You can also link your KPIs to the Change Automation application's Playbooks.
Services & Traffic Engineering
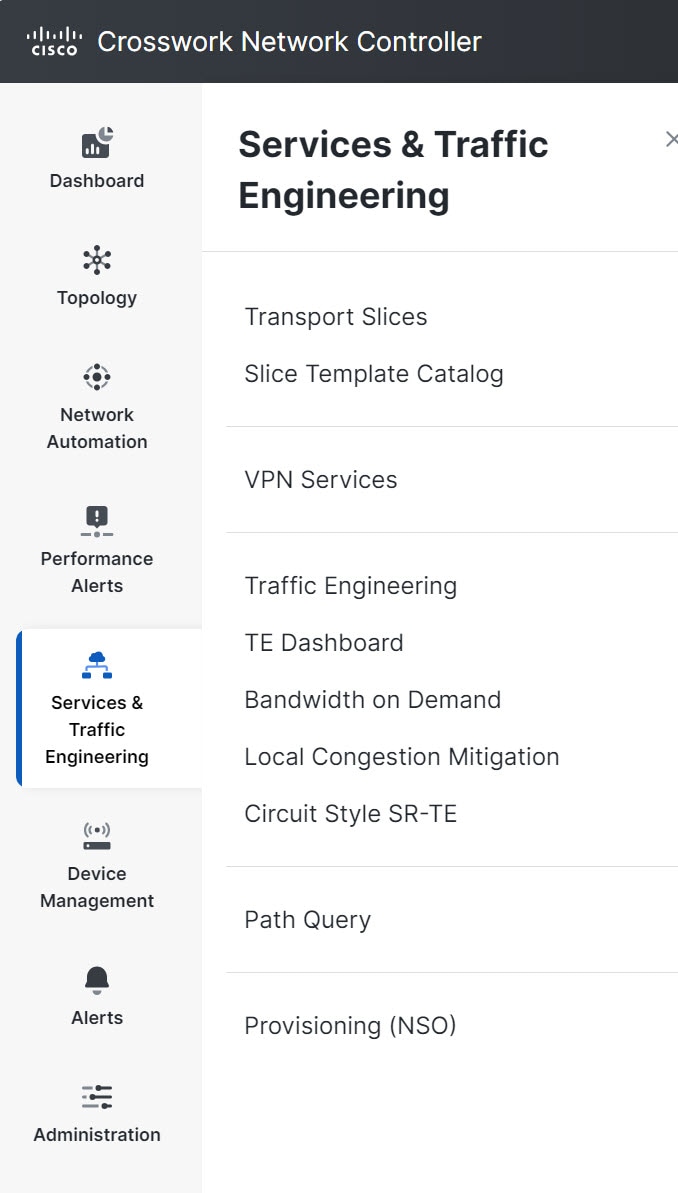
Figure 5. Services & Traffic Engineering Menu
The Services & Traffic Engineering menu provides access to VPN and transport provisioning and visualization functionality,
bandwidth management functionality, and access to the configuration pages used to enable a Feature Pack (LCM and BWoD). For
more information, see Crosswork Network Controller 7.0 Traffic Engineering and Optimization Guide.
Choose VPN services or Traffic Engineering to see managed VPN services, SRv6 policies, or SR-TE policies/RSVP-TE tunnels within the context of a logical or geographical
map.
Choose Provisioning (NSO) to access the provisioning UI rendered from the Cisco Network Services Orchestrator models. Here, you can create L2VPN and
L3VPN services, SR-TE policies, SRv6 policies, SR ODN templates, and RSVP-TE tunnels. You can also create the resources required
for these services and policies, such as resource pools, route policies for L2VPN and L3VPN services, and SID lists for SR-TE
policies. SR-TE policies and RSVP-TE tunnels can be attached to VPN services to define and maintain SLAs by tracking network
changes and automatically reacting to optimize the network.
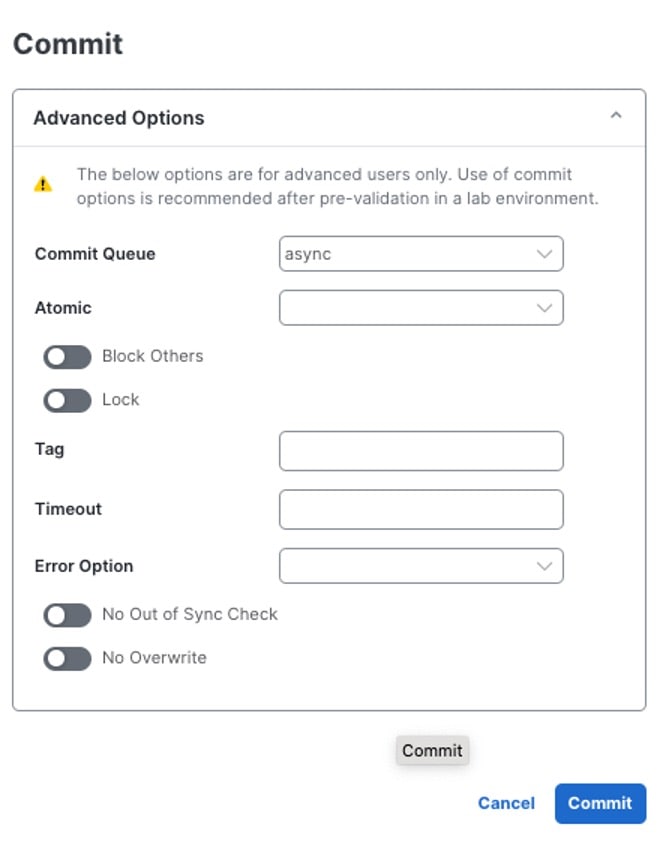
Before committing a configuration, Commit – Advanced Options may be available. These options are designed for advanced users only. Use of the commit options is recommended after pre-validation
in a lab environment. In the Advanced Options window, the following options are available:
Figure 6. Advanced Options Window
Commit Queue: While the configuration change is committed to the configuration database (CDB) immediately, it is not committed to the
actual device but queued for eventual commit to increase transaction throughput. This enables the use of the commit queue
feature for individual commit commands without enabling it by default. There are two operation modes: async and sync.
async mode: The async mode operation returns successfully if the transaction data has been successfully placed in the queue.
sync mode: The sync mode will prevent the operation from returning until the transaction data has been sent to all devices or a timeout
occurs. If the timeout occurs, the transaction data stays in the queue, and the operation returns successfully. The timeout
value can be specified with the timeout or infinity option. By default, the timeout value is determined by what is configured
in /devices/global-settings/commit-queue/sync.
Atomic: The atomic option sets the atomic behavior of the resulting queue item. If this is set to false, the devices contained in
the resulting queue item can start executing if the same devices in other non-atomic queue items ahead of it in the queue
are completed. If set to true, the atomic integrity of the queue item is preserved.
Block Others: This option will cause the resulting queue item to block subsequent queue items that use any of the devices in this queue
item from being queued.
Lock: This option will lock the resulting queue item. The queue item will not be processed until it has been unlocked; see the
actions unlock and lock in /devices/commit-queue/queue-item. As long as the lock is in place, no following queue items using
the same devices will be allowed to execute.
Tag: This option sets a user-defined, opaque tag that is present in all notifications and events sent referencing the queue item..
Timeout: The timeout value can be specified with the timeout or infinity option. By default, the timeout value is determined by what
is configured in /devices/global-settings/commit-queue/sync.
Error Option: Depending on the Error Option selected, NSO will store the reverse of the original transaction to undo the transaction changes
and return to the previous state. This data is stored in the /devices/commit-queue/completed tree, which it can be viewed
and invoked with the rollback action. When invoked, the data will be removed. There are two values available: continue-on-error,
stop-onerror.
continue-on-error: The continue-on-error value means that the commit queue will continue on errors. No rollback data will be created.
stop-on-error: The stop-on-error means that the commit queue will lock the failed queue item, thus blocking other queue items with overlapping
devices from being executed. The lock must be released manually when the error is fixed, or the rollback action must be invoked
under /devices/commit-queue/completed.
No Out of Sync Check: Commit even if out of sync.
No Overwrite: Do not overwrite modified data on the device.
Device Management
Figure 7. Device Management Menu
The Device Management menu provides access to device-related functionality, including adding, managing, and grouping devices,
creating and managing credential profiles, and viewing a history of device-related jobs.
Alerts
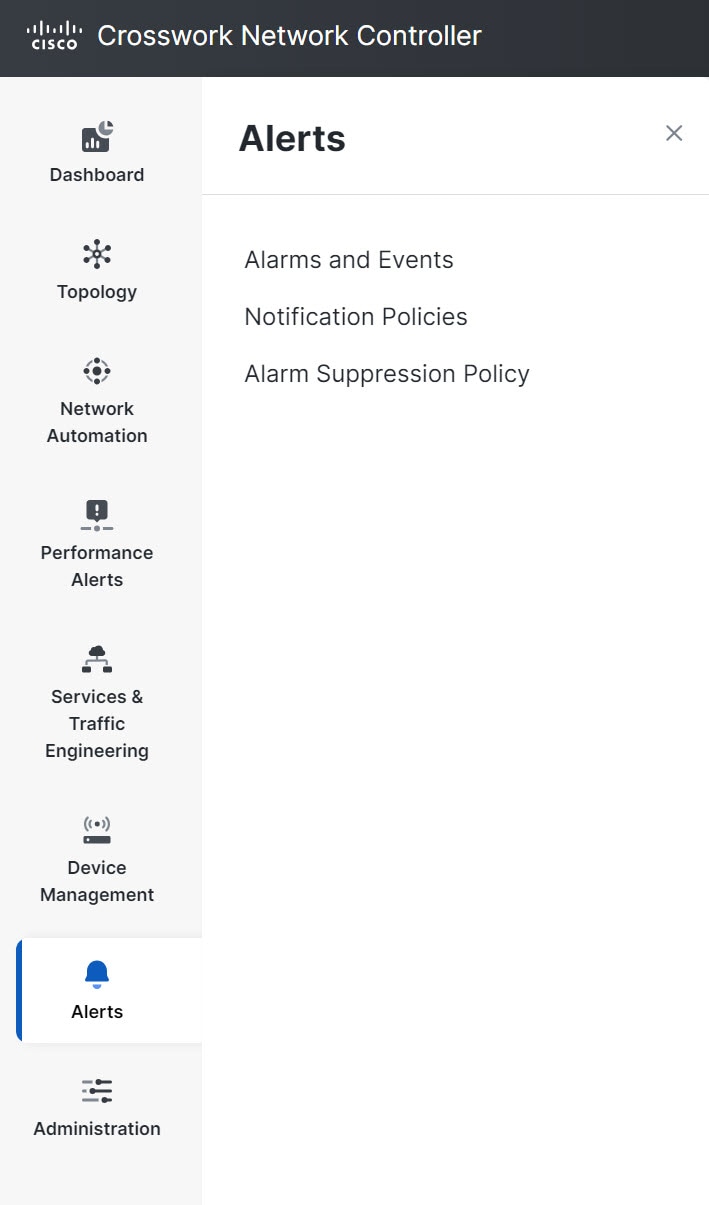
Figure 8. Alerts Menu
The Alerts menu gives you a quick summary of all the alarms and events in your system and network. By configuring your alarms
and events, you can effectively manage system performance and promptly address issues. The Notification Policies enable you
to create new alarm notification policies that will send the alarms generated by Crosswork Network Controller to a Northbound
trap or a Syslog receiver based on specific criteria. If you need to temporarily stop notifications for specific conditions,
such as during system maintenance or for known issues, you can put an alarm suppression policy in place to prevent unnecessary
alerts.
Administration
Figure 9. Administration Menu
The Administration menu provides access to all system management functions, data gateway management, Crosswork cluster and
application health, backup and restore, smart licensing, and other setup and maintenance functions that an administrator typically
performs.


 Feedback