Orchestrated Service Provisioning

This section explains the following topics:

Overview

Using the scenario workflows described in this section, we provide examples of how to configure the system to deliver the operator's intended configuration. These scenarios only partially demonstrate all of Crosswork Network Controller's capabilities. They are intended to demonstrate the flexibility of the platform. Additional customization is possible by leveraging the resources available on Cisco DevNet or through engagement with Cisco Customer Experience.


Note


Some scenario features and functions belonging to multiple components (such as Crosswork Optimization Engine, Crosswork Service Health, Crosswork Active Topology) will not be available as described unless all of the applications are successfully deployed.


To illustrate the capabilities of Crosswork Network Controller, we have provided a set of scenarios we walk through to guide you in configuring the system.

Scenarios

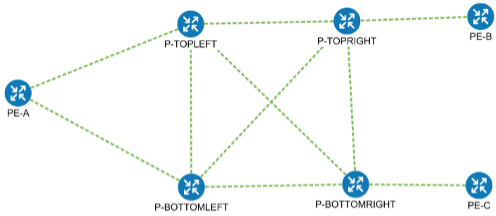
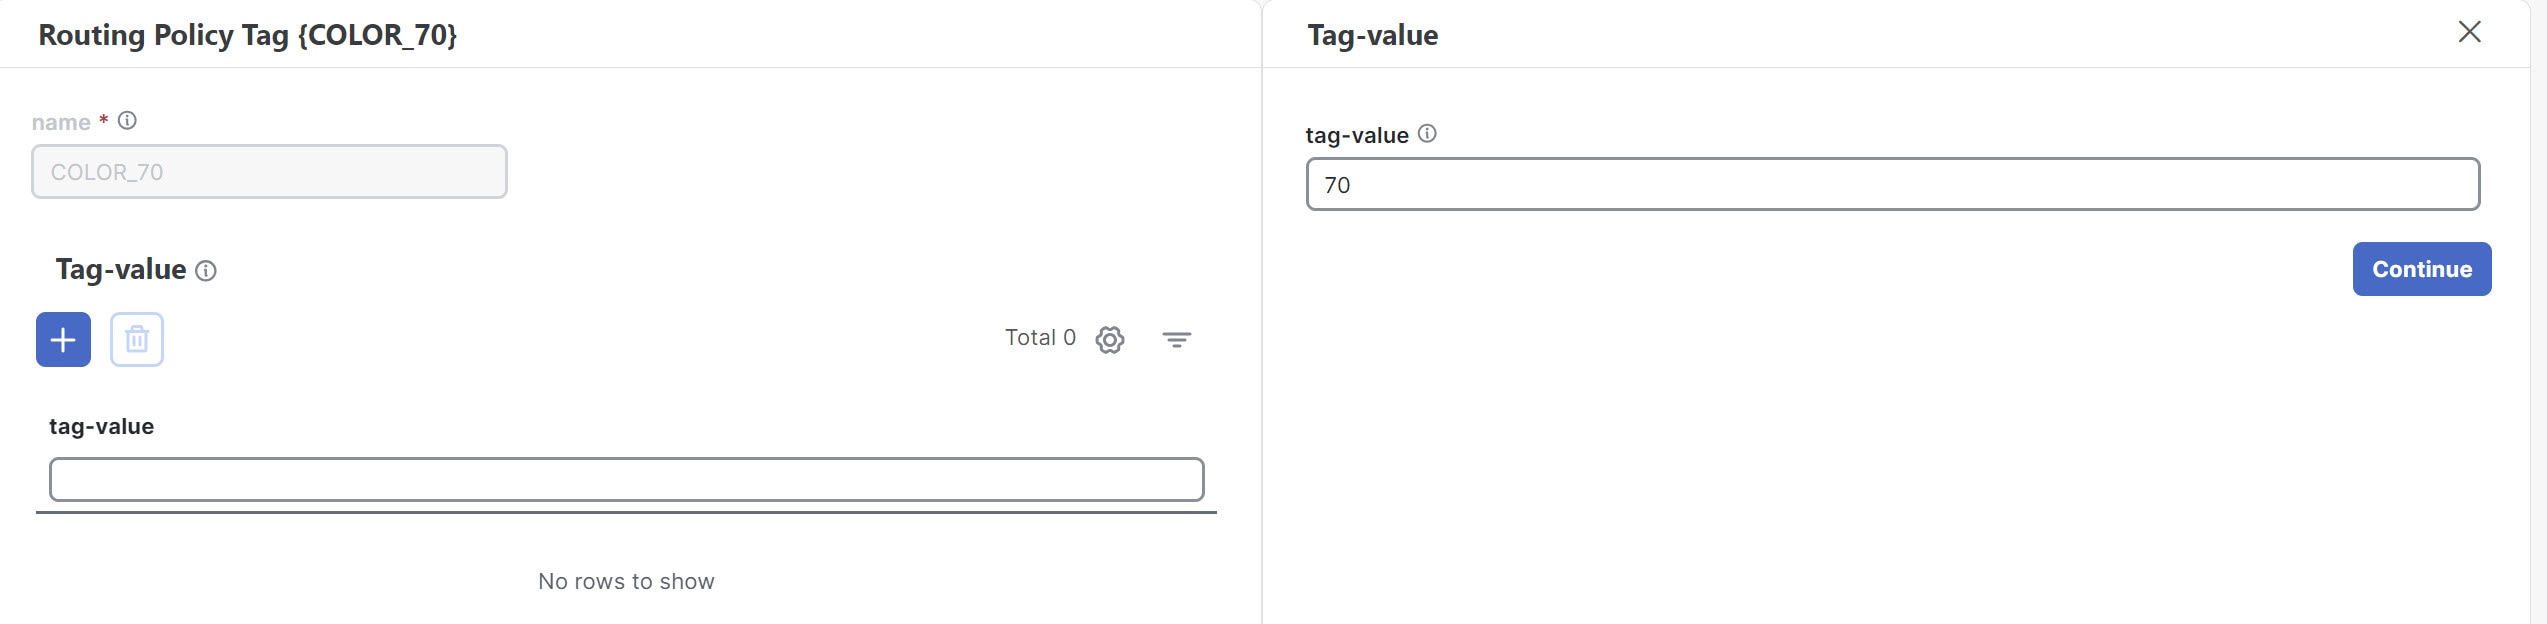
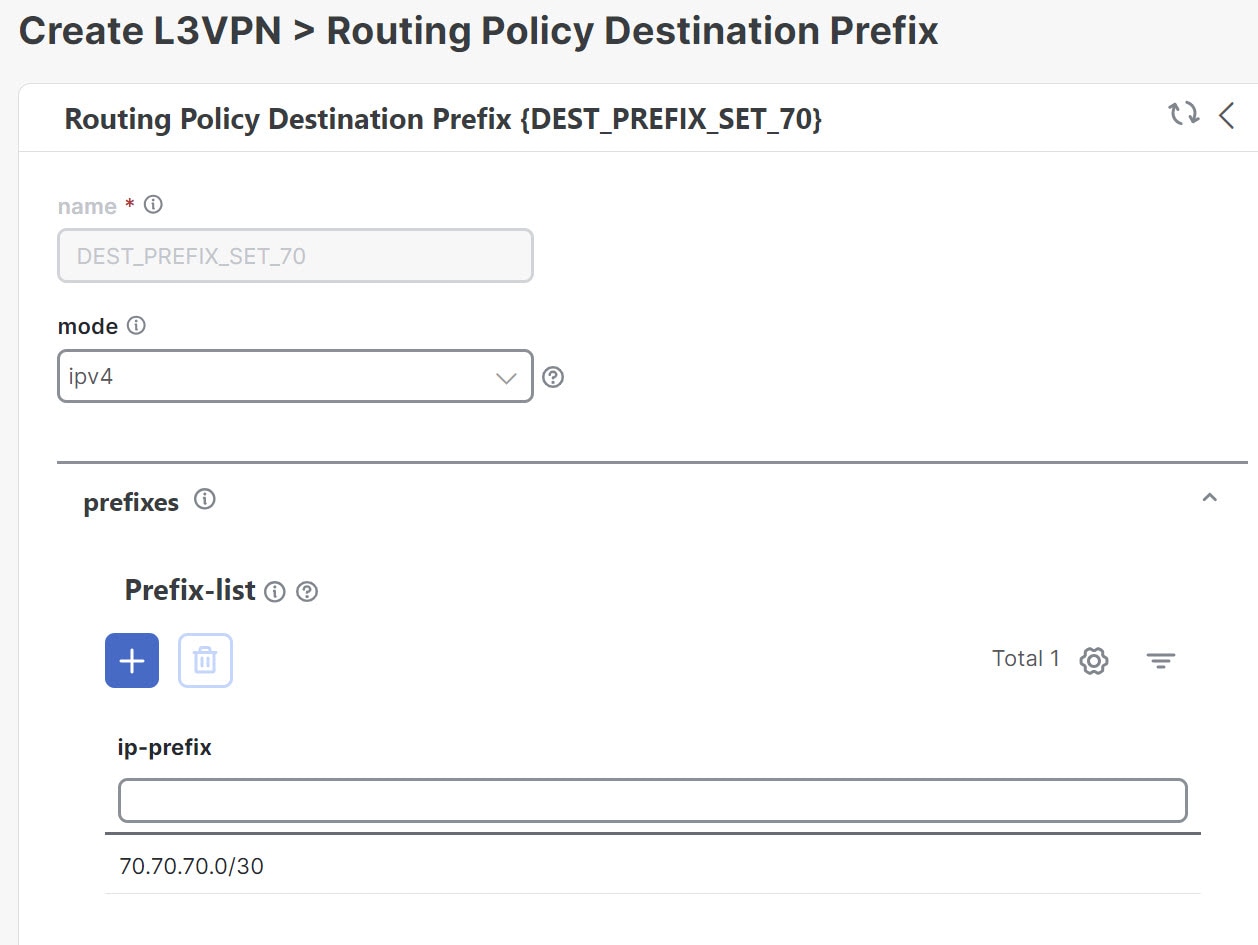
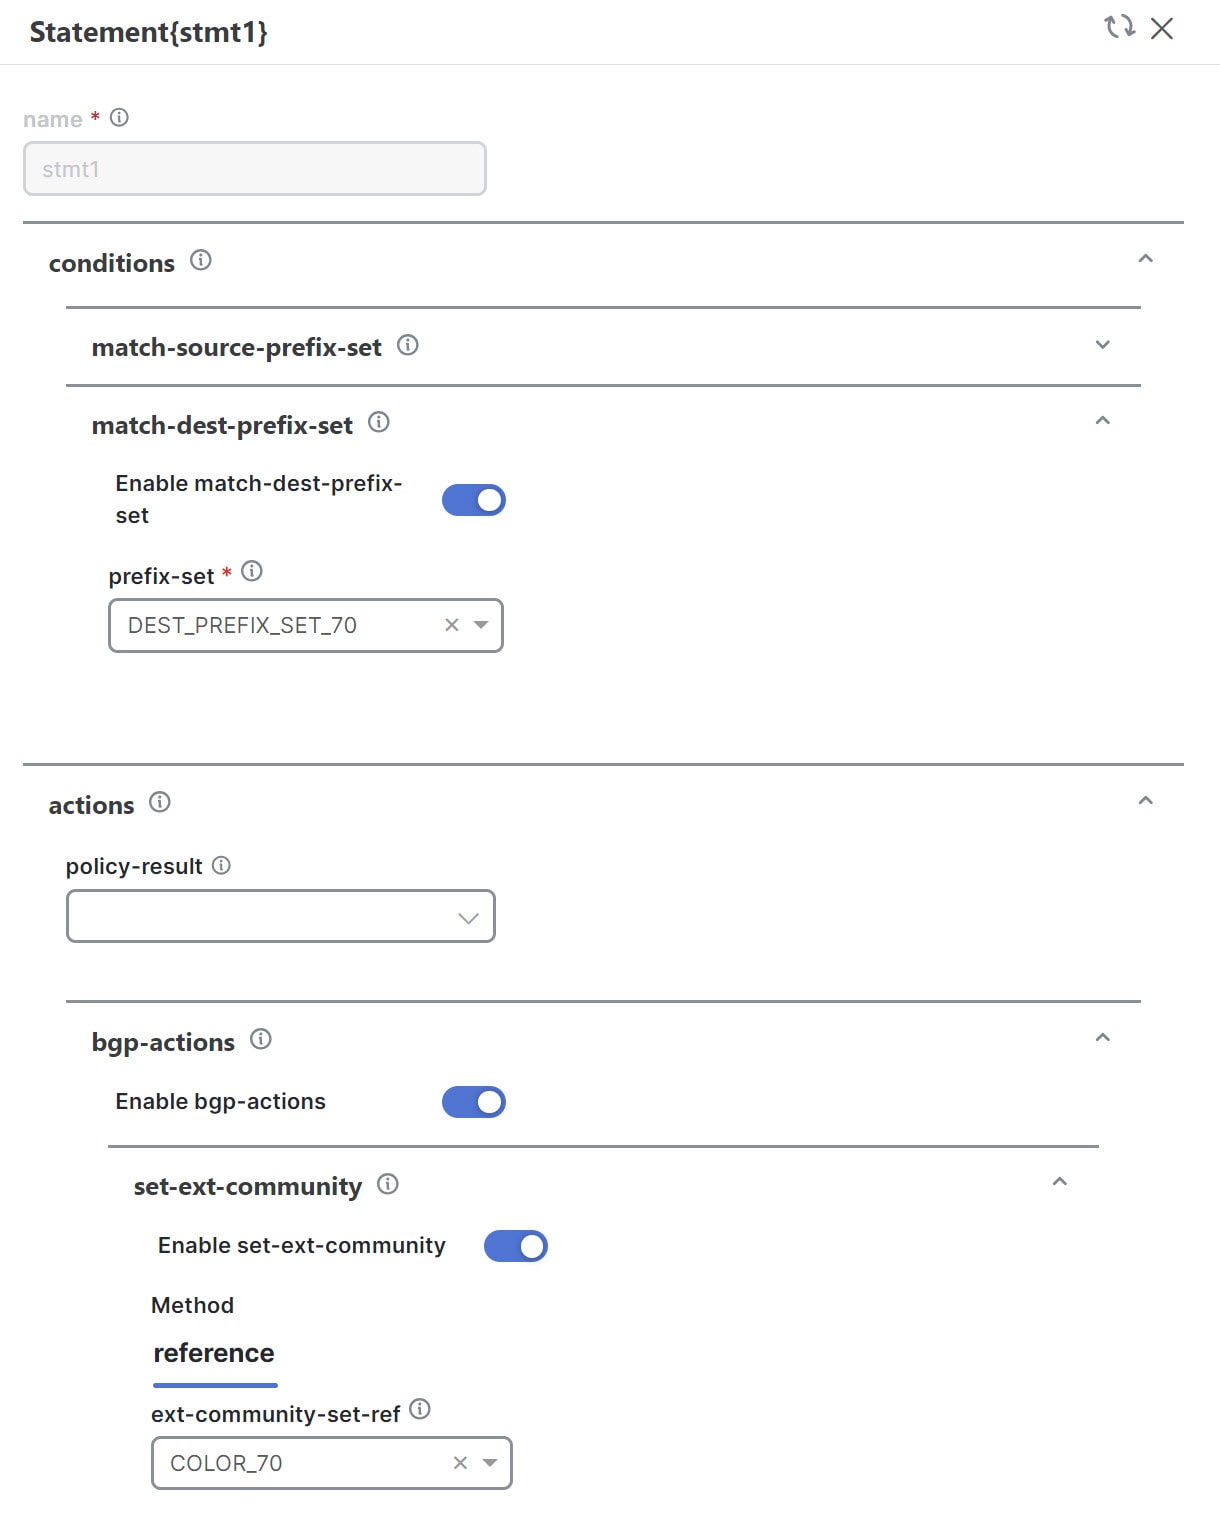
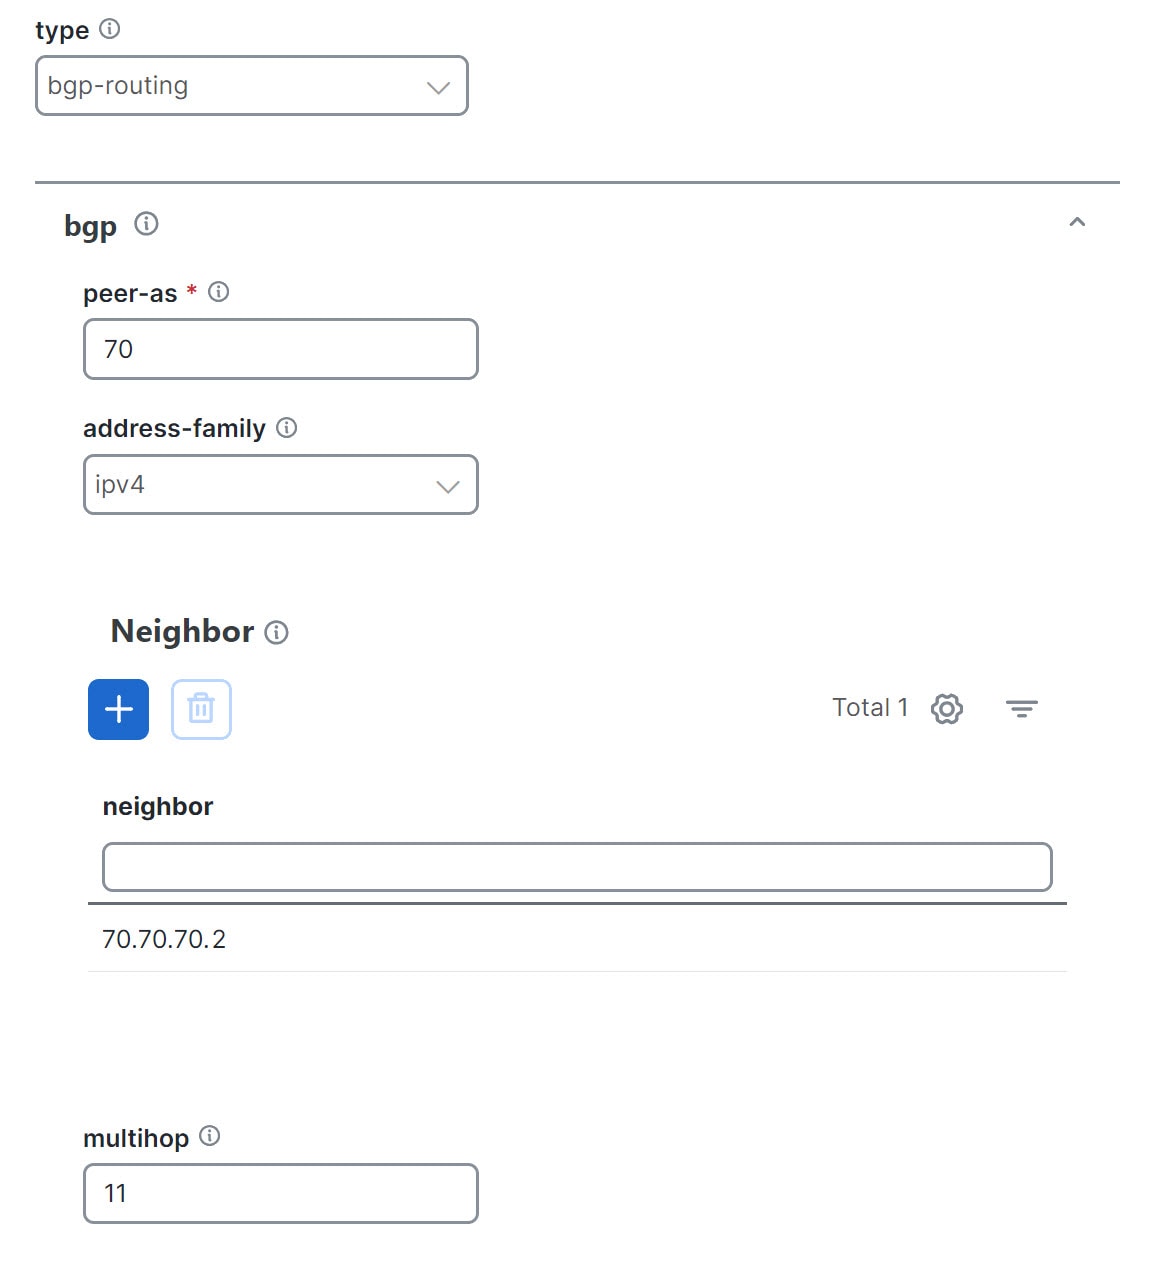
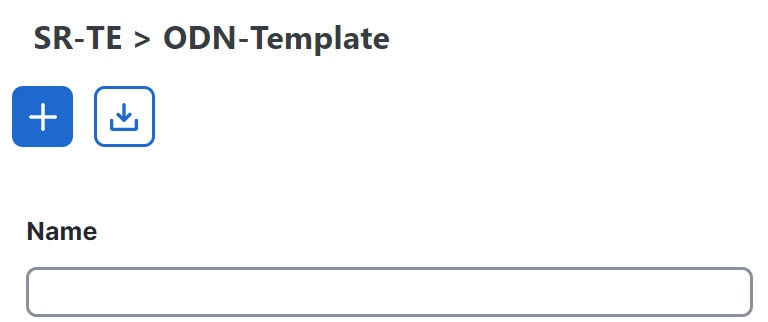
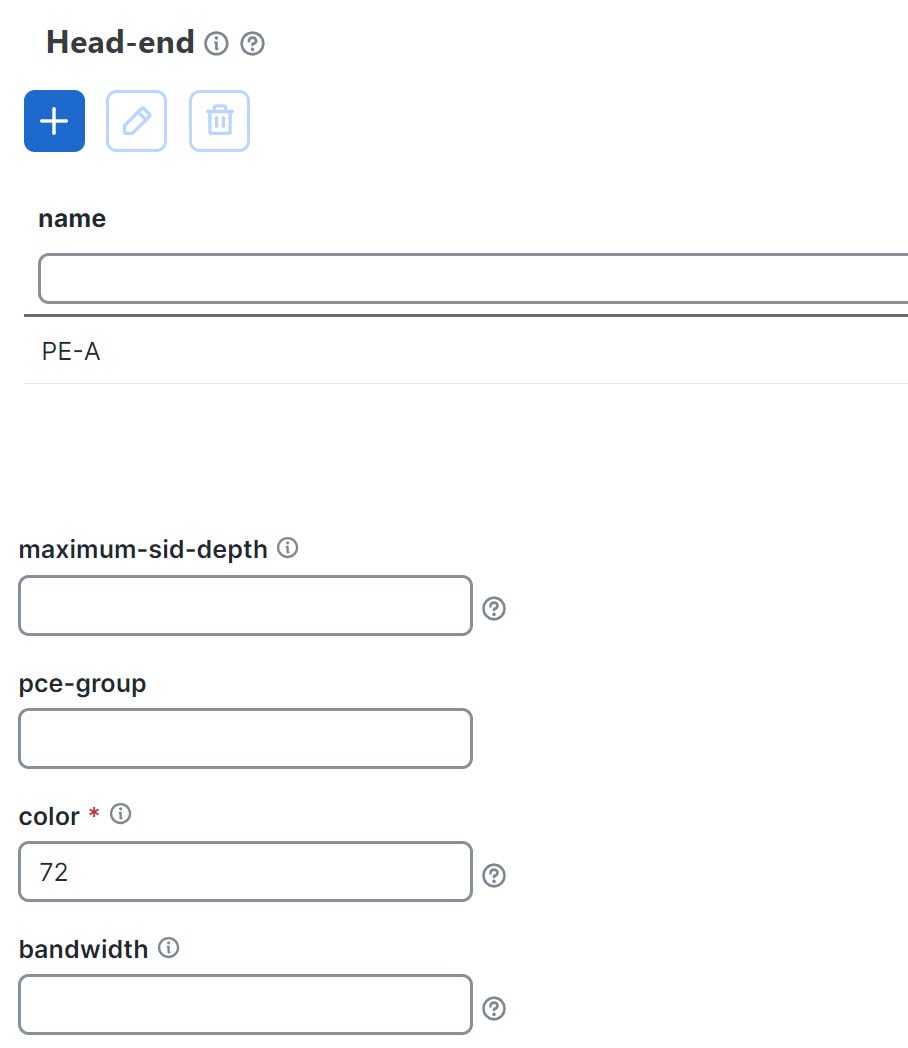
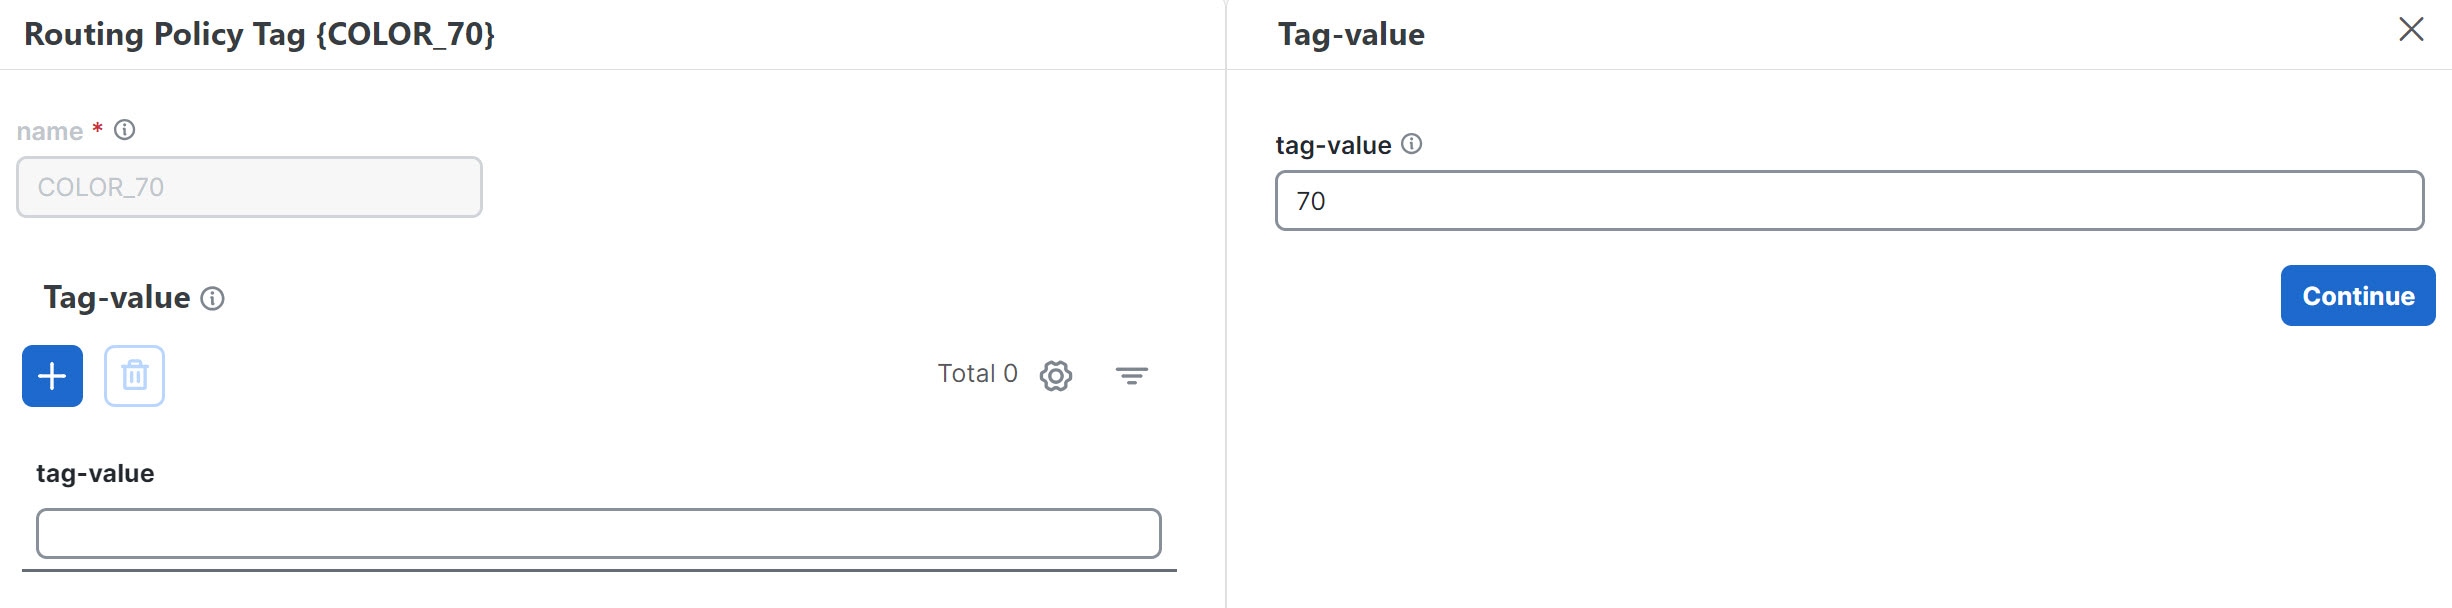
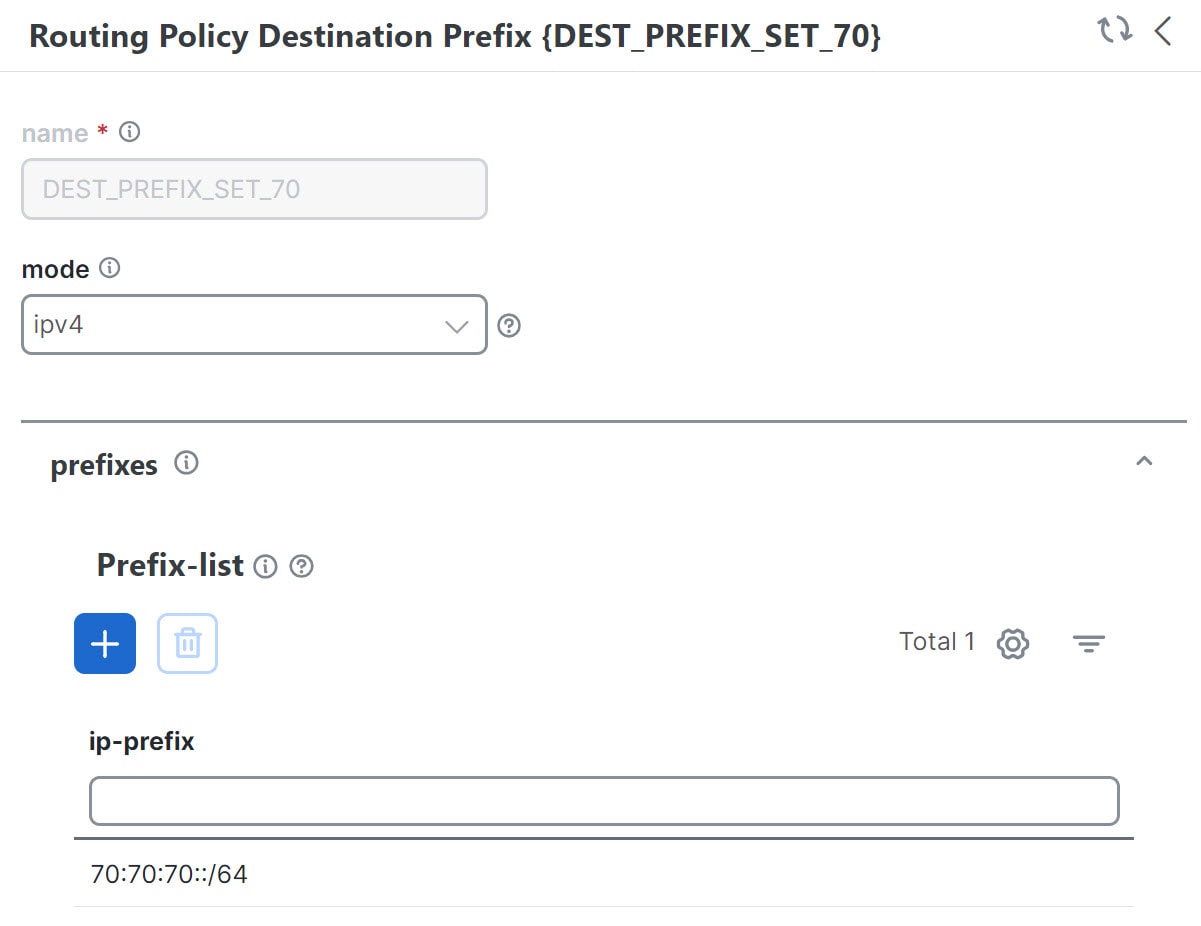
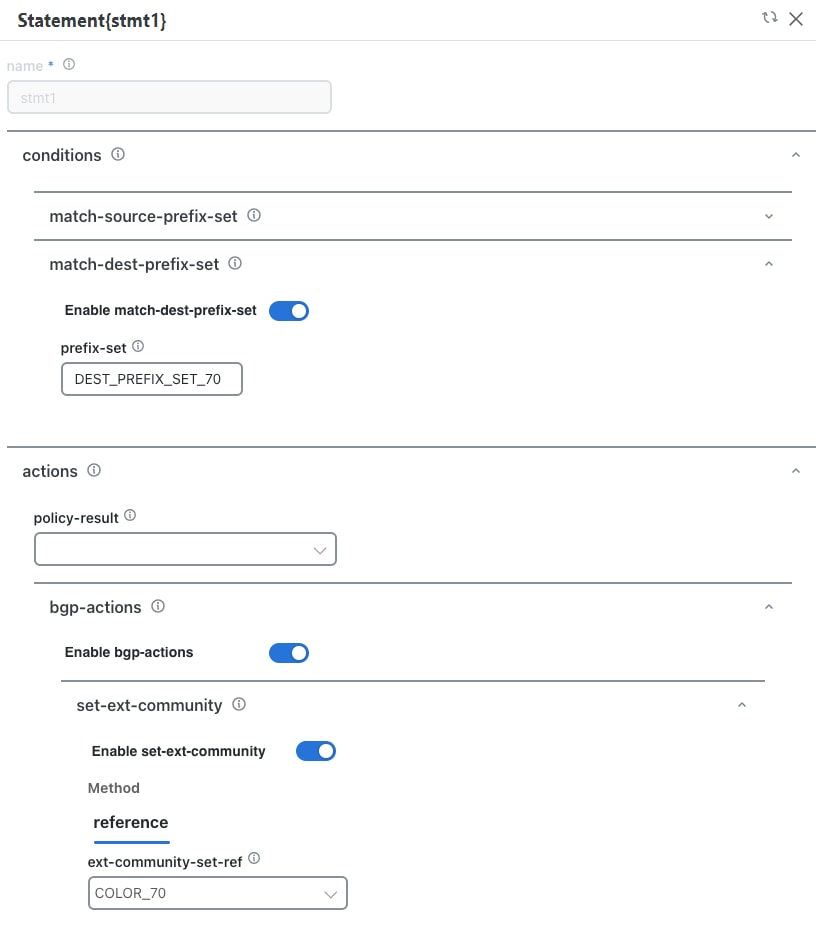
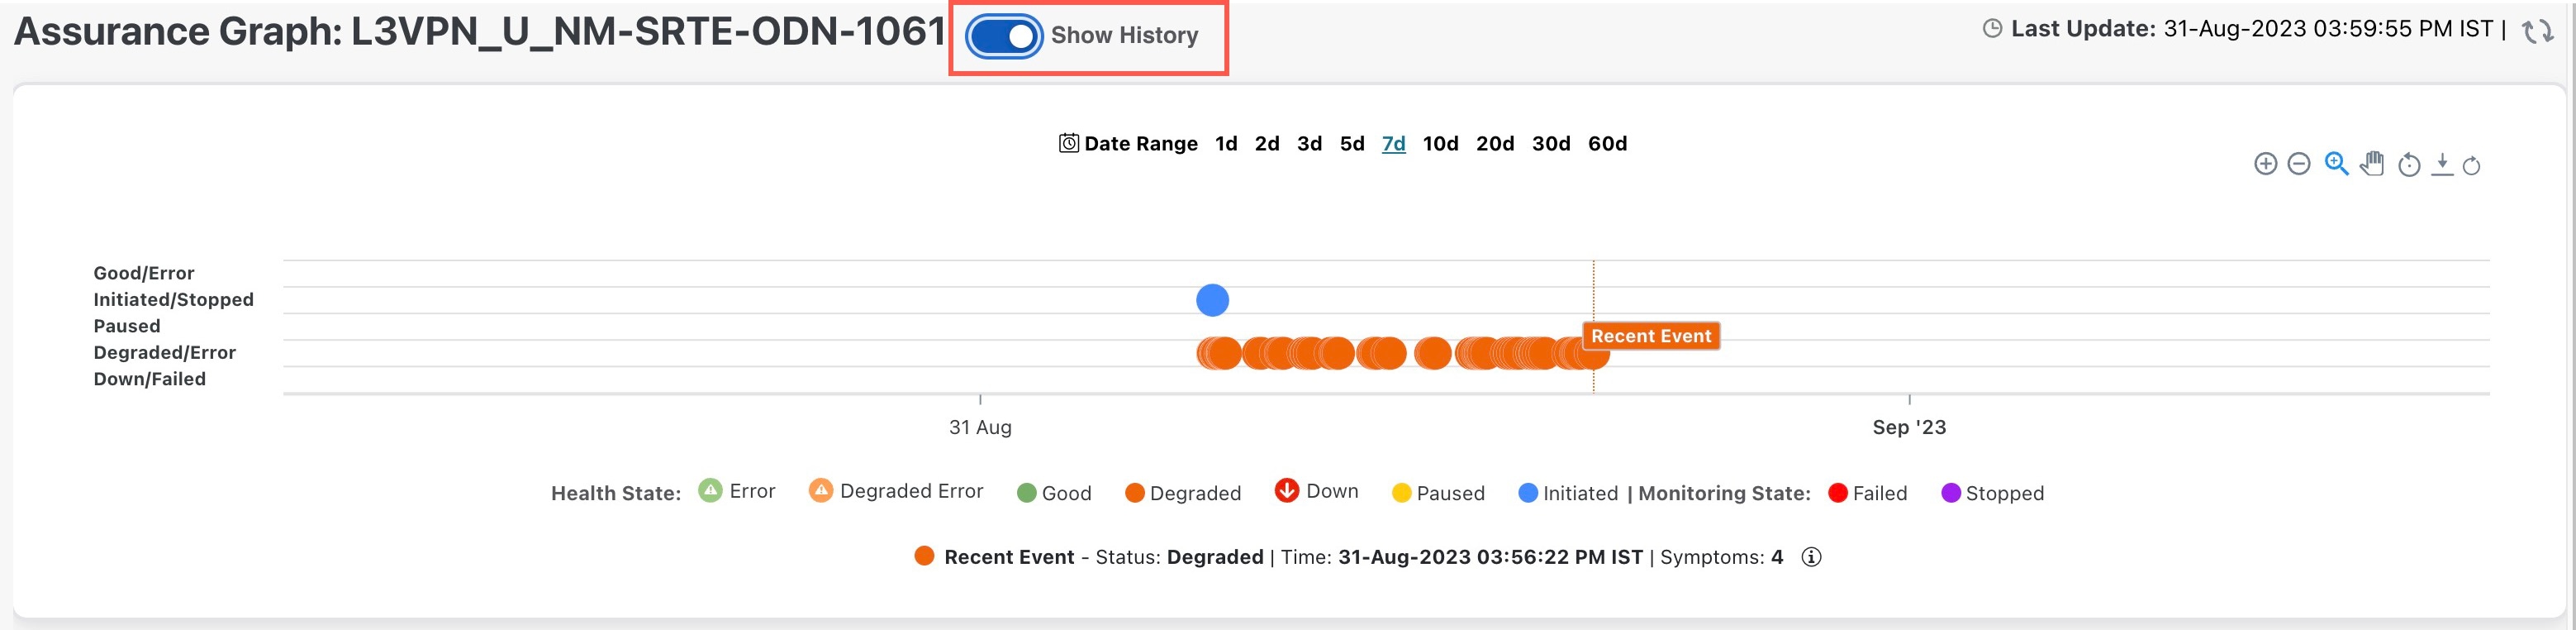
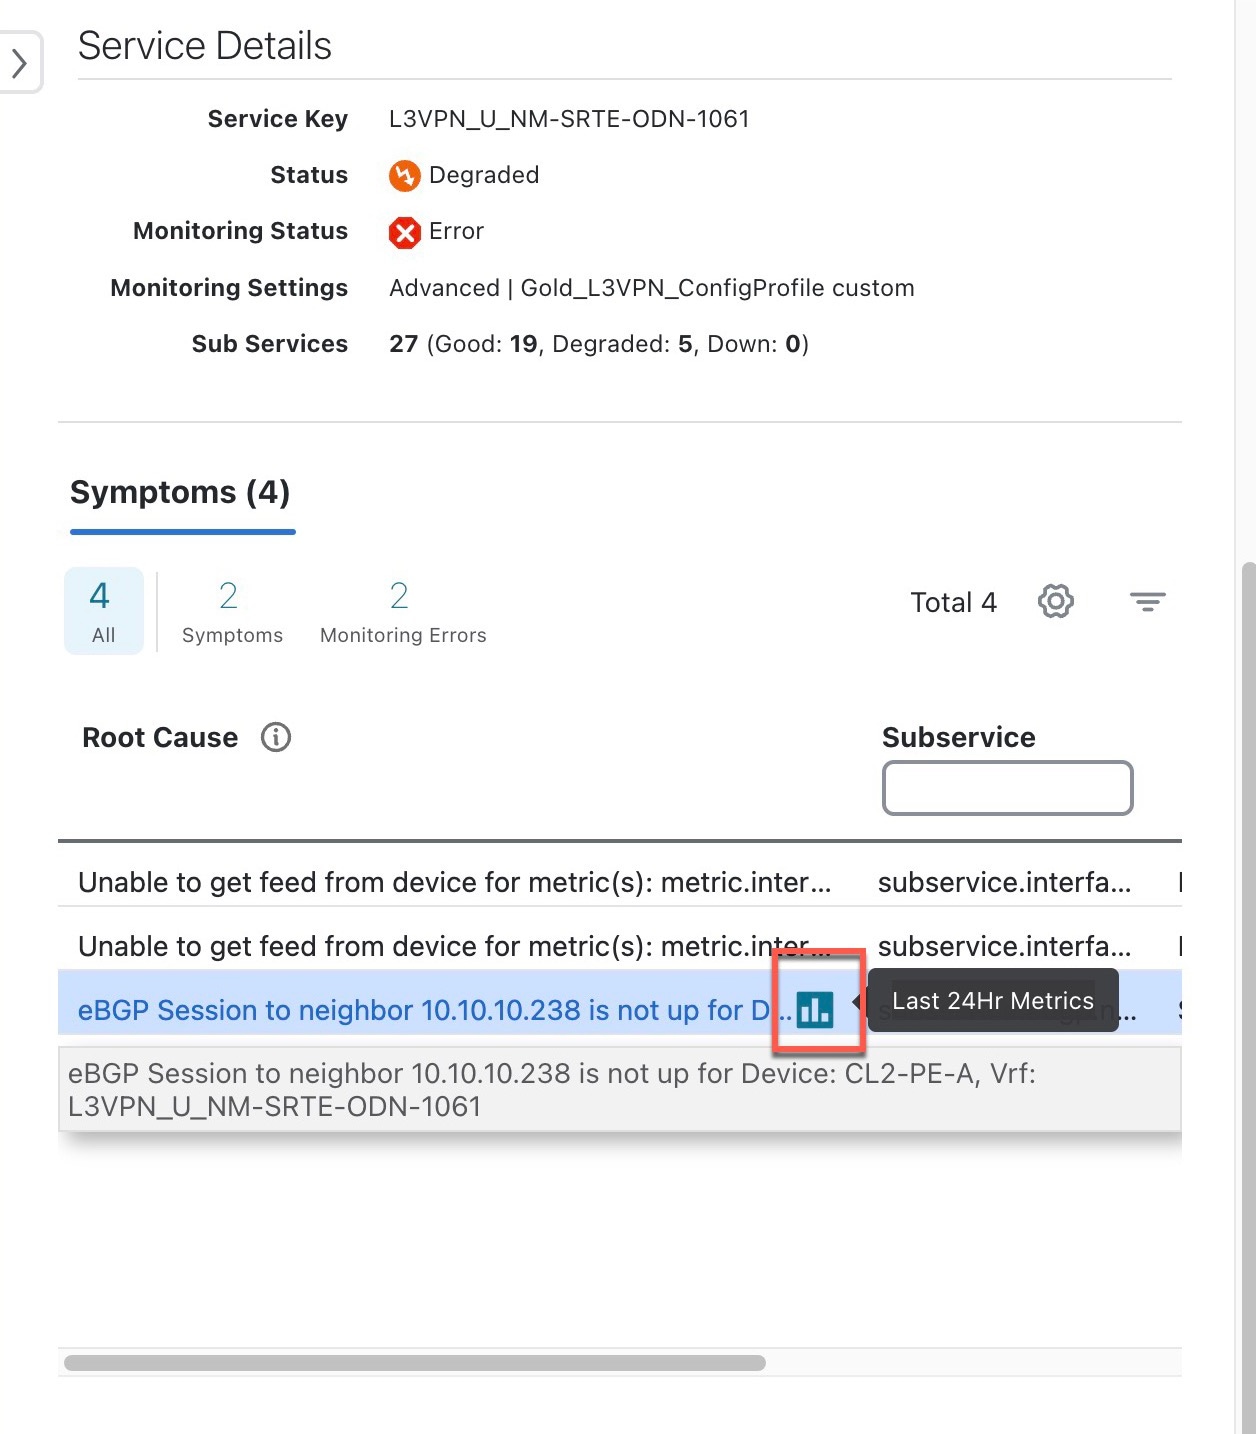
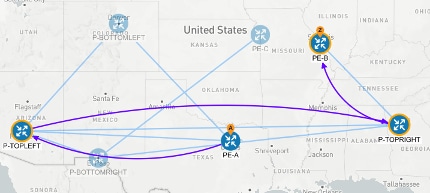
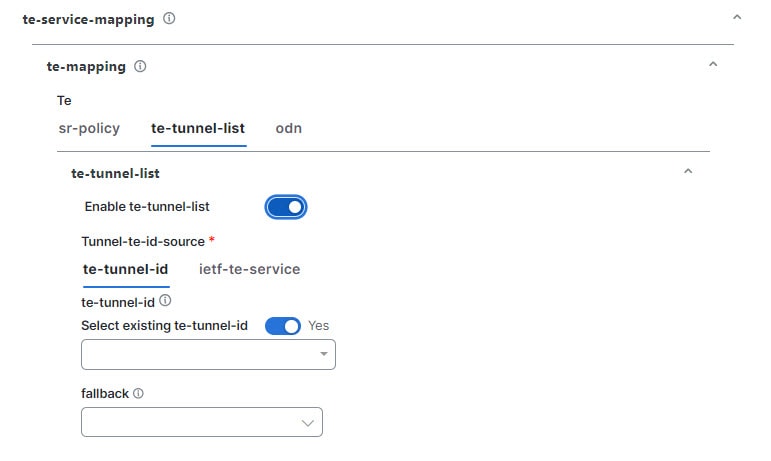
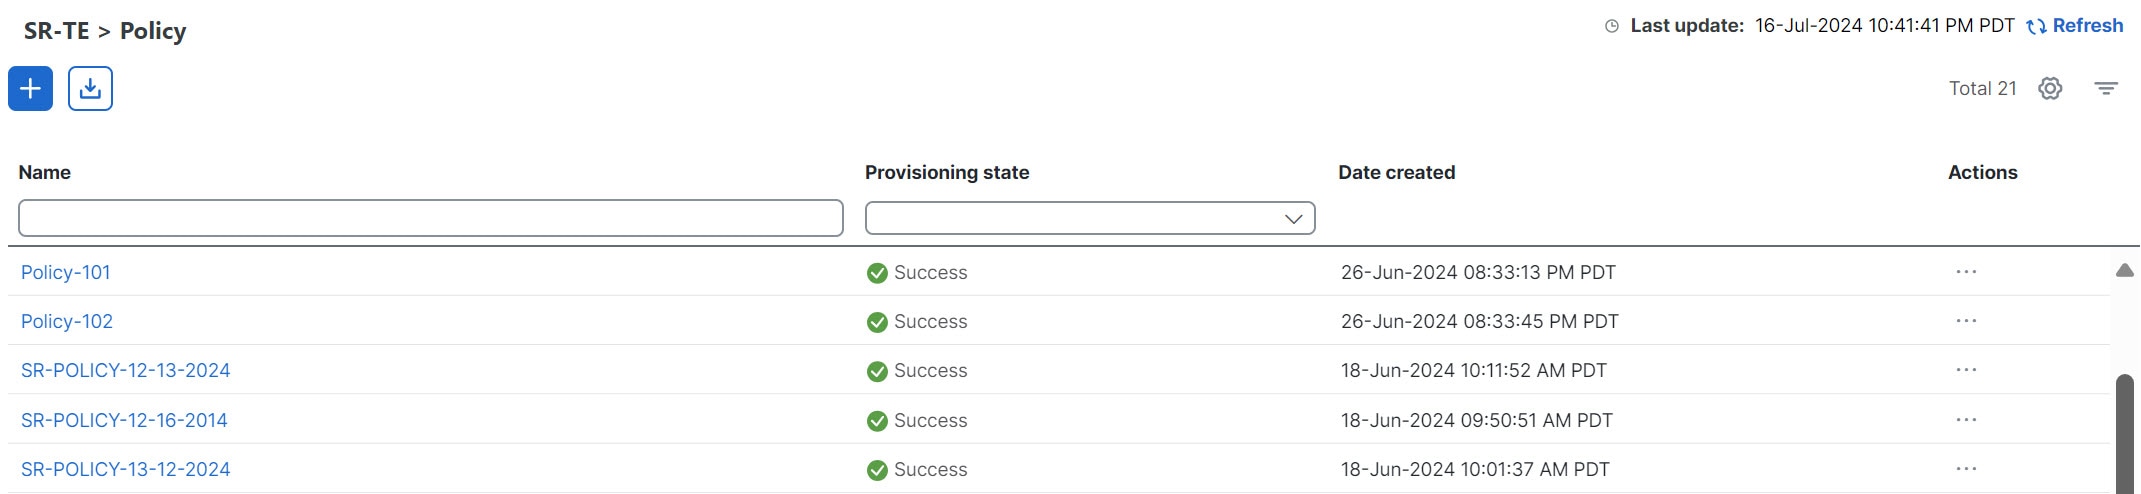
Scenario 1 – Implement and Maintain SLA for an L3VPN Service for SR-MPLS (using ODN)

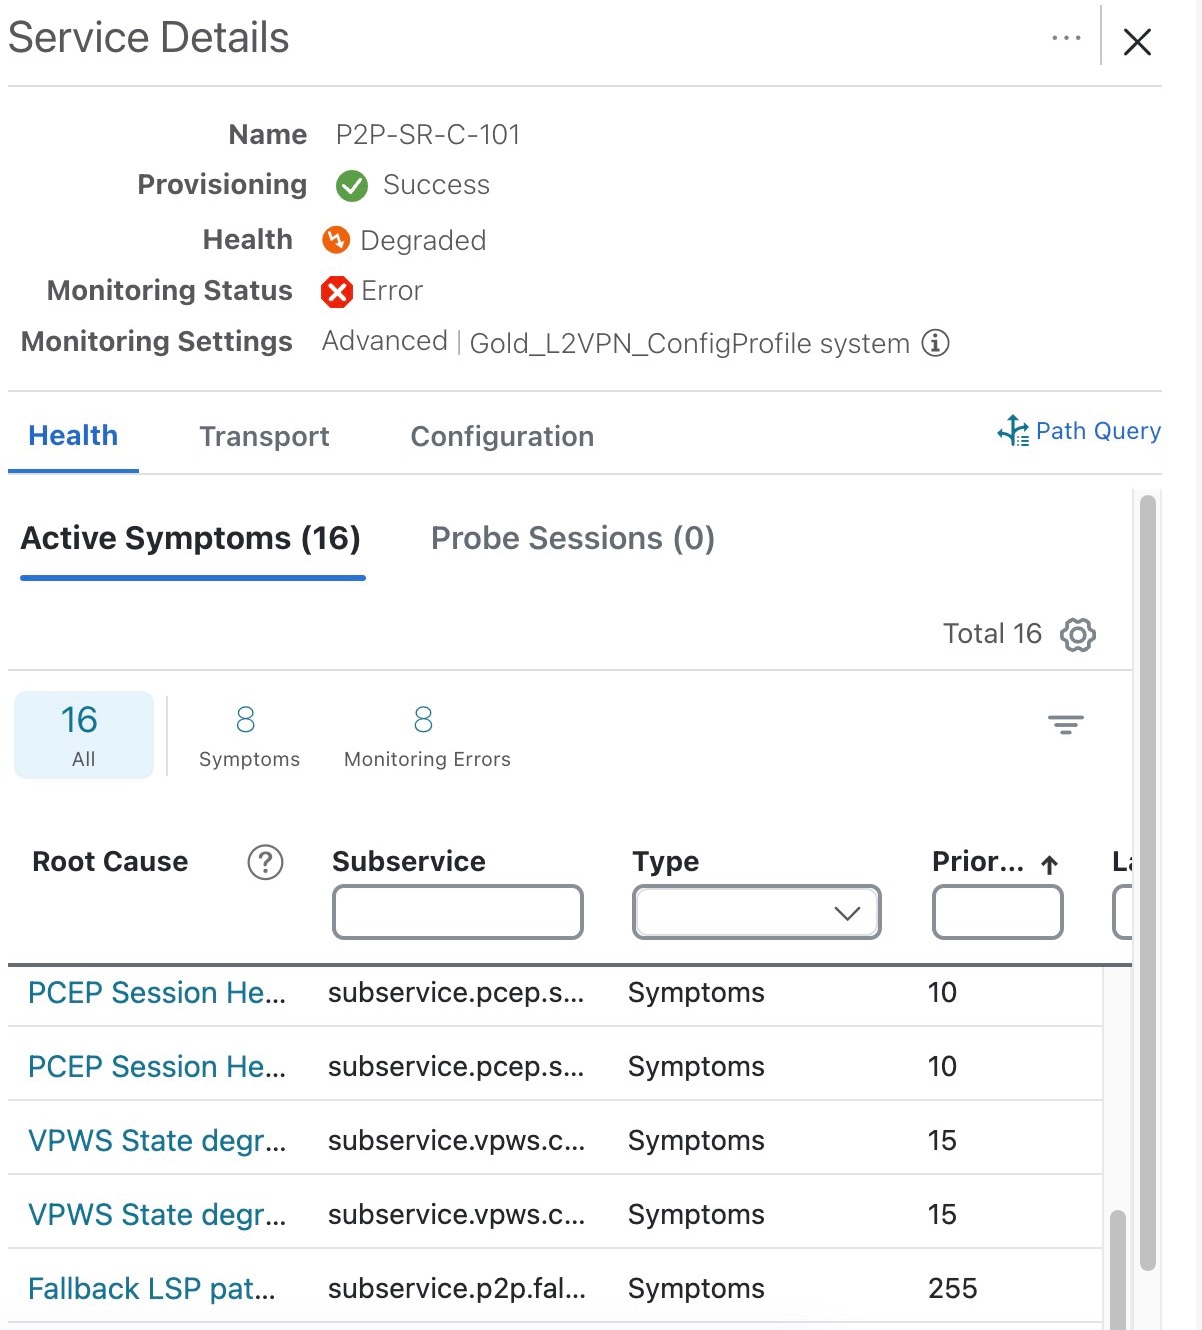
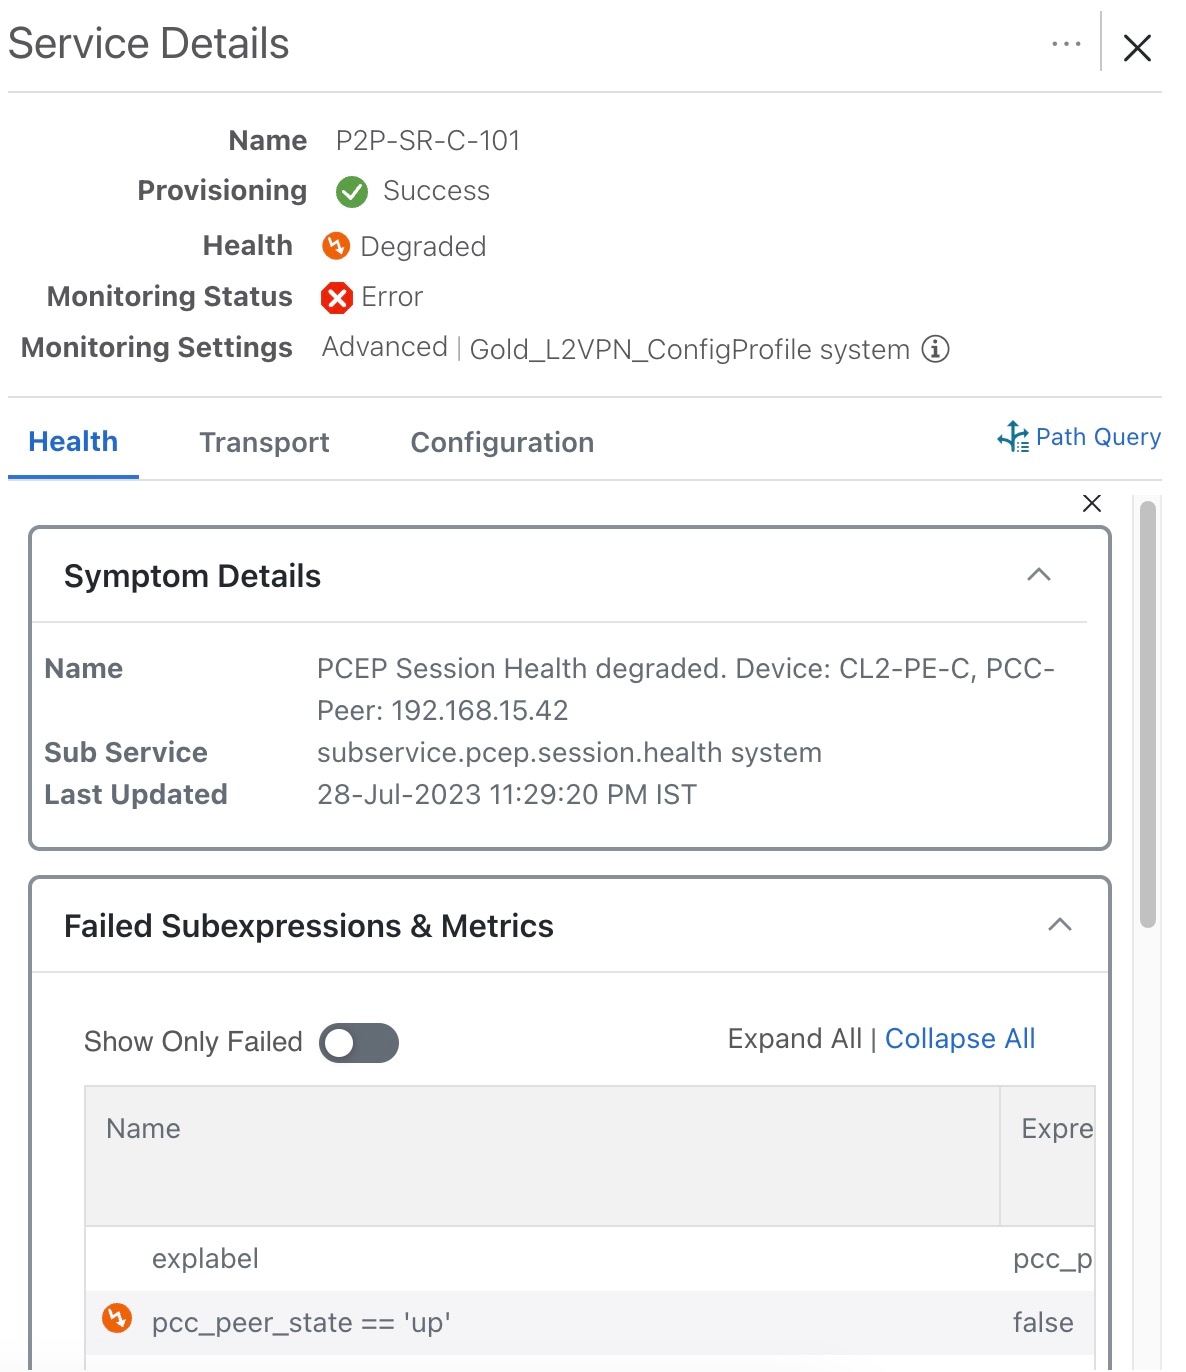
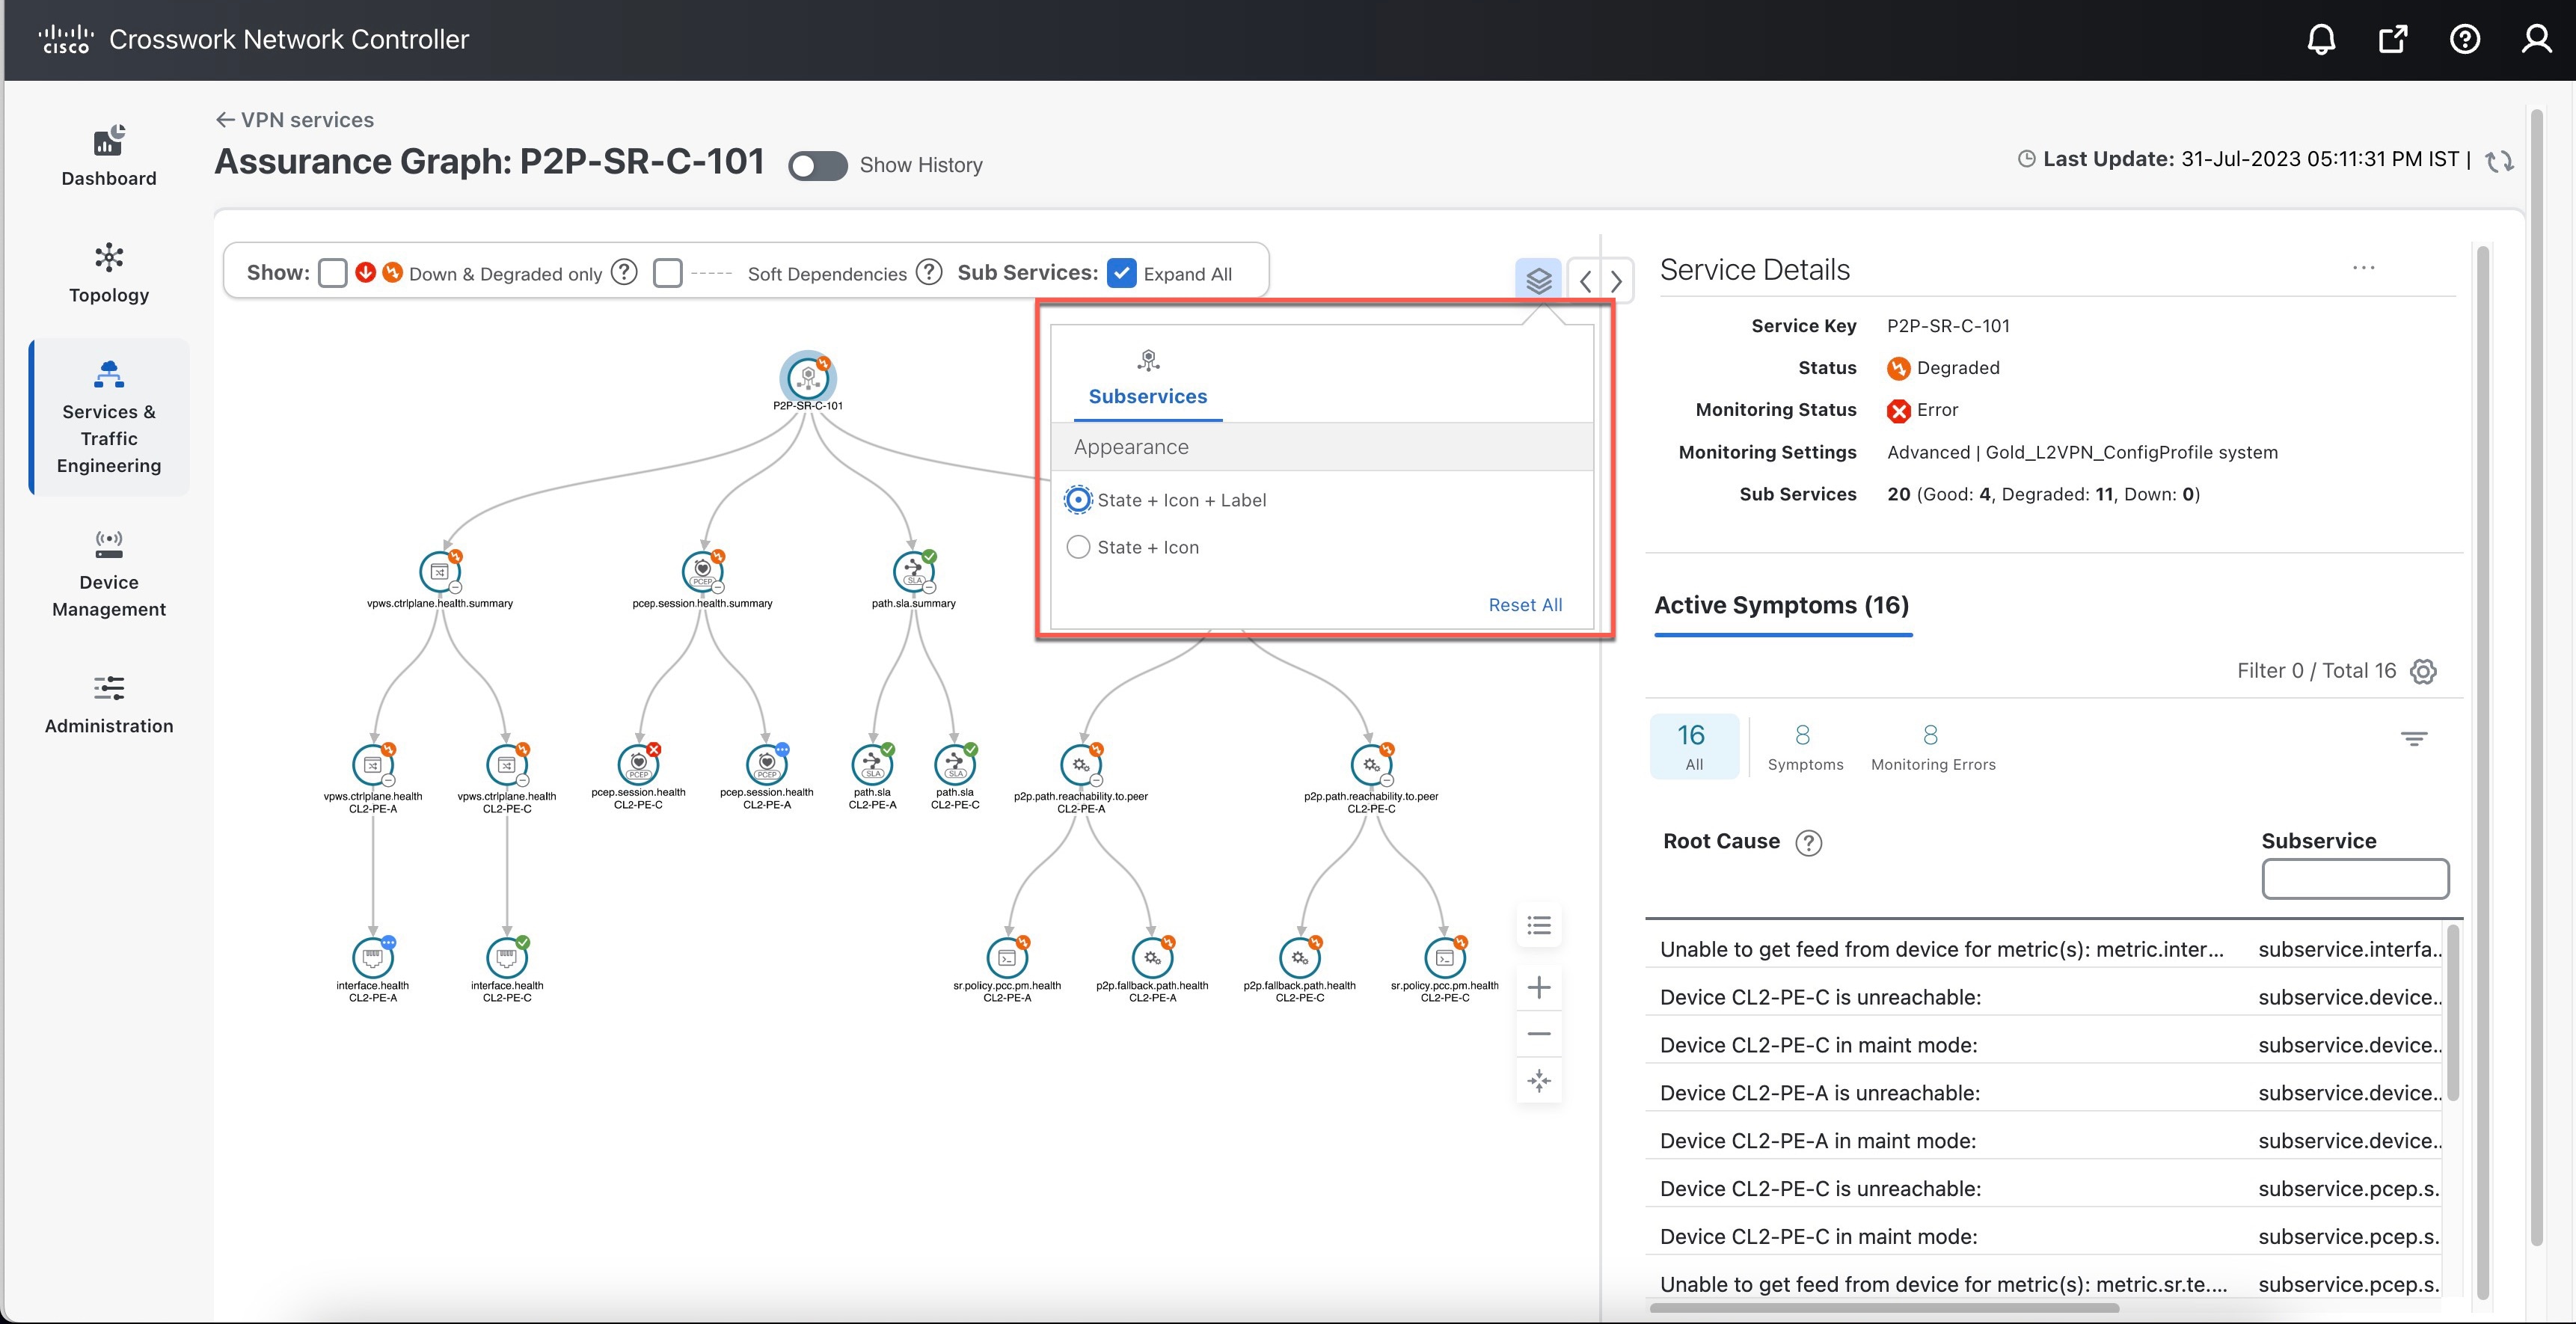
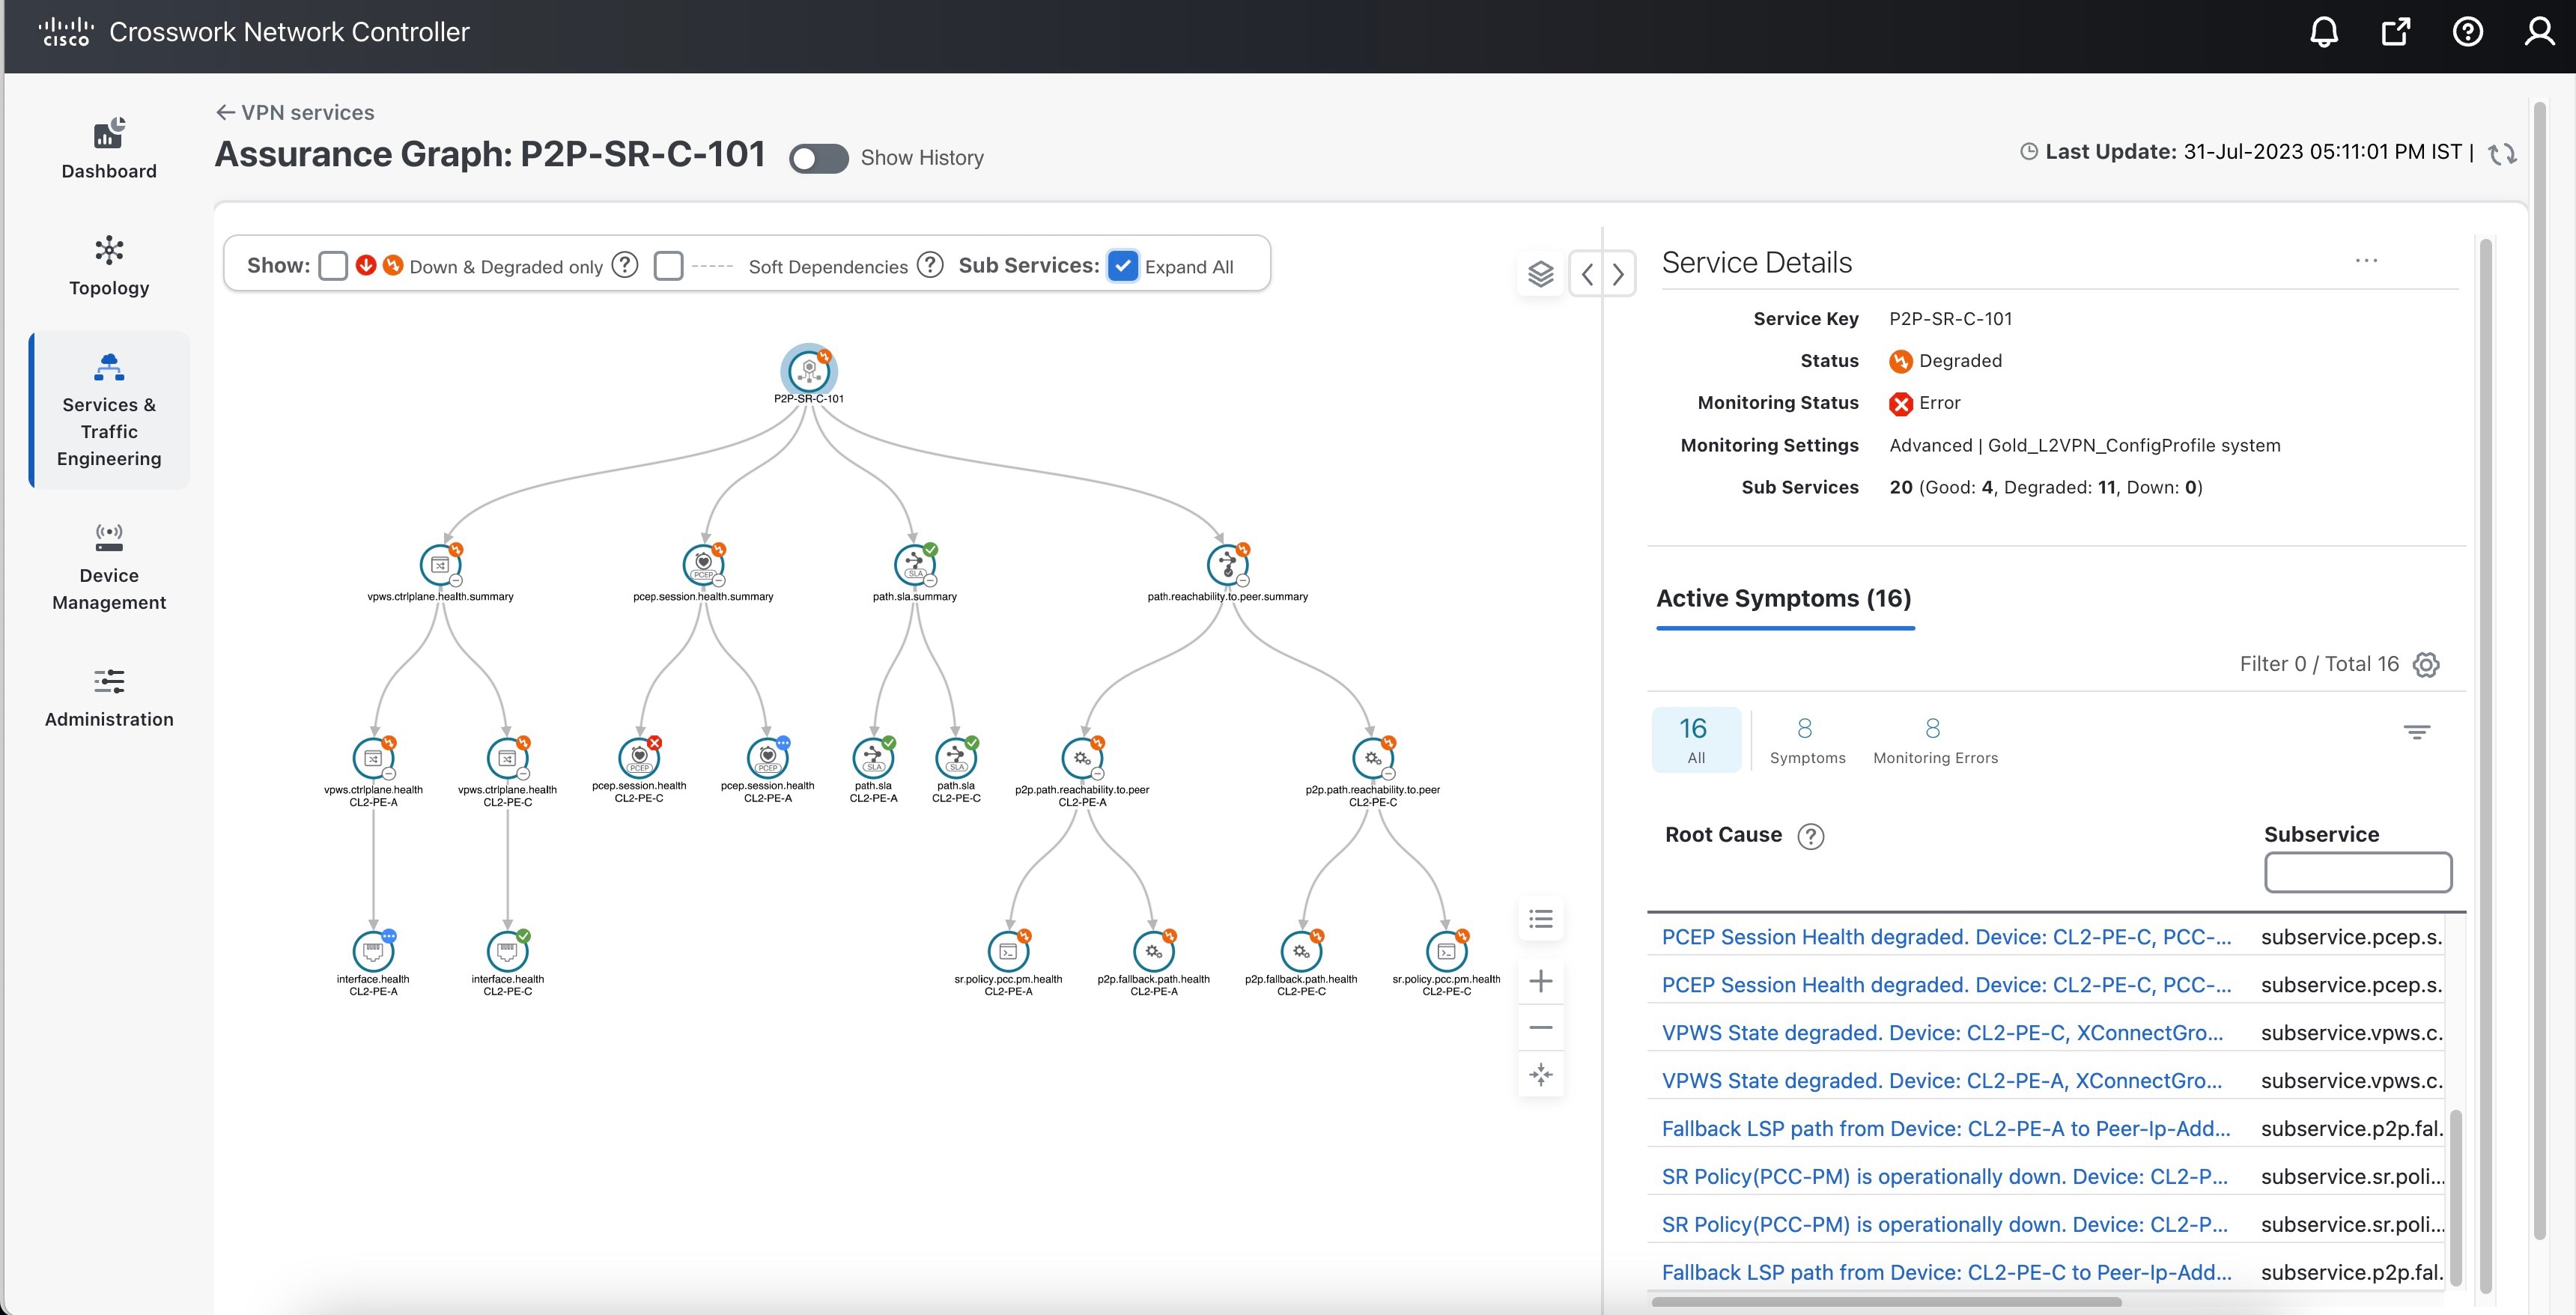
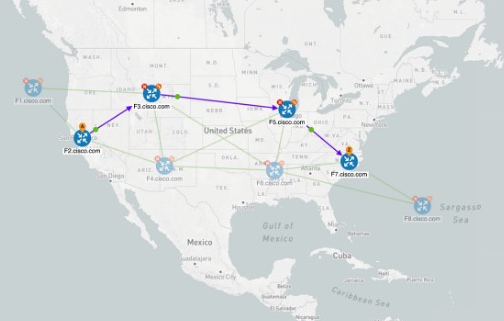
In this scenario, we provision an L3VPN service using Segment Routing (SR) On-Demand Next Hop (ODN) to achieve specific SLA objectives such as lowest latency and disjoint paths. Additionally, we will enable Service Health to analyze and monitor the provisioned services.

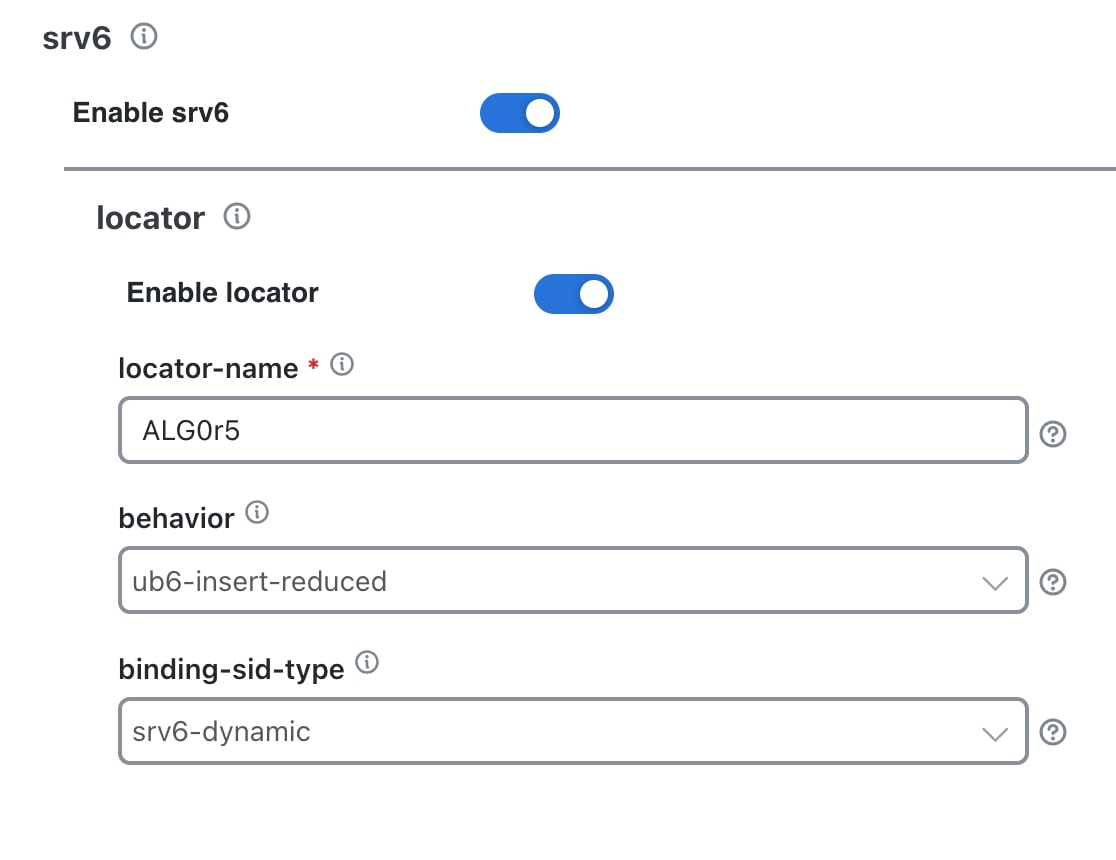
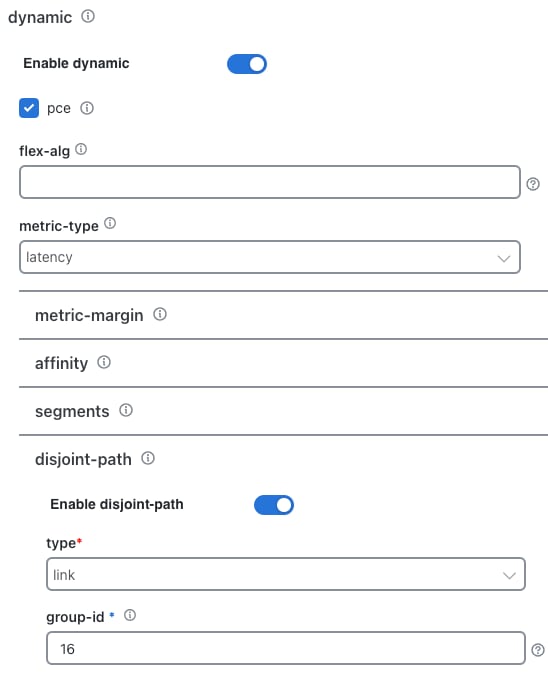
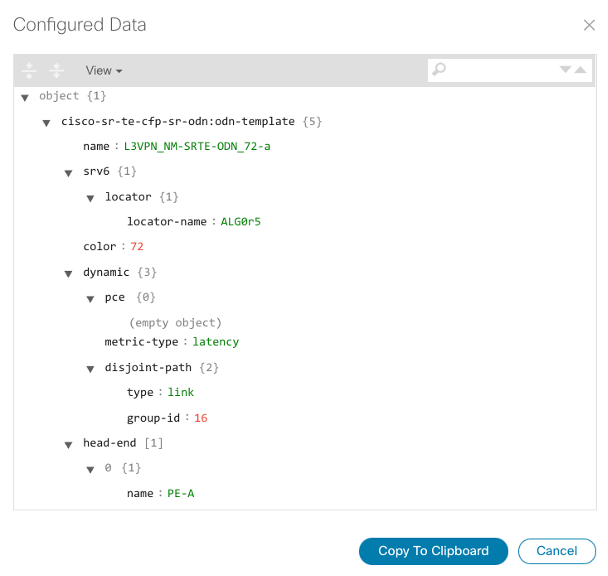
Scenario 2 – Implement and Maintain SLA for an L3VPN Service for SRv6 (using ODN)

This scenario focuses on provisioning the L3VPN service using SR-TE ODN with SRv6 enabled.

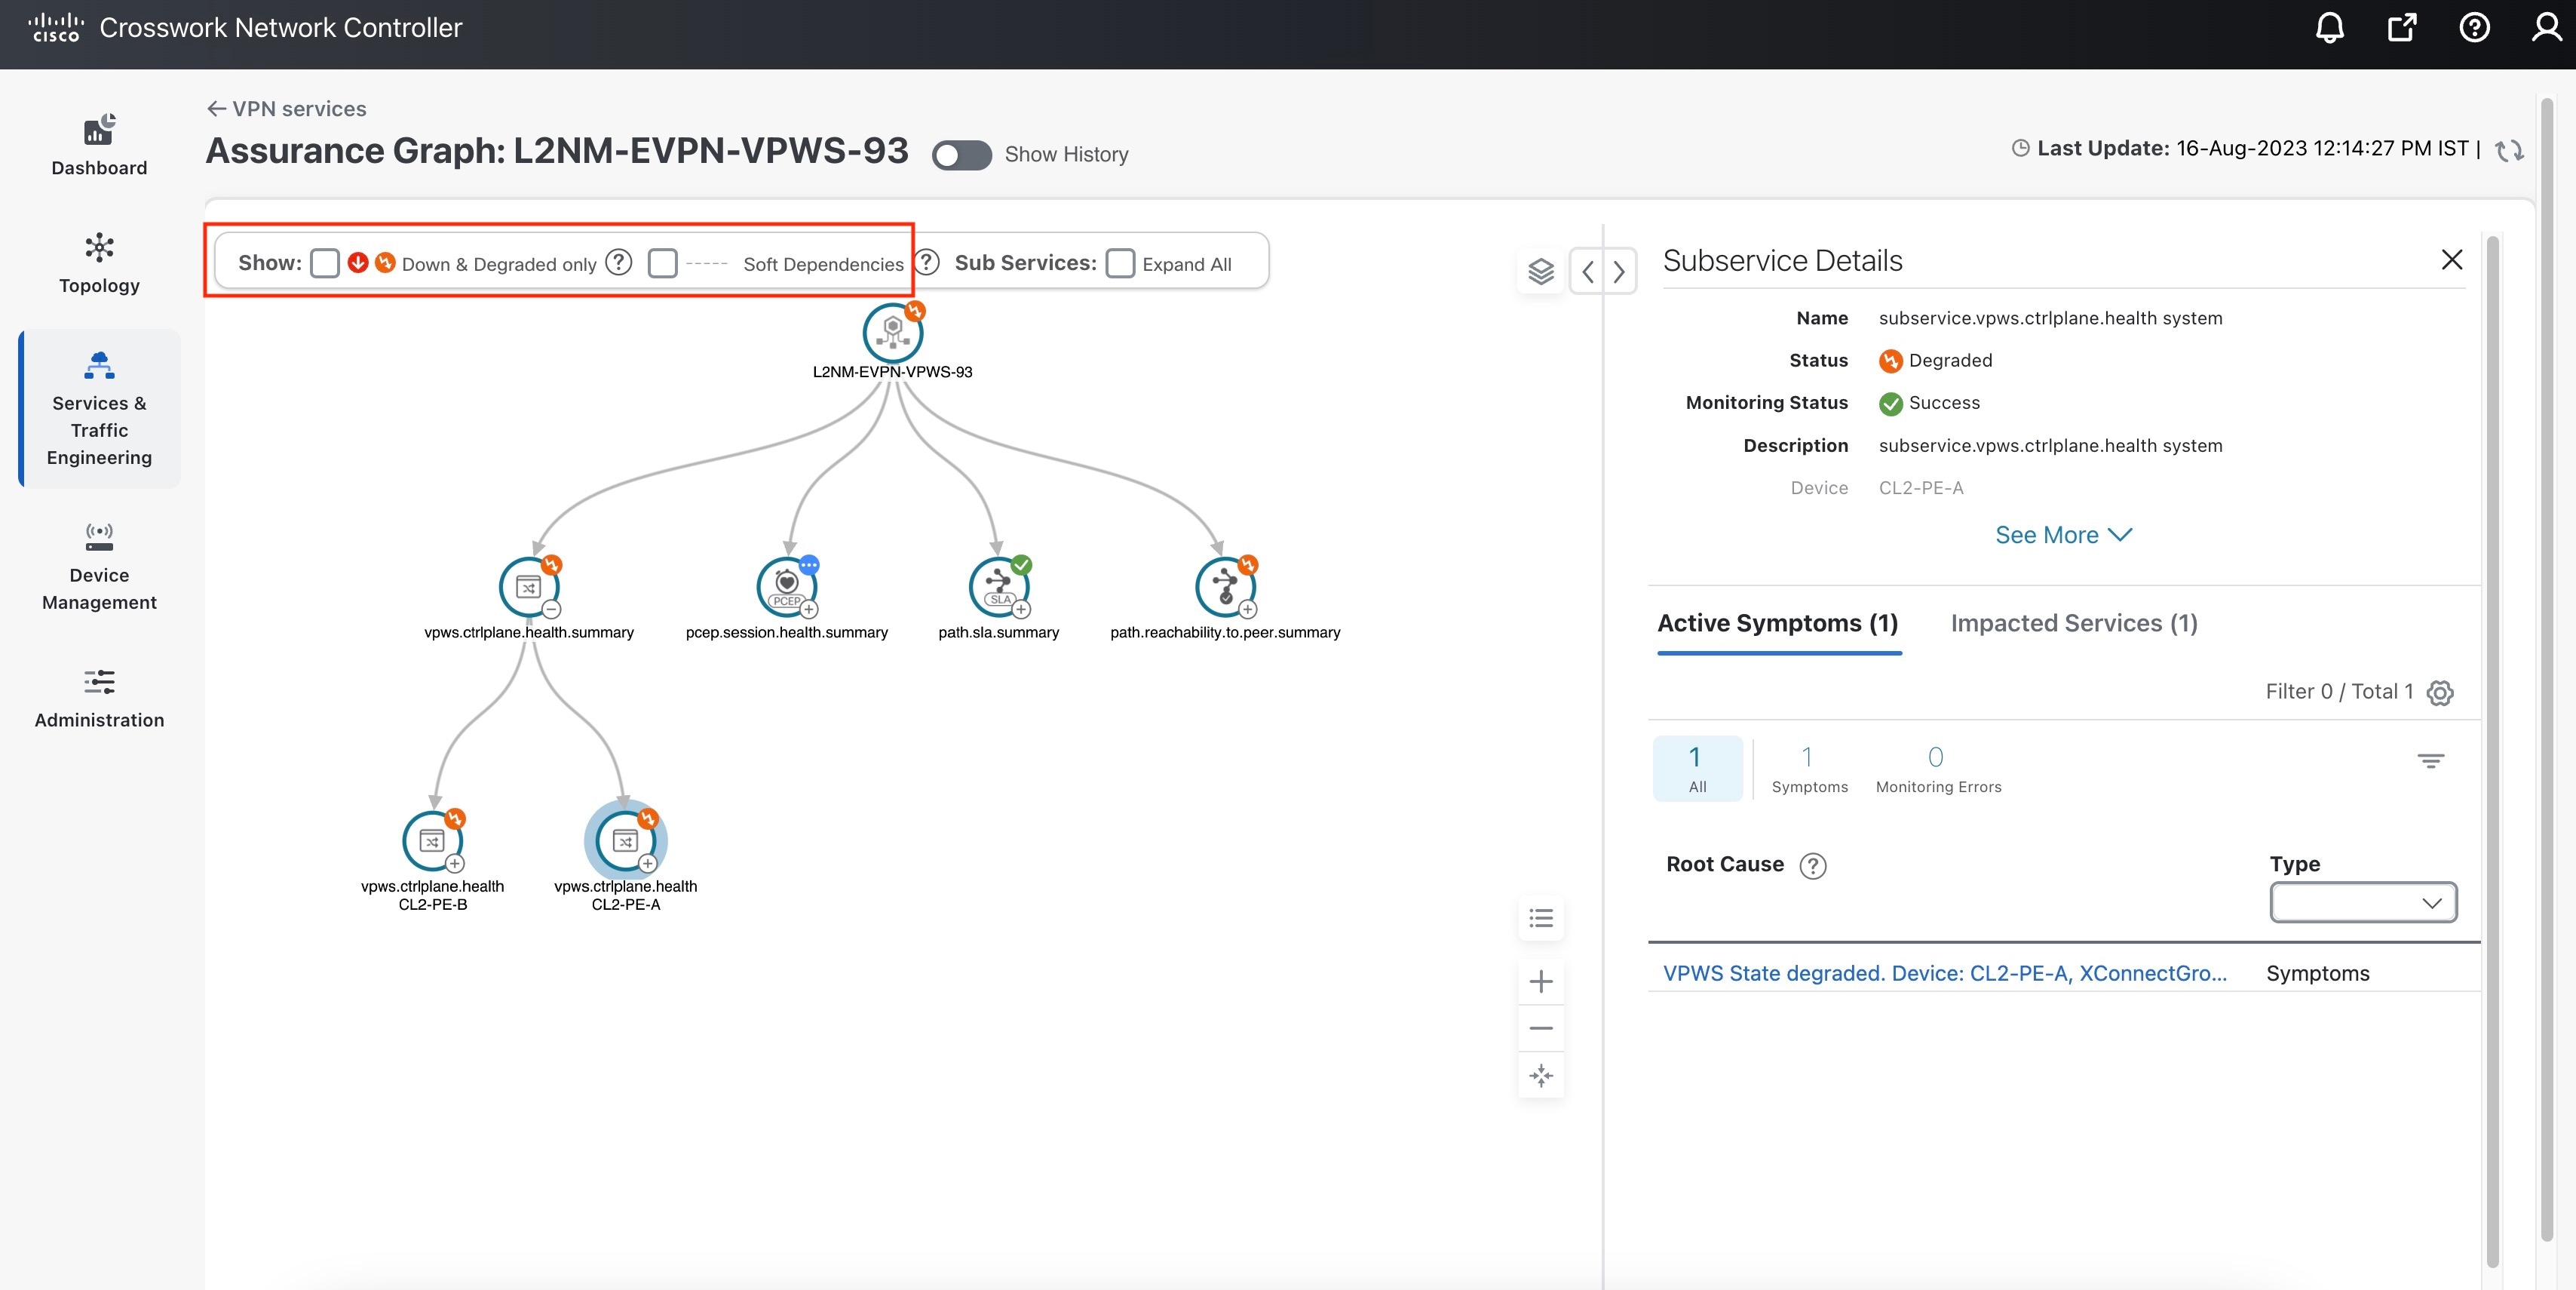
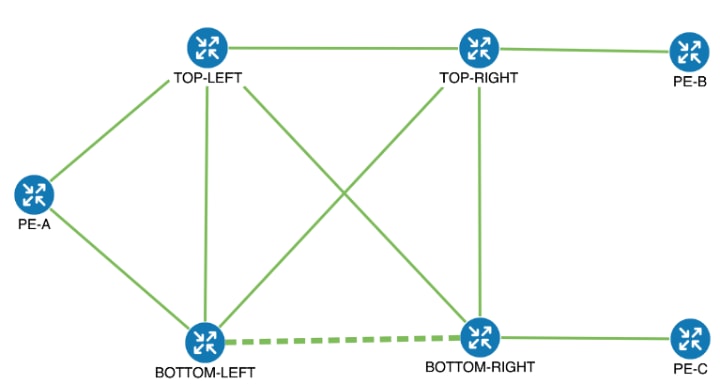
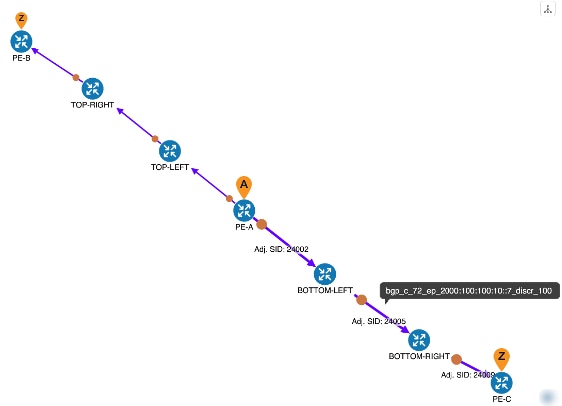
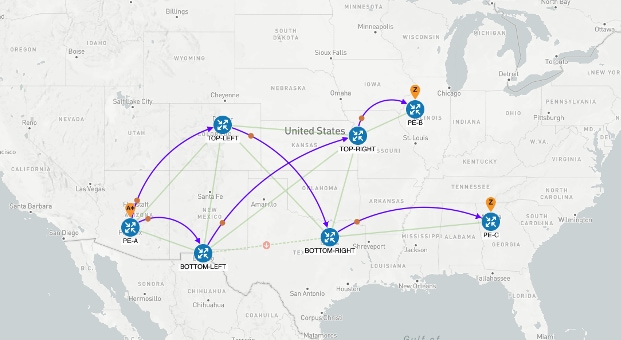
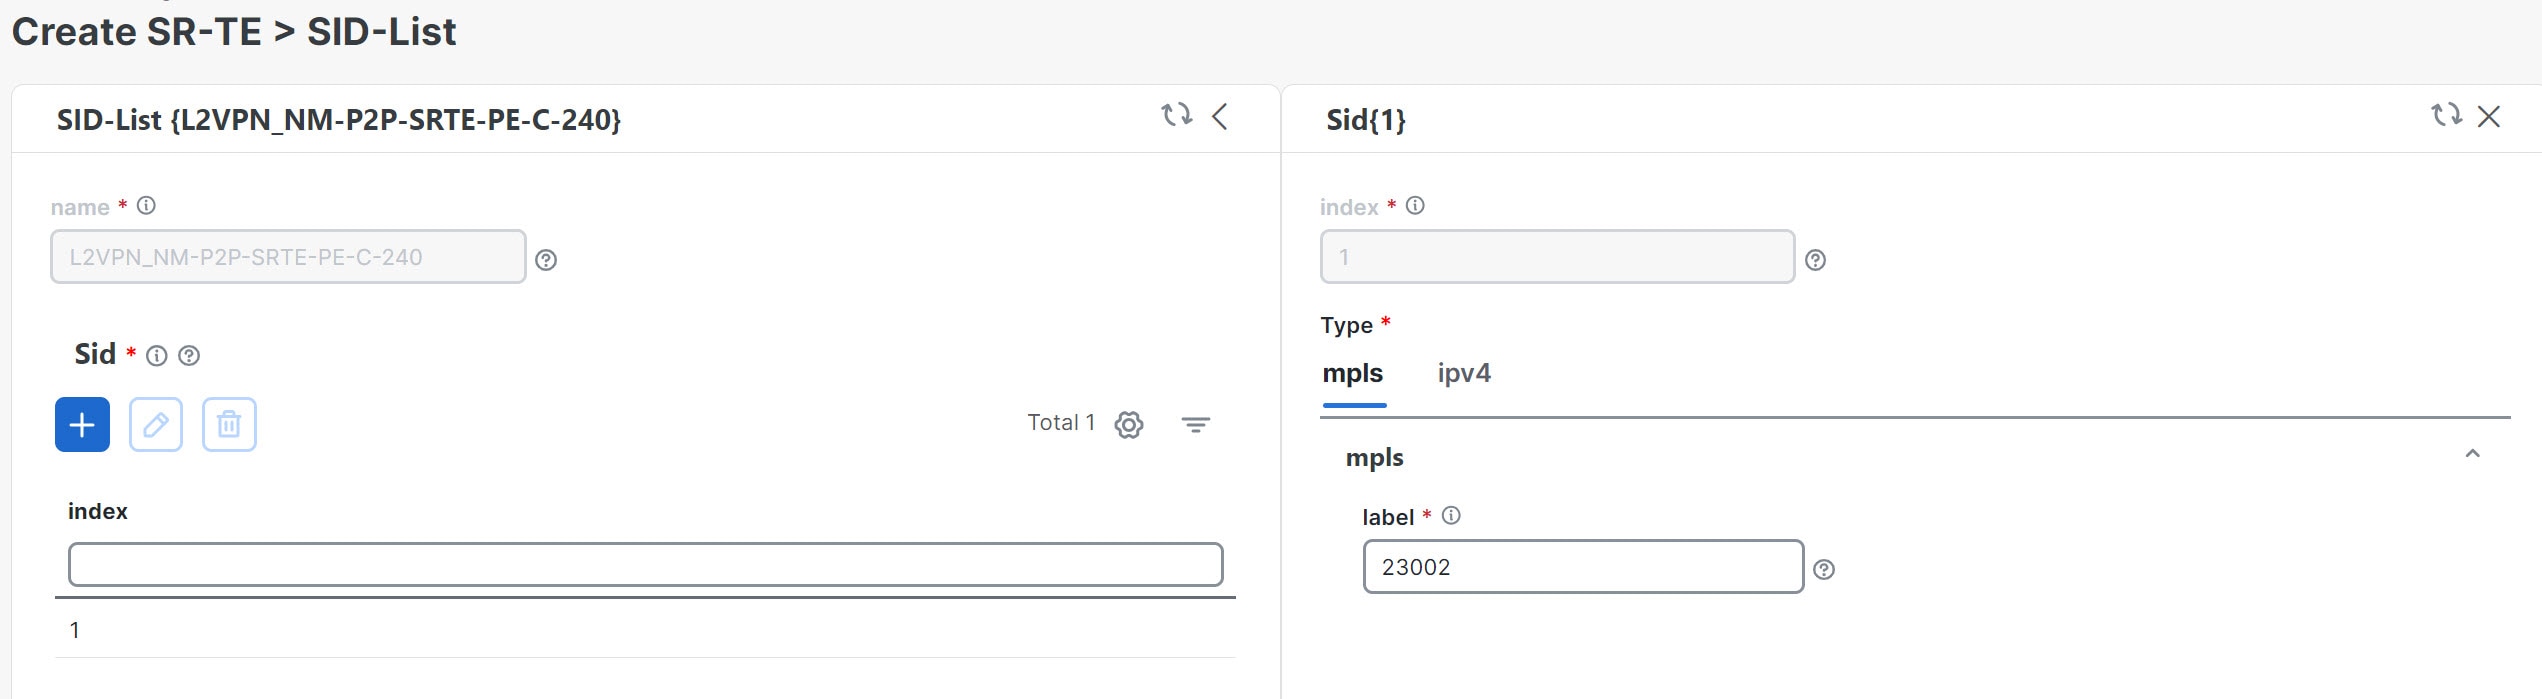
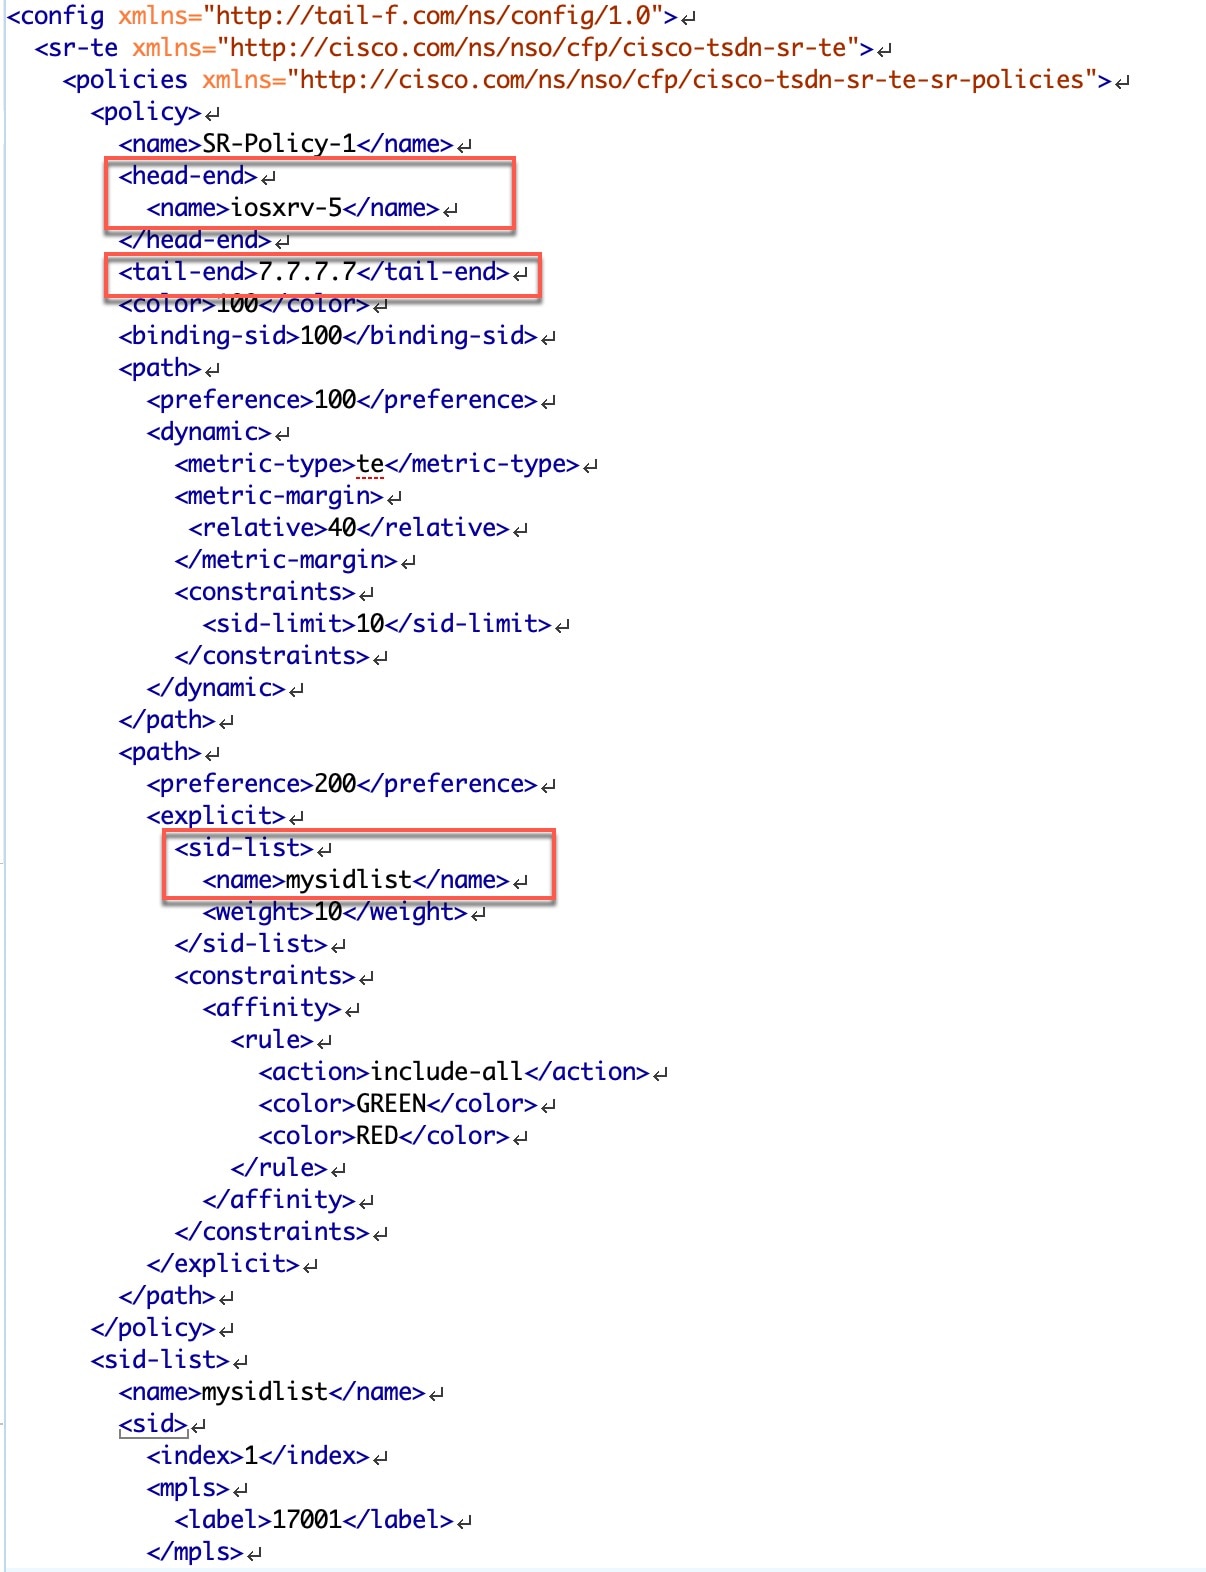
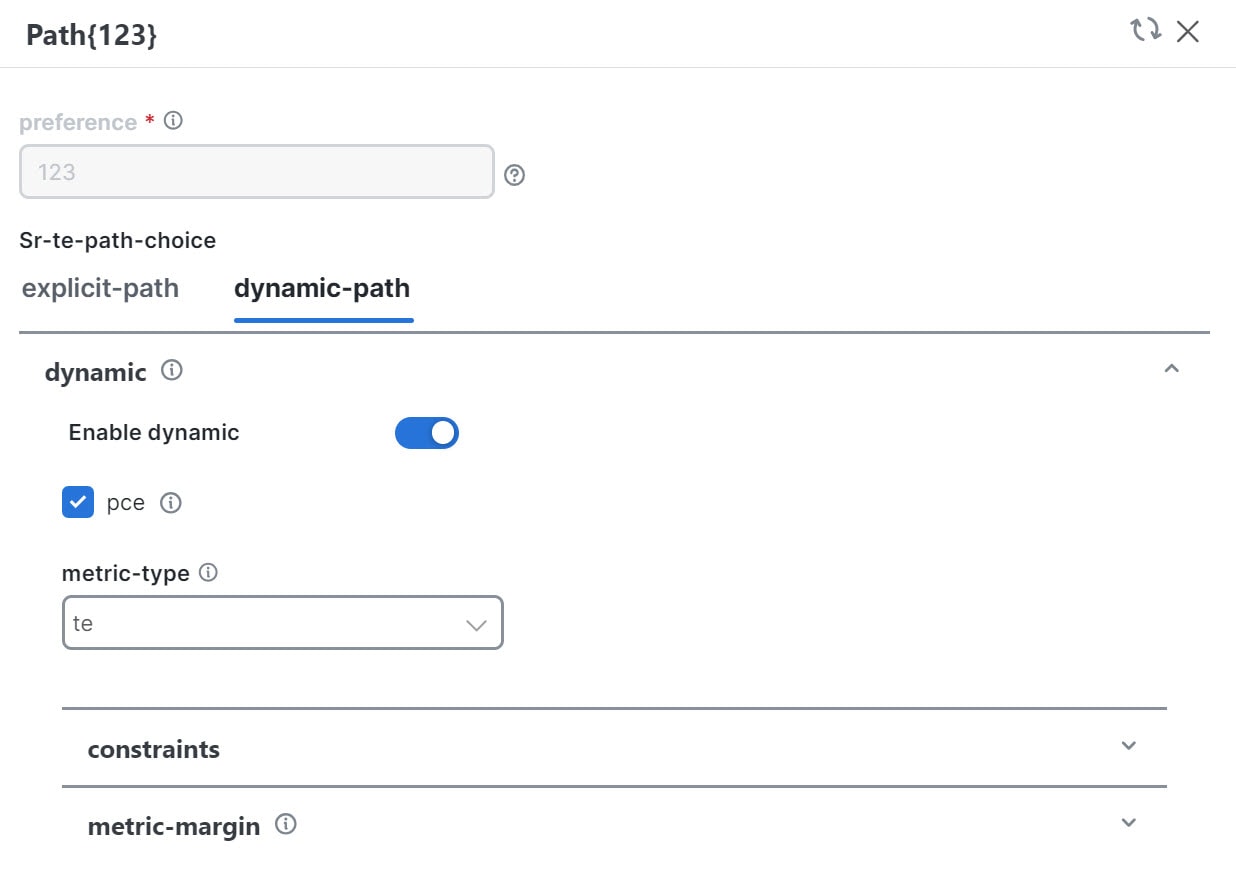
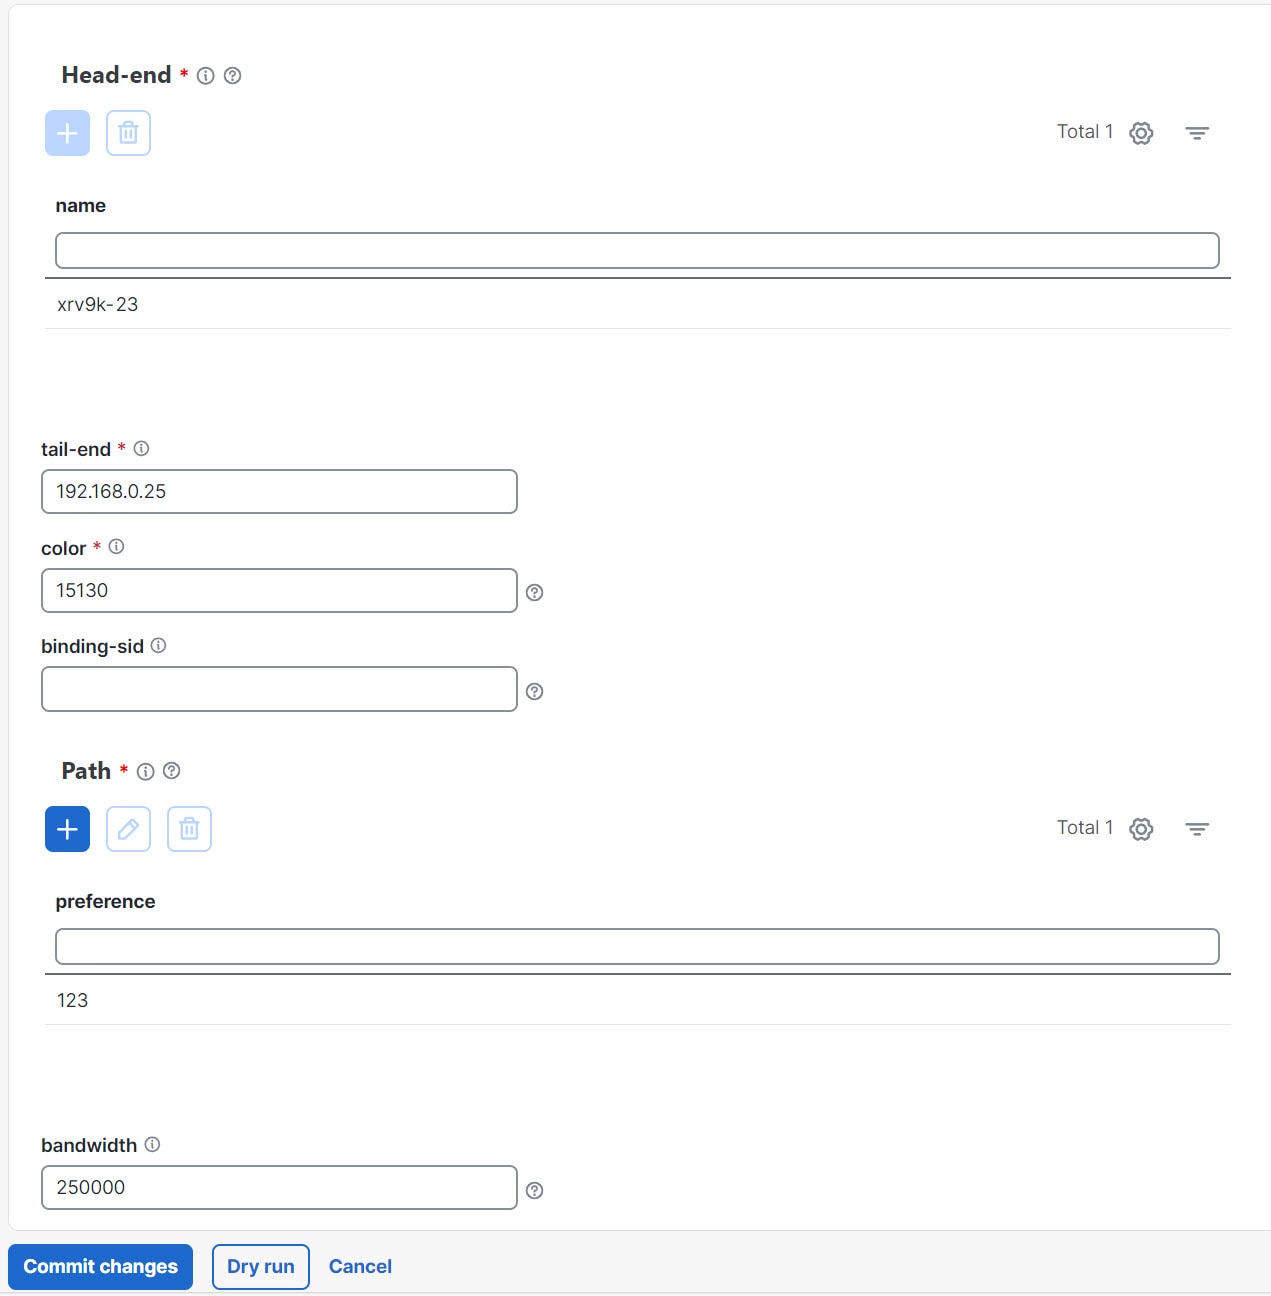
Scenario 3 – Mandate a Static Path for an EVPN-VPWS Service using an Explicit SR-TE policy

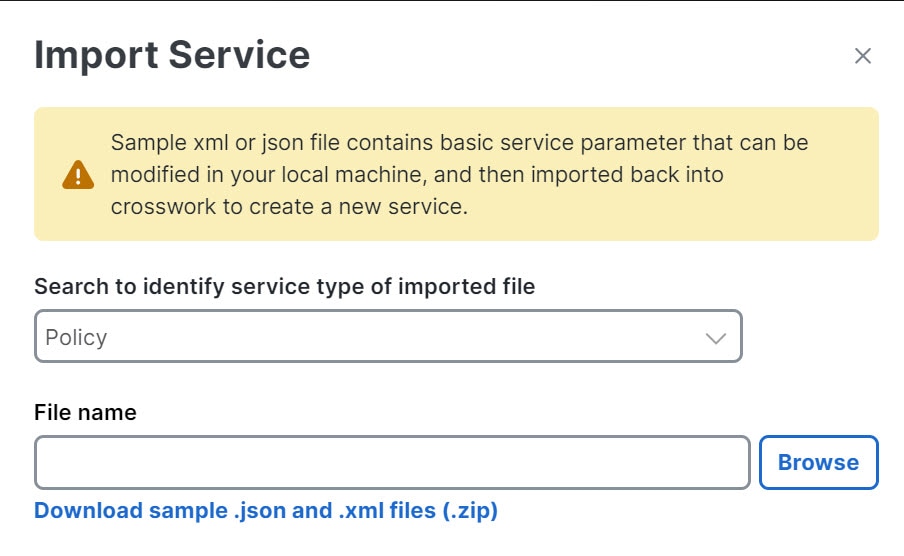
This scenario demonstrates the use of pre-defined templates to create a static path for mission-critical traffic. We will show how to quickly and easily create SR-TE policies and VPN services by uploading an XML containing all the necessary configurations. Additionally, we will use Service Health to analyze and monitor the provisioned services.

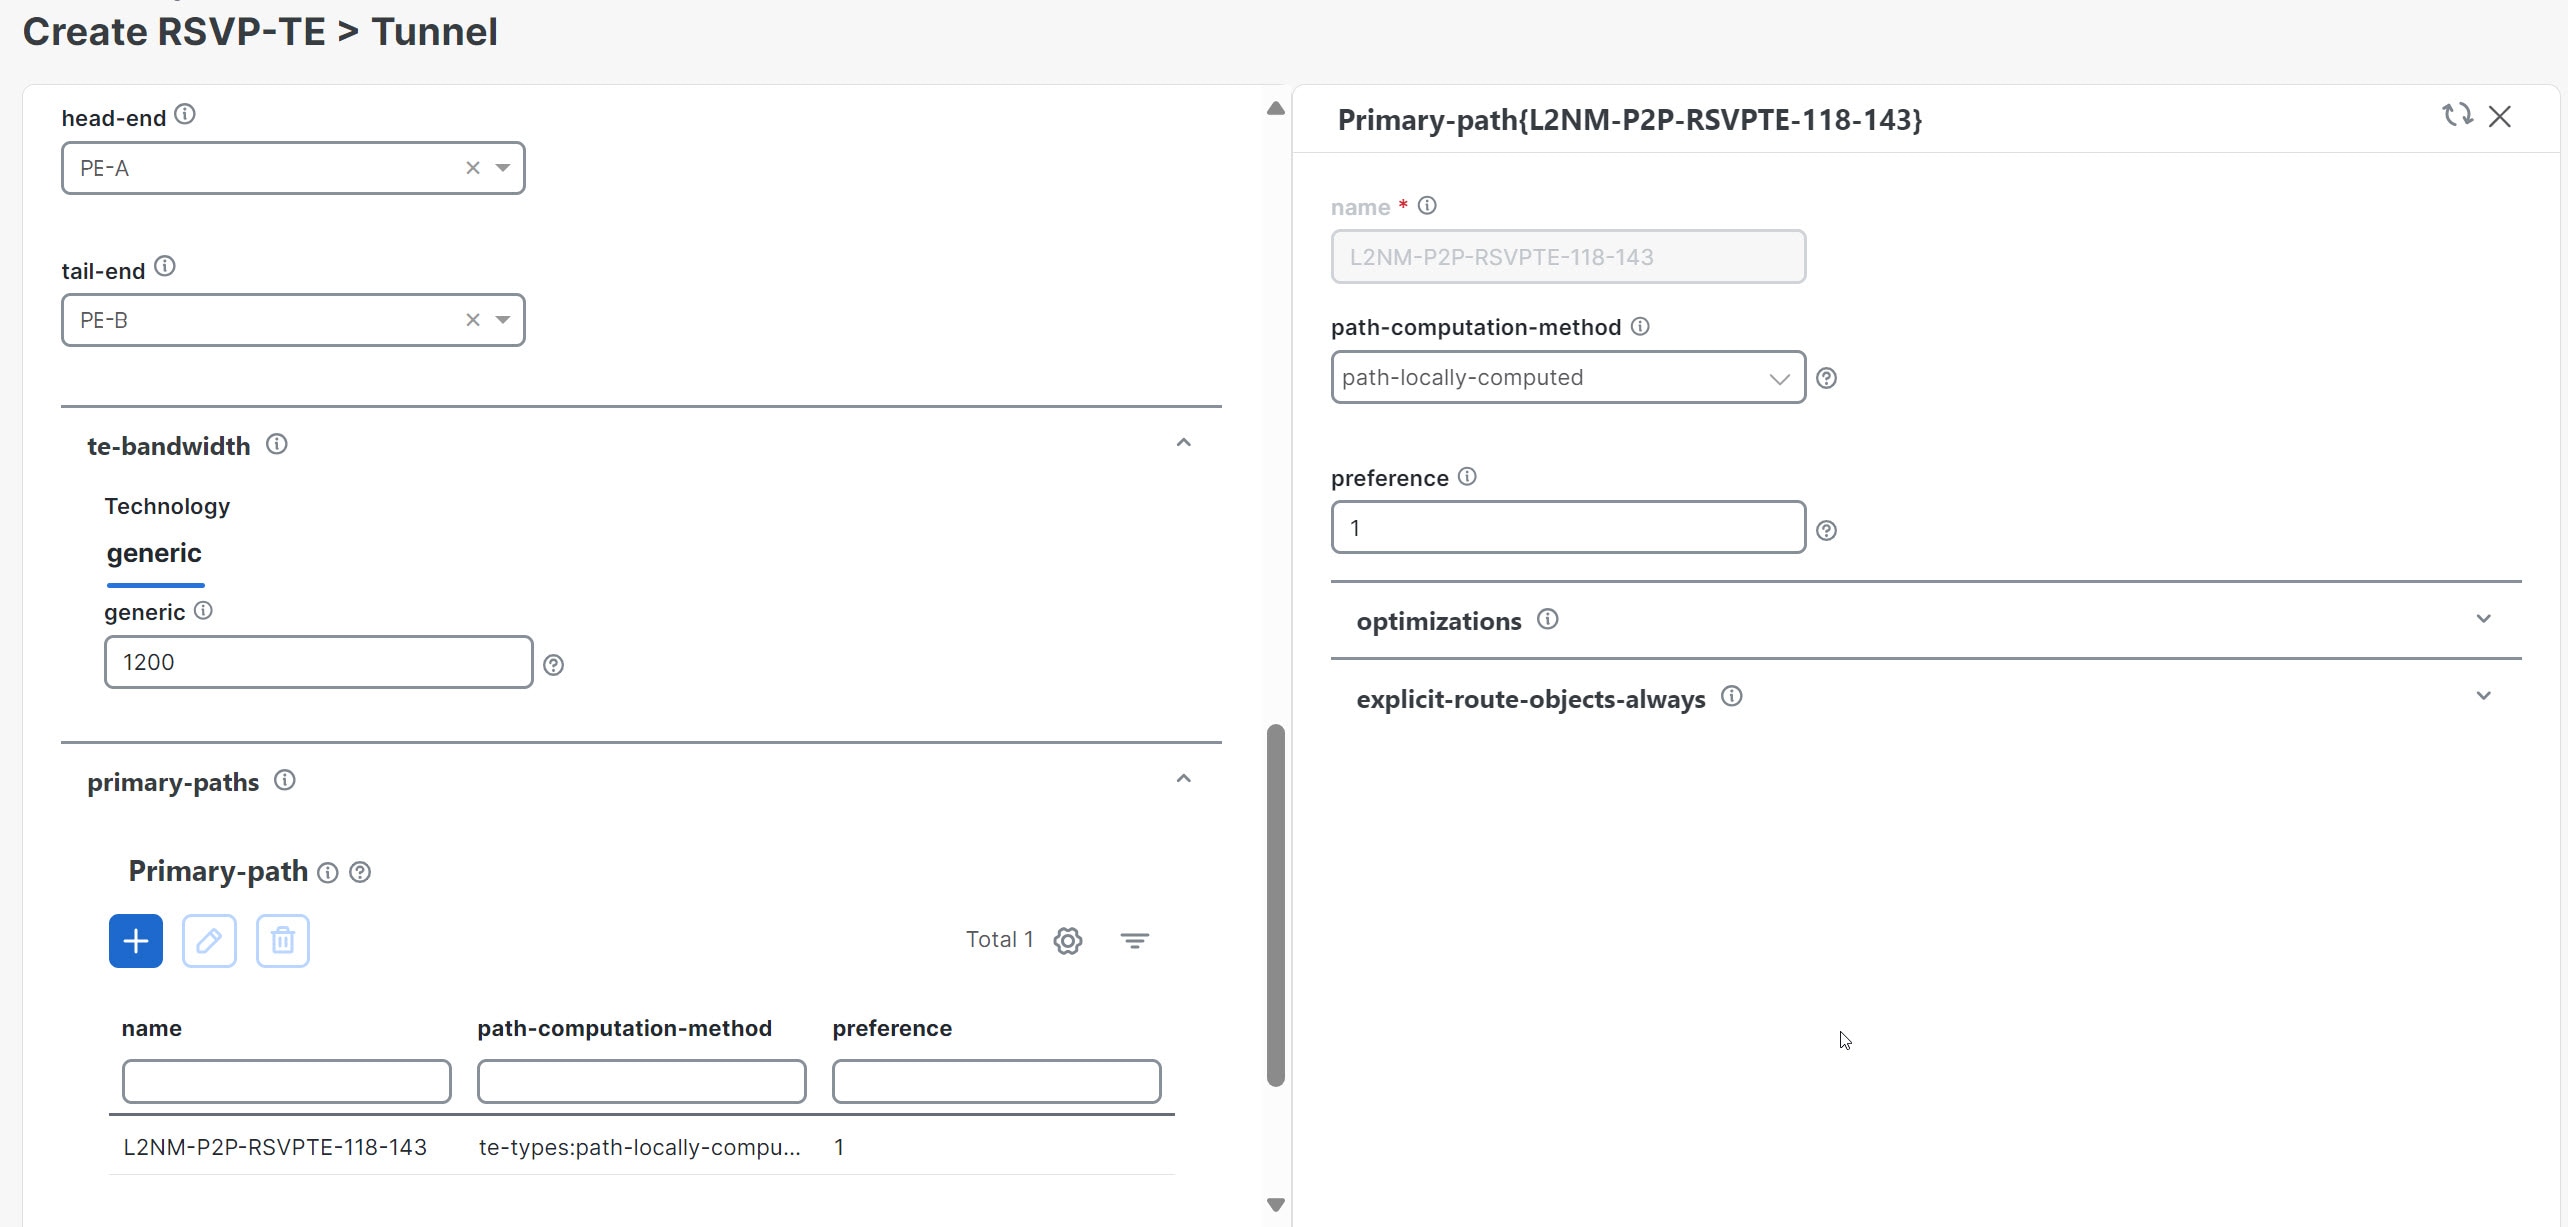
Scenario 4 – Provision an L2VPN service over an RSVP-TE tunnel with reserved bandwidth

This scenario focuses on bandwidth reservation to facilitate continuous stream transmission. We will demonstrate how to reserve bandwidth using RSVP-TE Tunnels and attach them to an L2VPN service to meet high-quality of service requirements for continuous streaming of rich media data.

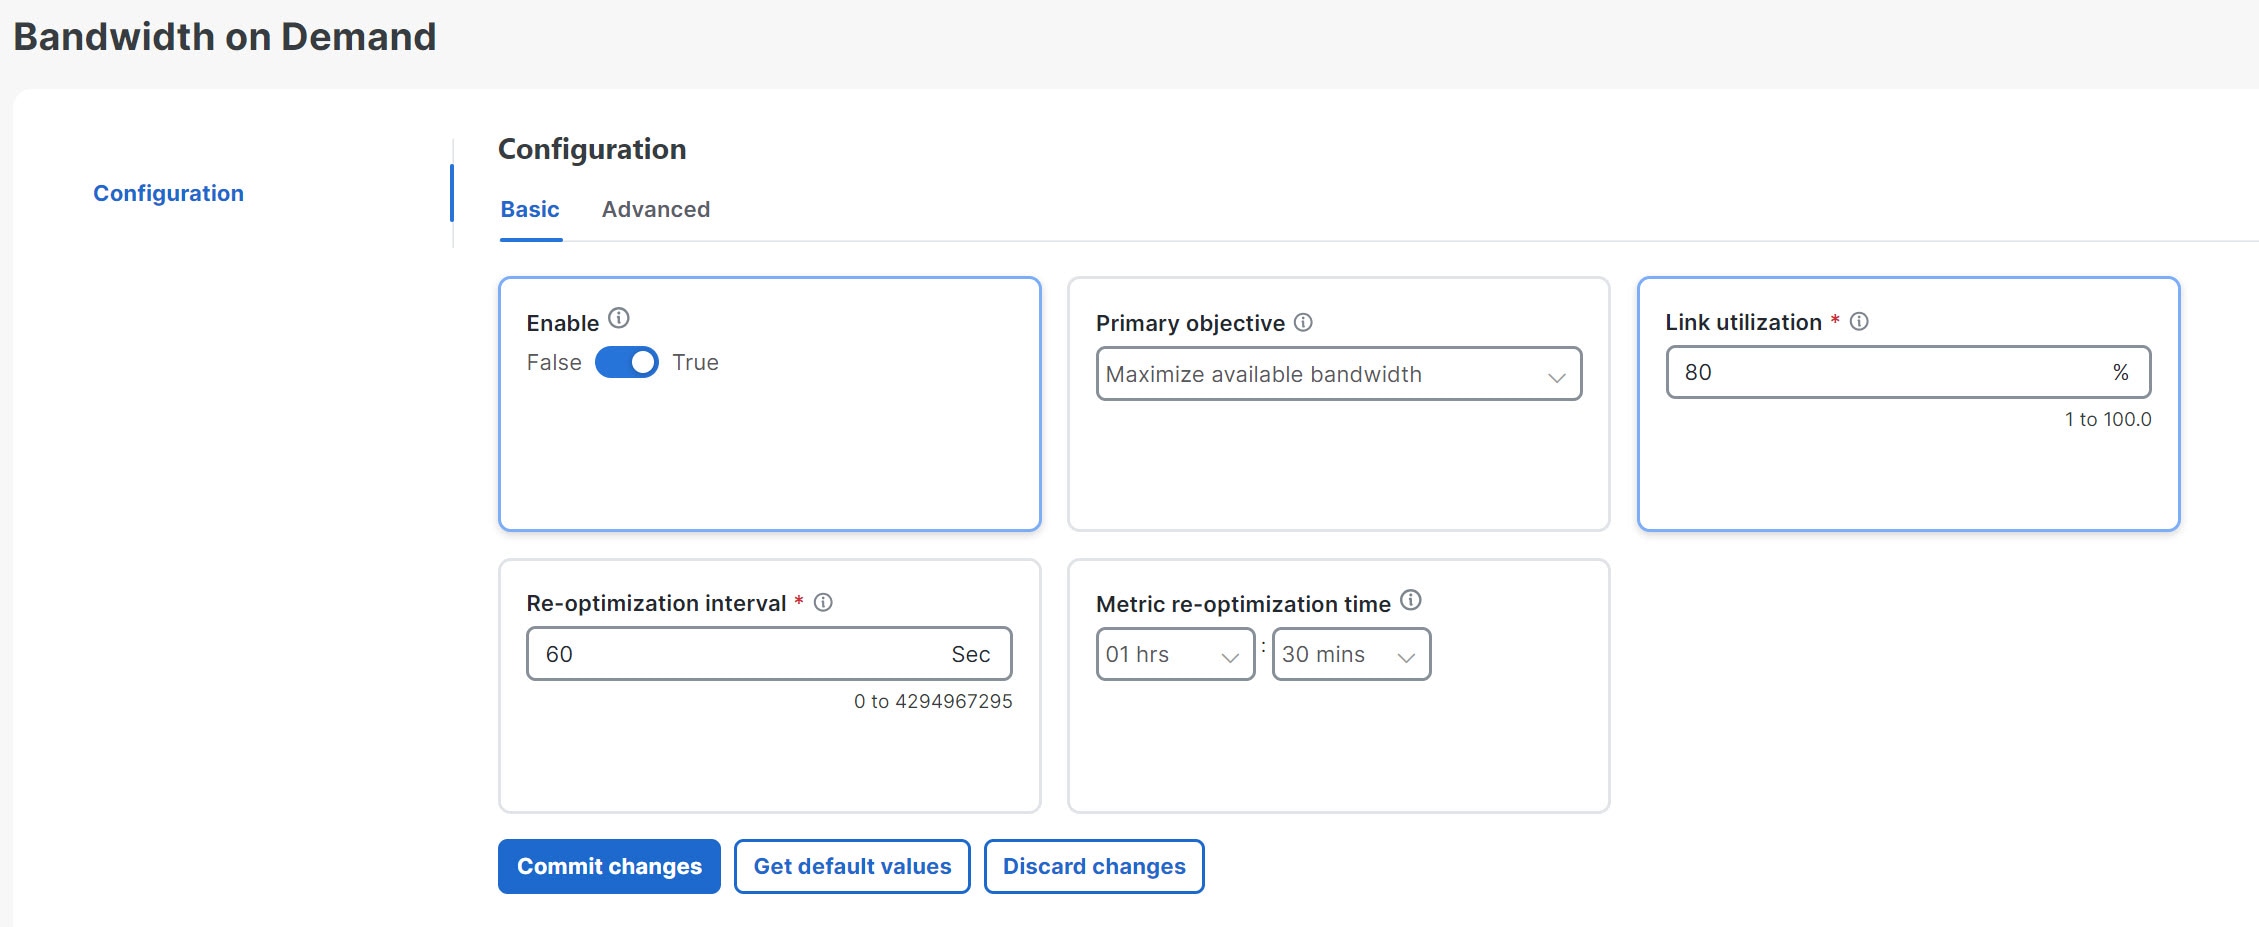
Scenario 5 – Provision a Soft Bandwidth Guarantee with Optimization Constraints

This scenario builds on the previous one, with the addition of BWoD configuration to reserve bandwidth on specific links to ensure a dedicated path.

Additional Resources

  • For information about segment routing and segment routing policies, see Crosswork Network Controller 7.0 Traffic Engineering and Optimization Guide.

  • Cisco Network Services Orchestrator documentation is included in the latest Network Services Orchestrator image.

  • To use custom templates in Crosswork Network Controller, you must pre-configure them in Cisco Network Services Orchestration (NSO). Once configured in NSO, the Crosswork Network Controller will display your custom template for selection when you provision a device or a service. For details on configuring custom templates, refer to Appendix: Custom Templates.

Scenario: Implement and maintain SLA for an L3VPN service for SR-MPLS (using ODN)

This scenario walks you through the procedure for provisioning an L3VPN service with a specific SLA objective: all traffic for this service must take the lowest-latency path. The customer requires this low-latency path for this service, as all of this service's traffic is a high priority. The customer also wants to use disjoint paths, that is, two unique paths that steer traffic from the same source to two unique destinations, avoiding common links so there is no single point of failure.

We'll achieve this using Segment Routing (SR) On-Demand Next Hop (ODN). SR ODN allows a service headend router to automatically instantiate an SR-TE policy to a BGP next-hop when required (on-demand). We configure the headend with an ODN template with a specific color that identifies the SLA. Crosswork will optimize the traffic path when it receives a prefix with that SLA-specific color. We define prefixes in a route policy that is associated with the L3VPN.

Crosswork Network Controller continues to monitor the network in a closed loop and automatically optimizes it based on the defined SLA in the event of a network event that impacts the service.

Within this workflow, we also have the option to enable Crosswork's Service Health monitoring and to use Flex-Algo as a constraint on how paths are computed and visualized. With Service Health monitoring, operators can gather quick insights into degraded and down services and then use these insights to visualize, inspect, and troubleshoot for improved network optimization.

With Flex-Algo, we can customize IGP shortest-path computations using the algorithms we define. IGP will compute paths based on a user-defined combination of metric types and constraints and present a filtered topology view based on our specific Flex-Algo definitions.

The following topology provides the base for this scenario:

Figure 1. Example topology for the scenario
Example Topology for the Scenario

In this scenario, we will:

  • Create a segment routing ODN template with a specific color on the endpoints to ensure that traffic is transported within an LSP (underlay) and that a best-path tunnel is created dynamically when a prefix with the specified color is received. The ODN template defines the SLA on which you want to optimize the path. In this case, we will optimize on latency.

  • Specify that the computed paths are disjoint: they will not share the same link.

  • Create a route policy on each endpoint to be used to bind the L3VPN to the ODN template. This route policy adds a color attribute to the customer prefixes and advertises via BGP to other endpoints. This color attribute indicates the SLA required for these prefixes.

  • Create an L3VPN service with three endpoints and enable Service Health monitoring.

  • Visualize how this overlay/underlay configuration optimizes the traffic path and automatically maintains the SLA while monitoring your service’s health.

Assumptions and prerequisites

  • To use ODN, BGP peering for the prefixes must be configured between the endpoints or PEs. Usually, for L3VPN, this is the VPNv4 and VPNv6 address family peering.

  • For Service Health enablement, Service Health must be installed. See Crosswork Network Controller 7.0 Installation Guide chapter, Install Crosswork Applications.

  • Before using the Assurance Graph in Service Health, ensure that the topology map nodes are fully configured and created with a profile associated with the service. Otherwise, the Subservice Details metrics will indicate that no value has been reported yet. See Crosswork Network Controller 7.0 Service Health Guide for further details.

  • L3VPN service monitoring supports XR devices but does not support XE devices. As a result, after creating an L3VPN service and enabling Service Health monitoring, the service monitoring may remain in a degraded state with a METRIC_SCHEDULER error if a provider and devices are removed and added back. To resolve this, service monitoring must be stopped and restarted.

  • (Optional) Flexible Algorithms and the IDs used must be configured in your network.


Note


Screen captures showing services and data are for example purposes only and may not always reflect the devices or data described in the workflow content.


Step 1 Create an ODN template to map color to an SLA objective and constraints

Disjointness constraints work by associating a disjoint group ID with the ODN template. Tunnels with the same disjoint group ID will be disjoint, i.e., they will use different links, nodes, and shared risk link groups depending on how the disjoint groups are configured.

We will create the following ODN templates:

  • Headend PE-A, color 72, latency, disjoint path (link), group ID 16 - L3VPN_NM-SRTE-ODN_72-a

  • Headend PE-A, color 71, latency, disjoint path (link), group ID 16 - L3VPN_NM-SRTE-ODN_71-a

  • Headend PE-B and PE-C, color 70, latency - L3VPN_NM-SRTE-ODN_70

  • Headend PE-B, color 72, latency - L3VPN_NM-SRTE-ODN_72-b

  • Headend PE-C, color 71, latency - L3VPN_NM-SRTE-ODN_71-c

For example purposes, we will show how to create the first ODN template - L3VPN_NM-SRTE-ODN_72-a. The other ODN templates can be created using the same procedure.

Before you begin

In this step, we will create an ODN template on each endpoint. The ODN template specifies the color and the intent; in this case, latency and disjointness. This ODN template will be used to dynamically create tunnels (on-demand) when prefixes with matching colors are received via BGP. Traffic to these prefixes will be automatically steered into the newly created tunnels, meeting the SLA objective and constraints intended for these prefixes and signaled using colors in the BGP routes.

Procedure


Step 1

From the main menu, choose Services & Traffic Engineering > Provisioning (NSO) > SR-TE > ODN-Template.

Step 2

Click to create a new template and give it a unique name. In this case, the name is L3VPN_NM-SRTE-ODN_72-a. Click Continue.

You may also browse for an existing template on your system to import the file. The information from the imported file is populated into the form.

Figure 2. SR-TE ODN-Template Page
SR-TE ODN-Template Page

Step 3

Choose the head-end device, PE-A, and specify the color 72.

Step 4

Under dynamic, select latency as the metric type. This is the SLA objective on which we are optimizing.

Step 5

Select the pce check box to specify that the path should be computed by the SR-PCE, not by the Path Computation Client (PCC).

Step 6

Define the required constraints. In this case, we want the computed paths to be disjointed because they must not share a link.

Under disjoint-path, choose link as the type, and specify a numeric group ID, in this case, 16, as the group-id.

Note


You may choose the group ID. All paths requested with the same group-id will be disjointed.

Note


Optionally, you may configure Flex-Algo as a constraint.

Figure 3. SR-TE ODN-Template
SR-TE ODN-Template

Step 7

Commit your changes or click Dry Run to check what will be configured on the devices before you commit.

Step 8

Check that the new ODN template appears in the table and its provisioning state is Success. Click in the Actions column and choose Config View to see the Yang model-based service intent data that details the ODN template you created.

Figure 4. Actions Column Menu
Actions Column Menu

Step 9

Create the other ODN templates listed above in the same manner.

Note


You can save some time by using the Clone function to build the other policies needed to complete this scenario. Simply select Clone from the Actions column, provide a new name for the clone, edit the values, and then select Commit.


Step 2 Create an L3VPN route policy

In this step, we will create a route policy for each endpoint, and we will specify the same color as defined in the ODN template. The route policy defines the prefixes to which the SLA applies. When traffic from the specified network with a matching color is received, paths are computed based on the SLA defined in the ODN template. We will create the following route policies by first setting the routing policy tag and routing policy destination prefix. The routing policy prefixes should match with the subnet prefix configured on the PE devices in the service:
  • Color 70, IPv4 prefix 70.70.70.0/30 - L3VPN_NM-SRTE-RP-PE-A-7

  • Color 71, IPv4 prefix 70.70.71.0/30 - L3VPN_NM-SRTE-RP-PE-B-7

  • Color 72, IPv4 prefix 70.70.72.0/30 - L3VPN_NM-SRTE-RP-PE-C-7

Procedure


Step 1

From the main menu, choose Services & Traffic Engineering > Provisioning (NSO) > L3VPN > Routing Policy Tag.

Step 2

Click to create a new routing policy tag and type the name of the tag set: COLOR_70. Click Continue.

This is used as a label to reference the set in actions and conditions.

Step 3

Under Tag-value, click + and type the tag-value: 70.

Figure 5. Routing Policy Tag
Routing Policy Tag

The tag value may be a number between 1 – 4294967295 and should match to a color value.

Step 4

Click Continue. The new routing policy tag name with the new tag value is visible. Click Commit changes.

Create the other two routing policy tags (COLOR_71 and COLOR_72) and tag values (71 and 72) by following the same steps above. Click Continue.

Step 5

Now, create the routing policy destination prefixes. From the main menu, choose Services & Traffic Engineering > Provisioning (NSO) > L3VPN > Routing Policy Destination Prefix.

Step 6

Click to create a new routing policy destination prefix and type the name DEST_PREFIX_SET_70.

The name of the prefix set will reference the set in match conditions.

Step 7

For Mode, select ipv4.

Step 8

Expand prefixes and click to add the ip-prefix to the prefix-list. Type 70.70.70.0/30 and click Continue.

Figure 6. Routing Policy Destination Prefix
Routing Policy Destination Prefix

Step 9

Create the other two routing policy destination prefixes (DEST_PREFIX_SET_71 and DEST_PREFIX_SET_72) by following the same steps.

Step 10

Now, we are ready to create the first route policy - L3VPN_NM-SRTE-RP-PE-A-7. The other route policies can be created using the same procedure. From the main menu, choose Services & Traffic Engineering > Provisioning (NSO) > L3vpn > Routing Policy.

Step 11

Click to create a new route policy and type a unique name for the top-level policy definition: L3VPN_NM-SRTE-RP-PE-A-7. Click Continue. The statements section appears.

Note

 
The Route Policy statement defines the condition and actions taken by the system.

Step 12

Expand statements, click to add the name of the policy statement (such as stmt1) and click Continue. The statement{stmt1} panel appears, showing conditions and actions sections.

Step 13

Expand conditions and then expand match-dest-prefix-set. In the prefix-set list, select or type the following: DEST_PREFIX_SET_70. This is what references a defined prefix set.

Note

 
Once selected, the Enable match-dest-prefix-set toggle, which will match a referenced prefix-set according to the logic defined in the match-set-options list, switches on.

Step 14

Expand actions and then expand bgp-actions.

Step 15

For bgp-actions, slide the Enable bgp-actions toggle to the on position. Toggling on bgp-actions defines the top-level container for BGP-specific actions.

Step 16

Now expand set-ext-community. Slide the Enable-set-ext-community toggle to the on position. Toggling on set-ext-community sets the extended community attributes.

Step 17

For Method and reference, select the Ext-community-set-ref list and select COLOR_70. The Ext-community-set-ref references a defined extended community set by name.

Figure 7. Route Policy Statement
Route Policy Statement

Step 18

Click X in the top-right corner to close the statement{stmnt1} panel and click Commit changes.

Step 19

Create the other route policies (L3VPN_NM-SRTE-RP-PE-B-7 and L3VPN_NM-SRTE-RP-PE-C-7) in the same manner.


After creating the L3VPN route policies, create the VPN profile for each route policy and then create and provision the L3VPN service. The VPN profile will be referenced from the L3VPN service. This will bind the route policy to the L3VPN service.

Step 3 Create and provision the L3VPN service

In this step, we will create the L3VPN service with three endpoints: PE-A, PE-B, and PE-C. Each endpoint will be associated with a vpn-instance-profile, which in turn points to a VPN profile that contains the route policy with the same color as specified in the ODN template. In this way, traffic that matches the specified prefixes and color will be treated according to the SLA specifications.

First, we will create the VPN profiles. The newly created VPN profiles will have the same names as the L3VPN routing policy names.

Procedure


Step 1

From the main menu, choose Services & Traffic Engineering > Provisioning (NSO) > L3VPN > VPN Profiles.

Step 2

Click to create a VPN profile to be referenced in the VPN service.

Step 3

Select the Id list and select L3VPN_NM-SRTE-RP-PE-A-7.

Now, create and provision the L3VPN service.

Step 4

From the main menu, choose Services & Traffic Engineering > Provisioning (NSO) > L3vpn > L3vpn-Service.

Step 5

Click to create a new service and type a new vpn-id: L3VPN_NM-SRTE-ODN-70. Click Continue.

A VPN identifier uniquely identifies a VPN and has a local meaning (for example, within a service provider network).

Step 6

Create vpn-instance-profile, which is a container that defines the route distinguisher (RD), route targets, and the export/import route policy. We will create vpn-instance-profiles for each endpoint, as follows:

  • L3VPN_NM_SR_ODN-IE-PE-A-7 with route distinguisher 0:70:70

  • L3VPN_NM_SR_ODN-IE-PE-B-7 with route distinguisher 0:70:71

  • L3VPN_NM_SR_ODN-IE-PE-C-7 with route distinguisher 0:70:72

    1. Expand vpn-instance-profiles and click to create a new vpn-instance-profile profile-id: L3VPN_NM_SR_ODN-I-PE-A-7. Click Continue.

    2. Enter the route distinguisher (rd) to differentiate the IP prefixes and make them unique. For this scenario, we are using 0:70:70.

    3. For address-family, click and select ipv4 from the list. Click Continue.

    4. Define the required VPN targets, including id, route-targets, and route-target-type (import/export/both).

    5. Under vpn-policies, in the export-policy list, choose the relevant VPN profile (which contains the route policy: L3VPN_NM-SRTE-RP-PE-A-7). This forms the association between the VPN and the ODN template that defines the SLA.

    6. Click X in the top-right corner when you are done.

    7. Similarly, create the other vpn-instance-profiles.

Step 7

Define each VPN endpoint: PE-A, PE-B, and PE-C.

  1. Expand vpn-nodes and click to select the relevant device from the list: PE-A. Click Continue.

  2. Enter the local-as number for network identification: 200.

  3. Expand active-vpn-instance-profiles and click to select the profile-id you created in the previously: L3VPN_NM-SRTE-RP-PE-A-7. Click Continue.

  4. Define the network access parameters for communication from the PE to the CE:

    • Under vpn-network-accesses, click to create a new set of VPN access parameters and provide a unique ID. Click Continue.

    • In the Interface-id field, type Loopback70. This is the identifier for the physical or logical interface. The identification of the sub-interface is provided at the connection level and/or the IP connection level.

    • Expand ip-connection > ipv4 and enter a local-address (70.70.70.1) and then prefix-length (30).

    • For routing protocols, click to create a unique id, set the type to bgp-routing, and then expand bgp to set the peer-as number (70), and the address-family (ipv4). In addition, set the bgp neighbor (70.70.70.2) and the multihop number (for example, 11) that indicates the number of hops allowed between the bgp neighbor and the PE device.

      Figure 8. L3vpn-Service Routing-protocol
      L3vpn-Service Routing-protocol
    • Click X in the top-right corner until you are back on the Create L3VPN screen.

    • Similarly, create the other VPN nodes: PE-B and PE-C.

Step 8

Commit your changes or click Dry Run to check what will be configured on the devices before you commit.

Step 9

Check that the new L3VPN service appears in the table and its provisioning state is Success.


Step 4 Enable Service Health monitoring

After creating and provisioning the required L3VPN services, you can start monitoring their health.

Before you begin

Select the newly created, unmonitored service, which will have a gray health indicator:

Procedure


Step 1

From the main menu, choose Services & Traffic Engineering > VPN Services. The map opens on the left side of the page, and the table opens on the right side.

Step 2

In the Actions column, click for the service you want to start monitoring the health.

Step 3

Click Start Monitoring.

Figure 9. Start Monitoring VPN Services
Start Monitoring VPN Services

Note

 
The Health column color coding indicates the health of the service:
  • Blue = Initiated

  • Green = Good

  • Orange = Degraded

  • Red = Down

  • Gray = Not Monitoring

Step 4

In the Monitor Service dialog box, select the Monitoring Level. For help with selecting the appropriate monitoring level for your needs, see Crosswork Network Controller 7.0 Service Health Guide.

Figure 10. Monitor Service
Monitor Service

Step 5

Click Start Monitoring.

Note


Once you have started monitoring the health of the service, in the Actions column, if you click to view additional Service Health options, you will see: Stop Monitoring, Pause Monitoring, Edit Monitoring Settings, and Assurance Graph.

Figure 11. Service Health Options

Service Health Options

Step 6

Repeat these steps for each service that you wish to start health monitoring.


Step 5 Visualize the new VPN service on the map to see the traffic path

Procedure


Step 1

In the L3VPN Service table, click on the service name or click in the Actions column and choose View Details from the menu.

The map opens, and the service details are shown to the right of the map.

or

From the main menu, choose Services & Traffic Engineering > VPN Services.

The map opens, and a table of VPN services is displayed to the right of the map.

Click on the VPN in the Services table. If there are many services in the table, you can filter by name, type, or provisioning state to help locate the VPN.

In the map, the VPN is an overlay on the topology. It shows a representation of the three endpoints and a dashed line indicating that it is a virtual path.

Figure 12. VPN service on the topology
VPN Service on the Topology

Select the Show Participating Only check box to see only the devices involved in the selected VPN.

Step 2

In the Actions column, click

to drill down to a detailed view of the VPN service, including the device configurations and the computed transport paths.

Step 3

To see the computed paths for this VPN, click on the Transport tab in the Service Details pane. All the dynamically created SR-TE policies are listed in the Transport tab. Select one or more SR-TE policies to see the path from endpoint to endpoint on the map.

In this example, we examine the disjoint paths computed from PE-A to PE-B and from PE-A to PE-C.

Figure 13. Computed disjoint paths
Computed Disjoint Paths

Step 4

To see the physical path between the endpoints, select the Show IGP Path check box in the top-left corner of the map. Hover with your mouse over a selected policy in the table to highlight the path in the map and show prefix SID and routing information.

Figure 14. Physical path details
Physical Path Details

Step 5

To filter the topology to a specific Flex-Algo constraint and visualize nodes and links you have configured manually in your network, click the button at the top right of the map and do the following:

Figure 15. Flex-Algo tab
Flex-Algo Tab
  1. Click the Flex Algo tab.

  2. From the drop-down list, choose up to 2 Flex-Algo IDs.

  3. View the Flex-Algo Types and confirm that the selection is correct. Also, note the color assignments for each Flex-Algo ID.

  4. (Optional) Check the Show selected Flex Algo topology only check box to isolate the Flex-Algo IDs on the topology map. When this option is enabled, SR policy selection is disabled.

  5. Check the Show Flex Algo A+B links only to show only those links and nodes that participate in both Flex-Algos.

    Suppose a selected Flexible Algorithm is defined with a criteria, but there are no links and node combinations that match it (for example, a defined affinity to include all nodes or links with the color blue). In that case, the topology map will be blank. If a selected Flexible Algorithm is not configured on a node or link, the default blue link or node color appears.

  6. Click Apply. You must click Apply for any additional changes to your Flex-Algo selections to see the update on the topology map.

  7. (Optional) Click Save View to save the topology view and Flexible Algorithm selections.


Step 6 Observe automatic network optimization

Procedure


Observe automatic network optimization

The SR-PCE constantly monitors the network and automatically optimizes the traffic path based on the defined SLA. For illustration purposes, let’s look at what happens when one of the links goes down, in this case, the link between P-BOTTOMLEFT and P-BOTTOMRIGHT. This means the previous path from PE-A to PE-C is no longer viable. Therefore, the SR-PCE computes an alternative path, from PE-A to PE-C and from PE-A to PE-B, to compensate for the down link and maintain the disjoint paths.

Recomputed paths:

Source and Destination Old path New path
PE-A > PE-C PE-A > P-BOTTOMLEFT > P‑BOTTOMRIGHT > PE-C PE-A > P-TOPLEFT > P‑BOTTOMRIGHT > PE-C
PE-A > PE-B PE-A > P-TOPLEFT > P‑TOPRIGHT > PE‑B PE-A > P-BOTTOMLEFT > P‑TOPRIGHT > PE-B
Figure 16. Automatic network optimization
Automatic Network Optimization

Step 7 Inspect a degraded service using Service Health to determine active symptoms

By analyzing the root cause of reported active symptoms and impacted services, you can determine what issues must be addressed first to maintain a healthy setup and what requires further inspection and troubleshooting.

To view the active symptoms and root causes for service degradation:

Before you begin

Ensure that service health monitoring is enabled for the service you want to inspect.


Note


L3VPN service monitoring is supported on XR devices and not on XD devices. For an L3VPN service being monitored, if a provider and devices are deleted, and then added again, the monitoring status remain in the degraded state with a METRIC_SCHEDULER error. To recover from this error, stop and restart the service monitoring.


Procedure


Step 1

From the main menu, choose Services & Traffic Engineering > VPN Services. The map opens on the left side of the page, and the table opens on the right side.

Step 2

In the Actions column, click and click View Details. The Service Details panel appears on the right side.

Step 3

Select the Health tab and click the Active Symptoms tab. The Active Symptoms table displays Active Symptoms and Monitoring Errors by default. To filter the table to show only the Active Symptoms, either click the Symptoms tab in the mini dashboard above the table or select Symptoms from the filter box under the Type. The table now shows a filtered list containing only the Active Symptoms.

Review the Active Symptoms for the degraded service (including the Root Cause, Subservice, Type, Priority, and Last Updated details).

Figure 17. Active Symptoms in Service Details
Active Symptoms in Service Details

Step 4

Click on a Root Cause to view the Symptom Details and the Failed Subexpressions & Metrics information. As required, you can expand or collapse all of the symptoms listed in the tree. In addition, use the Show Only Failed toggle to focus only on the failed expression values.

Figure 18. Root Cause in Service Details
Root Cause in Service Details

Step 5

Click the Transport and Configuration tabs and review the details provided.

Step 6

Click X in the top-right corner to return to the VPN Services list.

Step 7

In the Actions column, click for the required degraded service and click Assurance Graph. The topology map of services and subservices appear with the Service Details panel showing Service Key, Status, Monitoring Status, Monitoring Settings, Sub Services, and Active Symptoms details.

This may take up to 5-10 minutes to update after a service has been enabled for monitoring.

Metrics such as Jitter-RT (Jitter Round Trip), Latency-RT (Latency Round Trip), PktLoss-DS (Packet Loss from Destination to Source), and PktLoss-SD (Packet Loss from Source to Destination) also appear (information collected using Y.1731 probes). Additionally, a table of Active Symptoms listing Root Cause, Subservice, Priority, and Last Updated details is populated.

Figure 19. Assurance Graph Details
Assurance Graph Details

At the top-right of the map, select the stack icon to select the appearance option for the Subservices: State + Icon + Label or State + Icon.

Figure 20. Appearance Option in Assurance Graph
Appearance Option in Assurance Graph

Step 8

By default, the Assurance Graph displays a concise view with only the service and the top level subservices (aggregator nodes). Click the icon in the nodes to expand the graph and to view the dependent details. To expand all the nodes at once, click the Subservices: Expand All check box at the top.

Step 9

Select a degraded subservice in the Assurance Graph. The Subservice Details panel appears with subservice metrics, and subservice-specific Active Symptoms and Impacted Services details.

  • Active Symptoms: Provides symptom details for nodes actively being monitored.

  • Impacted Services: Provides information for services that are impacted by issues based on historical monitoring of health status.

Figure 21. Degraded Subservice in the Assurance Graph
Degraded Subservice in the Assurance Graph

Note

 
At the top left of the map, check the Down & Degraded only or Soft Dependencies check boxes to isolate the subservices further. Soft Dependencies imply that a child subservice’s health has a weak correlation to its parent’s health. As a result, the degraded health of the child will not result in the parent’s health degradation.

Note

 
In some cases, the Summary node feature is available and summarizes the aggregated health status of child subservices and reports a consolidated health status to a service node. The Summary node feature is available in both L2VPN multipoint Basic and Advanced monitoring models.
  • Basic monitoring subservices:

    • Device—Summarizes the health status of all underlying Devices participating in the given L2VPN service.

    • Bridge Domain—Summarizes the L2VPN service’s Bridge Domain health status across all participating devices.

  • Advanced monitoring subservices (in addition to what is also available with Basic monitoring):

    • EVPN—Summarizes the health status of all underlying subservices, such as BGP Neighbor Health and MacLearning Health, across all participating PE endpoints and provides a consolidated overall EVPN health summary status.

    • Transport—Summarizes the health status of all underlying subservices—SR-ODN (dynamic), SR Policy (statically configured), and RSVP TE Tunnel, across all participating PE endpoints and provides a consolidated overall Transport health summary status.

    • SR-PCEP—Summarizes the health status of all the underlying subservices that are monitoring the PCEP sessions. Each underlying subservice monitors the health of the PCEP session on a particular device participating in the given VPN service.

Figure 22. Summary Node Feature
Summary Node Feature

Step 10

Inspect the Active Symptoms and Impacted Services information and the root causes associated with the degraded service to determine what issues need to be addressed to maintain a healthy setup.

To further troubleshoot a service health issue (such as a degraded device due to data fetching issues), follow these steps to determine whether the problem is related to a collection job.

Step 11

From the main menu, choose Administration > Collection Jobs.

The Collection Jobs page appears.

Step 12

Click the Parameterized Jobs tab.

Step 13

Review the Parameterized Jobs list to identify the devices that may have service health degradation issues. By reviewing Parameterized Jobs, you can identify and focus on gNMI, SNMP, and CLI-based jobs by their Context ID (protocol) for further troubleshooting purposes.

Step 14

In the Job Details panel, select the collection job you want to export and click to download the status of collection jobs for further examination. The information provided is collected in a .csv file when the export is initiated.

Note

 
When exporting the collection status, you must fill in the information each time an export is executed. In addition, make sure to review the Steps to Decrypt Exported File content available on the Export Collection Status dialog box to ensure you can access and view the exported information.

Step 15

Click Export.

Step 16

To check the status of the exported collection job data, click View Export Status at the top right of the Job Details panel. The Export Status Jobs panel appears, providing the status of the export request.

Step 17

Review the exported .csv file for collection job details and the possible cause of the degraded device.


Summary and conclusion

As we observed in this example, operators can use Crosswork Network Controller to orchestrate L3VPNs with SLAs and to maintain these SLAs using SR-TE policies that continuously track network conditions and automatically react to optimize the network. This automation increases efficiency and reduces human error, which is generally unavoidable with manual tasks. Enabling Service Health to monitor provisioned services allows for more detailed symptoms, metrics, and analysis of each service.

Scenario: Implement and maintain SLA for an L3VPN service for SRv6 (using ODN)

This scenario walks you through the procedure for provisioning an L3VPN service that requires a specific SLA objective. In this example, the lowest latency path is the SLA objective. The customer requires a low latency path for high-priority traffic. The customer wants to use disjoint paths, i.e., two unique paths that steer traffic from the same source to the same destination, avoiding common links so there is no single point of failure. The customer also wants to enable SRv6, which utilizes the IPv6 protocol to handle packets more efficiently, increase security and performance, and allow for a significantly larger number of possible addresses.

This is achieved using Segment Routing (SR) On-Demand Next Hop (ODN). ODN allows a service head-end router to automatically instantiate an SR-TE policy to a BGP next-hop when required (on-demand). The headend is configured with an ODN template with a specific color that defines the SLA upon which the traffic path will be optimized when a prefix with the specified color is received. Prefixes are defined in a route policy that is associated with the L3VPN.

Crosswork Network Controller continues to monitor the network and automatically optimizes it in a closed loop based on the defined SLA.

The following topology provides the base for this scenario:

Figure 23. Example topology for the scenario
Example Topology for the Scenario

In this scenario, we will:

  • Create a segment routing ODN template with a specific color on the endpoints to ensure that traffic is transported within an LSP (underlay) and that a best-path tunnel is created dynamically when a prefix with the specified color is received. Enable SRv6 (IPv6) for service and link details. The ODN template defines the SLA on which you want to optimize the path. In this case, we will optimize on latency.

  • Specify that the computed paths be disjoint: they will not share the same link.

  • Create a route policy on each endpoint to be used to bind the L3VPN to the ODN template. This route policy adds a color attribute to the customer prefixes and advertises via BGP to other endpoints. This color attribute is used to indicate the SLA required for these prefixes.

  • Create an L3VPN service with 3 endpoints: PE-A, PE-B, and PE-C. This is the overlay configuration.

  • Visualize how this overlay/underlay configuration optimizes the traffic path and automatically maintains the SLA.

Assumptions and prerequisites

  • To use ODN with SRv6, BGP peering for the prefixes must be configured between the endpoints/PEs. Usually for L3VPN, this is the VPNv4 and VPNv6 address family peering, and this BGP peering must be over IPv6.

The procedure to implement and maintain SLA for an L3VPN service for SRv6 using ODN is detailed in this section.

Step 1 Create an ODN template to map color to an SLA objective and constraints

We will create the following ODN templates:

  • Headend PE-A, color 72, latency, disjoint path (link), group ID 16 - L3VPN_NM-SRTE-ODN_72-a

  • Headend PE-A, color 71, latency, disjoint path (link), group ID 16 - L3VPN_NM-SRTE-ODN_71-a

  • Headend PE-B and PE-C, color 70, latency - L3VPN_NM-SRTE-ODN_70

    • With multiple headends in the SRv6 enabled ODN template, the same locator name should be configured on the headend routers. Otherwise, different ODN templates should be created for each headend.

  • Headend PE-B, color 72, latency - L3VPN_NM-SRTE-ODN_72-b

  • Headend PE-C, color 71, latency - L3VPN_NM-SRTE-ODN_71-c

For example purposes, we will show how to create the first ODN template - L3VPN_NM-SRTE-ODN_72-a. The other ODN templates can be created using the same procedure.

Before you begin

In this step, we will create an ODN template on each endpoint. The ODN template specifies the color and the intent; in this case, latency and disjointness. This ODN template will be used to dynamically create tunnels (on-demand) when prefixes with matching colors are received via BGP. Traffic to these prefixes will be automatically steered into the newly created tunnels, thereby meeting the SLA objective and constraints intended for these prefixes and signaled using colors in the BGP routes.

Disjointness constraints work by associating a disjoint group ID with the ODN template. Tunnels with the same disjoint group ID will be disjoint, i.e., they will use different links, nodes, and shared risk link groups depending on how the disjoint groups are configured.

Procedure


Step 1

From the main menu, choose Services & Traffic Engineering > Provisioning (NSO) > SR-TE > ODN-Template.

Step 2

Click to create a new template and give it a unique name.

In this case, the name is L3VPN_NM-SRTE-ODN_72-a. Click Continue.

Figure 24. SR-TE ODN-Template
SR-TE ODN-Template

Step 3

Choose the headend device, PE-A, and specify the color 72.

Figure 25. ODN-Template Head-end Routers
ODN-Template Head-end Routers

Step 4

Under srv6, select the Enable srv6 toggle.

Step 5

Under locator, enter the required SRv6 locator-name.

The locator name should match what is configured on the router.

Figure 26. ODN-Template SRv6 options
ODN-Template SRv6 options

Step 6

Under dynamic, select latency as the metric type. This is the SLA objective on which we are optimizing.

Step 7

Select the pce check box to specify that the path should be computed by the SR-PCE, not by the Path Computation Client (PCC).

Step 8

Define the required constraints. In this case, we want the computed paths to be disjoint in that they must not share a link.

Under disjoint-path, choose link as the type, and specify a numeric group ID, in this case, 16.

Figure 27. ODN-Template Dynamic Path Computation
ODN-Template Dynamic Path Computation

Commit your changes or click Dry Run to check what will be configured on the devices before you commit.

Step 9

Check that the new ODN template appears in the table and its provisioning state is Success. Click in the Actions column and choose Config View to see the Yang model-based service intent data that details the ODN template you created.

Figure 28. ODN Template Actions Menu
ODN Template Actions Menu
Figure 29. Configured Data
Configured Data

Step 10

Create the other ODN templates listed above in the same manner.


Step 2 Create an L3VPN route policy

In this step, we will create a route policy for each endpoint, and we will specify the same color as defined in the ODN template for that endpoint. The route policy defines the prefixes to which the SLA applies. When traffic from the specified network with a matching color is received, paths are computed based on the SLA defined in the ODN template. We will create the following route policies:

  • Color 70, IPv6 prefix 70:70:70::0/64 - L3VPN_NM-SRTE-RP-PE-A-7

  • Color 71, IPv6 prefix 70:70:71::0/64 - L3VPN_NM-SRTE-RP-PE-B-7

  • Color 72, IPv6 prefix 70:70:72::0/64 - L3VPN_NM-SRTE-RP-PE-C-7

For example purposes, we will show how to create the first route policy - L3VPN_NM-SRTE-RP-PE-A-7. The other route policies can be created using the same procedure.

First, we will create the routing policy tag and routing policy destination prefix. The routing policy prefixes should match with the subnet prefix configured on the PE devices in the service.

Procedure


Step 1

From the main menu, choose Services & Traffic Engineering > Provisioning (NSO) > L3VPN > Routing Policy Tag.

Step 2

Click to create a new routing policy tag and type the name of the tag set: COLOR_70. Click Continue.

This is used as a label to reference the set in actions and conditions.

Step 3

Under tag-value, click and type the Tag-value: 70.

The tag value may be a number between 1 – 4294967295 and should match to a color value.

Figure 30. Routing policy tag
Routing Policy Tag

Step 4

Click Continue. The new routing policy tag name with the new tag value is visible. Click Commit changes.

Create the other two routing policy tags (COLOR_71 and COLOR_72) and tag values (71 and 72) by following the same steps above.

Now, create the routing policy destination prefixes.

Step 5

From the main menu, choose Services & Traffic Engineering > Provisioning (NSO) > L3VPN > Routing Policy Destination Prefix.

Step 6

Click to create a new routing policy destination prefix and type the name DEST_PREFIX_SET_70.

The name of the prefix set will reference the set in match conditions.

Step 7

For Mode, select ipv6.

Step 8

Expand prefixes and click + to add the ip-prefix to the prefix-list.

Step 9

For Ip-prefix, type 70:70:70::0/64 and click Continue.

Create the other two routing policy destination prefixes (DEST_PREFIX_SET_71 and DEST_PREFIX_SET_72) by following the same steps. Click Commit changes.

Now, we are ready to create the first route policy, L3VPN_NM-SRTE-RP-PE-A-7. The other route policies can be created using the same procedure.

Figure 31. Routing policy destination prefix
Routing Policy Destination Prefix

Step 10

From the main menu, choose Services & Traffic Engineering > Provisioning (NSO) > L3VPN > Routing Policy.

Step 11

Click to create a new route policy and type a unique name for the top-level policy definition: L3VPN_NM-SRTE-RP-PE-A-7. Click Continue. The statements section appears.

Note

 
The Route Policy statement defines the condition and actions taken by the system.

Step 12

Expand statements, click to add the name of the policy statement (such as stmt1), and click Continue. The statement{stmt1} panel appears, showing conditions and actions sections.

Step 13

Expand conditions and then expand match-dest-prefix-set before selecting the prefix-set list and select DEST_PREFIX_SET_70. This is what references a defined prefix set.

Note

 
Once selected, the Enable match-dest-prefix-set toggle switches on. This toggle will match a referenced prefix set according to the logic defined in the match-set-options list.

Step 14

Expand actions and then expand bgp-actions.

Step 15

For bgp-actions, slide the Enable bgp-actions toggle to the on position. By toggling bgp-actions on, it defines the top-level container for BGP-specific actions.

Step 16

Now expand set-ext-community. Slide the enable-set-ext-community toggle to the on position. Toggling on set-ext-community sets the extended community attributes.

Step 17

For Method and reference, select the ext-community-set-ref list and select COLOR_70. The Ext-community-set-ref references a defined extended community set by name.

Note

 
Creating routing-policy tag-set is mandatory and needs to be mapped here.

Step 18

Click X in the top-right corner to close the statement{stmnt1} panel and click Commit changes.

Figure 32. Routing policy statement
Routing Policy Statement

Step 19

Create the other route policies (L3VPN_NM-SRTE-RP-PE-B-7 and L3VPN_NM-SRTE-RP-PE-C-7) in the same manner.


After creating the L3VPN route policies, create the VPN profile for each route policy and then create and provision the L3VPN service. The VPN profile will be referenced from the L3VPN service. This will bind the route policy to the L3VPN service.

Step 3 Create and provision the L3VPN service

In this step, we will create the L3VPN service with three endpoints: PE-A, PE-B, and PE-C. Each endpoint will be associated with a vpn-instance-profile, which in turn points to a VPN profile that contains the route policy with the same color as specified in the ODN template. In this way, traffic that matches the specified prefixes and color will be treated according to the SLA specifications.

First, we will create the VPN profiles. The newly created VPN profiles will have the same names as the L3VPN routing policy names.

Procedure


Step 1

From the main menu, choose Services & Traffic Engineering > Provisioning (NSO) > L3VPN > VPN Profiles.

Step 2

Click to create a valid VPN profile to be referenced in the VPN service.

Step 3

Select the Id list and select L3VPN_NM-SRTE-RP-PE-A-7.

Now create and provision the L3VPN service.

Step 4

From the main menu, choose Services & Traffic Engineering > Provisioning (NSO) > L3vpn > L3vpn-Service..

Step 5

Click to create a new service and type a new vpn-id: L3VPN_NM-SRTE-ODN-70.

A VPN identifier uniquely identifies a VPN and has a local meaning (for example, within a service provider network).

Step 6

Click Continue.

Step 7

Create vpn-instance-profiles, which is a container that defines the route distinguisher (RD), route targets, and the export/import route policy. We will create vpn-instance-profiles for each endpoint, as follows:

  • L3VPN_NM_SR_ODN-IE-PE-A-7 with route distinguisher 0:70:70

  • L3VPN_NM_SR_ODN-IE-PE-B-7 with route distinguisher 0:70:71

  • L3VPN_NM_SR_ODN-IE-PE-C-7 with route distinguisher 0:70:72

    1. Expand vpn-instance-profiles and click to create a new vpn-instance-profile profile-id: L3VPN_NM_SR_ODN-I-PE-A-7. Click Continue.

    2. Enter the route distinguisher (Rd) that will differentiate the IP prefixes and make them unique: 0:70:70.

    3. For address-family, click and select ipv6 from the list. Click Continue.

    4. Define the required VPN targets, including route targets and route target types (import/export/both).

    5. Under vpn-policies, in the Export-policy list, choose the relevant VPN profile (which contains the route policy: L3VPN_NM-SRTE-RP-PE-A-7). This forms the association between the VPN and the ODN template that defines the SLA.

    6. Click X in the top-right corner when you are done.

    7. Expand srv6, slide the Enable srv6 toggle to the on position, and then click under address-family.

    8. Select ipv6 from the address family list and click Continue.

    9. For Locator-name, type ALG0r5. The SRv6 locator name should match locators configured at a node-global level on each router. Click X in the top-right corner until you are back on the Create L3VPN screen.

    10. Similarly, create the other vpn-instance-profiles.

Step 8

Define each VPN endpoint individually: PE-A, PE-B, and PE-C.

  1. Expand vpn-nodes and click to select the relevant device from the list: PE-A. Click Continue.

  2. Enter the local autonomous system number for network identification: 200.

  3. Expand active-vpn-instance-profiles and click to select the Profile-id you created in the previously: L3VPN_NM-SRTE-RP-PE-A-7. Click Continue.

  4. Define the network access parameters for communication from the PE to the CE:

    • Under vpn-network-accesses, click to create a new set of VPN access parameters and provide a unique ID. Click Continue.

    • In the Interface-id field, type Loopback70. This is the identifier for the physical or logical interface. The identification of the sub-interface is provided at the connection level and/or the IP connection level.

    • Expand ip-connection > ipv6 and enter a Local-address (70:70:70::1) and the Prefix-length (64).

    • Expand routing-protocols and click before typing a unique identifier for the routing protocol: EBGP. Click Continue.

    • From the routing protocol Type list, select bgp-routing.

    • Expand bgp and for Peer-as, type 70. This information indicates the customer’s ASN when the customer requests BGP routing.

    • From the Address-family list, select ipv6.

    • Under neighbor, click to create a neighbor IP address and type 70:70:70::2. Click Continue.

    • Type the Multihop number 11. This describes the number of IP hops allowed between a given BGP neighbor and the PE.

    • For redistribute-connected, click and select ipv6 from the Address-family list. Click Continue.

    • Click X in the top-right corner until you are back on the Create L3VPN screen.

    • Similarly, create the other VPN nodes: PE-B and PE-C.

Step 9

Commit your changes or click Dry Run to check what will be configured on the devices before you commit.

Step 10

Check that the new L3VPN service appears in the table and its provisioning state is Success.


Step 4 Visualize the new VPN service on the map to see the traffic path

Procedure


Step 1

In the L3VPN Service table, click on the service name or click in the Actions column and choose View Details from the menu.

The map opens, and the service details are shown to the right of the map.

or
  1. From the main menu, choose Services & Traffic Engineering > VPN Services.

    The map opens, and a table of VPN services is displayed to the right of the map.

  2. Click on the VPN in the Services table. If there are many services in the table, you can filter by name, type, or provisioning state to help locate the VPN.

    In the map, you will see the VPN as an overlay on the topology. It shows a representation of the three endpoints and a dashed line that indicates that it is a virtual path.

    Figure 33. VPN service on the topology
    VPN Service on the Topology

    Select the Show Participating Only check box to see only the devices involved in the selected VPN.

    Note

     
    When a Provision State shows a Failed state, an information icon appears. This is true whether you are on the VPN Services, Service Details, and many of the Provisioning screens that show a table of services and their Provisioning status. If you select the icon, Error Message details appear describing the failure. You can also click the Show Error Details link to view the Component Errors screen and take action to fix the error. Each failed source provides further error message details and recommendations. For example, in the Action column for the failed source on the component Errors screen, you may click for different options (such as Check-Sync, Sync-To, Sync-From, Compare-Config, View Job Status) that will assist in fixing the error. Service level actions are also available for additional options (such as Re-Deploy, Reactive-Re-deploy, Re-Deploy Reconcile, Clean-up, etc.) that will assist in fixing the service level error. Use the information icons next to these options for further details on fixing the issue.
    Figure 34. Provisioning status information icon
    Provisioning Status Information Icon
    Figure 35. Error message
    Error Message
    Figure 36. Component errors action menu
    Component Errors Action Menu
    Figure 37. Service level actions
    Service Level Actions

Step 2

In the Actions column, click to drill down to a detailed view of the VPN service, including the device configurations and the computed transport paths.

Figure 38. View details in actions menu
View Details in Actions Menu

Step 3

To see the computed paths for this VPN, click on the Transport tab in the Service Details pane. All the dynamically created SR-TE policies are listed in the Transport tab. Select one or more SR-TE policies to see the path from endpoint to endpoint on the map.

In this example, we are looking at the disjoint paths computed from PE-A to PE-B and from PE-A to PE-C.

Figure 39. Computed disjoint paths
Computed Disjoint Paths

Step 4

To see the physical path between the endpoints, select the Show IGP Path check box in the top-left corner of the map. Hover with your mouse over a selected policy in the table to highlight the path in the map and show prefix SID and routing information.

Figure 40. Physical path details
Physical Path Details

Step 5 Observe automatic network optimization

Procedure


The SR-PCE constantly monitors the network and automatically optimizes the traffic path based on the defined SLA. For illustration purposes, let’s look at what happens when one of the links goes down, in this case, the link between P-BOTTOMLEFT and P-BOTTOMRIGHT. This means the previous path from PE-A to PE-C is no longer viable. Therefore, the SR-PCE computes an alternative path, both from PE-A to PE-C and from PE-A to PE-B, to compensate for the link that is down and maintain the disjoint paths.

Recomputed paths:

Source and Destination Old path New path
PE-A > PE-C PE-A > BOTTOM-LEFT > BOTTOM-RIGHT > PE-C PE-A > TOP-LEFT > BOTTOM-RIGHT > PE-C
PE-A > PE-B PE-A > TOP-LEFT > TOP-RIGHT > PE‑B PE-A > BOTTOM-LEFT > TOP-RIGHT > PE-B
Figure 41. Automatic Network Optimization
Automatic Network Optimization

Summary and Conclusion

As we observed in this example, operators can use Crosswork Network Controller to orchestrate L3VPNs for SRv6 with SLAs and maintain these SLAs using SR-TE policies that continuously track network conditions and automatically react to optimize the network. This automation increases efficiency and reduces human error, which is generally unavoidable with manual tasks.

Scenario: Mandate a static path for an EVPN-VPWS service using an explicit MPLS SR-TE policy

To ensure that mission-critical traffic within a VPN traverses the higher-capacity interfaces rather than the lower-capacity interfaces, we will create a point-to-point EVPN-VPWS service and associate a preferred path (explicit) MPLS SR-TE policy on both endpoints for service instantiation. In this way, we will mandate a static path for the mission-critical traffic.

In this scenario, we will see how quick and easy it is to create SR-TE policies and VPN services by uploading a file containing all the required configurations. We will download sample files (templates) from the provisioning UI, fill in the required data, and then import the file via the UI. Lastly, we will use the Service Health functionality to review the health of the services and view the Assurance Graph and Last 24Hr Metrics to better analyze our service’s health details.


Note


In this scenario, reference to SR-TE specifically means SR-TE over MPLS.


In this scenario, we will:

  • Create an SID list - a list of prefix or adjacency Segment IDs, each representing a device or link along the path.

  • Provision an explicit SR-TE policy, which will reference the SID list, thus creating a predefined path into which the EVPN prefix will be routed.

  • Provision a point-to-point EVPN-VPWS service from PE-A to PE-C and attach the explicit SR-TE policy.

  • Visualize the path of the service and review its health.

Assumptions and prerequisites

  • For transport mapping to L2VPN service, devices must be configured with the l2vpn all command.

  • For Service Health enablement, Service Health must be installed. For instructions, see Crosswork Network Controller Installation Guide chapter, Install Crosswork Applications.

  • (Optional) Service Health provides Internal Storage of monitoring data up to a maximum limit of 50 GB. This data is stored on your system. IIf you exceed the internal storage limit, historical data will be lost. If you extend Service Health storage capacity, you can configure External Storage in the cloud using an Amazon Web Services (AWS) cloud account. By leveraging External Storage, all existing internal storage data will be automatically moved to the external cloud storage (see Configuring Service Health External Storage Settings for more details) and your internal storage will act locally as cache storage. Configuring External Storage for Service Health ensures you will not lose historical data for services that continue to monitor a service’s health and will retain service health data for any service you choose to stop monitoring when you select the option to retain historical monitoring service for the data. For more information on Internal and External Storage and how to retain historical monitoring service data when stopped, see Crosswork Network Controller 7.0 Service Health Guide.

  • Before using Service Health’s Assurance Graph, ensure that topology map nodes have been fully configured and created with a profile associated with the service. If not, Subservice Details metrics will show that no value has yet to be reported.

  • For Service Health, you must configure two buckets on the Y1731 profile associated with the device. If you have fewer than two buckets configured, Service Health cannot report the Y1731 probes/KPIs on the service details page.

Step 1 Prepare for creating a SID list

Before you begin

The SID list consists of a series of prefixes or adjacency SIDs, each representing a node or link along the path. Each segment is an end-to-end path from the source to the destination, and it instructs the routers in the network to follow the specified path instead of the shortest path calculated by the IGP.

To build the SID list, you will need the MPLS labels of the desired traversing path. You can get these labels from the devices themselves, or you can invoke the northbound Cisco Crosswork Optimization Engine API to retrieve this information.

Refer to Cisco Crosswork Network Automation API Documentation on Cisco Devnet for more information about the API.

Procedure


Step 1

Prepare the input required to produce the SID list for the path from endpoint to endpoint. You will need the router ID of each endpoint, as follows:

{
  "input": {
    "head-end": "100.100.100.7",
    "end-point": "100.100.100.5",
    "sr-policy-path": {
      "path-optimization-objective": "igp-metric"
    }
  }
}'

Step 2

Invoke the API on Crosswork Network Controller server by using the input prepared in the previous step. For example:

curl --location --request POST 
'https://10.194.63.198:30603/crosswork/nbi/optima/v1/restconf/operations/cisco-crosswork-
optimization-engine-sr-policy-operations:sr-policy-dryrun' \
--header 'Content-Type: application/yang-data+json' \
--header 'Accept: application/yang-data+json' \
--header 'Authorization: Bearer 
eyJhbGciOiJIUzUxMiJ9.eyJzdWIiOiJhZG1pbiIsImlzRnJvbU5ld0xvZ2luIjoidHJ1ZSIsInBvbGljeV9pZCI6ImFkb
WluIiwiYXV0aGVudGljYXRpb25EYXRlIjoiMjAyMS0wMy0yMlQxNjozODozNy43NDY2MTZaW0dNVF0iLCJzdWNjZXNzZnV
sQXV0aGVudGljYXRpb25IYW5kbGVycyI6IlF1ZXJ5RGF0YWJhc2VBdXRoZW50aWNhdGlvbkhhbmRsZXIiLCJpc3MiOiJod
HRwOlwvXC9sb2NhbGhvc3Q6NTQ4OVwvU1NPIiwibGFzdF9uYW1lIjoic21pdGgiLCJjcmVkZW50aWFsVHlwZSI6IlVzZXJ
uYW1lUGFzc3dvcmRDcmVkZW50aWFsIiwiYXVkIjoiaHR0cHM6XC9cLzEwLjE5NC42My4xOTg6MzA2MDNcL2FwcC1kYXNoY
m9hcmQiLCJhdXRoZW50aWNhdGlvbk1ldGhvZCI6IlF1ZXJ5RGF0YWJhc2VBdXRoZW50aWNhdGlvbkhhbmRsZXIiLCJsb25
nVGVybUF1dGhlbnRpY2F0aW9uUmVxdWVzdFRva2VuVXNlZCI6ImZhbHNlIiwiY2hhbmdlX3B3ZCI6ImZhbHNlIiwiZXhwI
joxNjE2NDU5OTIwLCJpYXQiOjE2MTY0MzExMjAsImZpcnN0X25hbWUiOiJqb2huIiwianRpIjoiU1QtODQtOFVlWXMybEt
3R2d1Z3RIYjl4MzVmTFlNTGVVRlp6OURyNGpoeFcxakhsV01VYXdXSWgxbUdTd01aRC1tOEk1S2Z0amI2ZmlWTUhlYnBYY
jBMMFZqRFc2WVppUFVUbHRpNFVpZnNUeG9aQ284WWpPWEc2VlFjS0Mwb29lWjJhc3BWanMzYnA3bHo5VkhySlBCTzl5TDN
GcFRIWXRPeWJtVi1jYXMtMSJ9.Vi4k0w8KsOv5M_O8zBqWochT3k9V9Pn2NjSn5ES9c5Pf-
4ds0o4kk6xuZx5_cggauiEICuUMnzmRzneST-oAuA' \
--data-raw '{
  "input": {
    "head-end": "100.100.100.5",
    "end-point": "100.100.100.7",
    "sr-policy-path": {
      "path-optimization-objective": "igp-metric" 
    }
  }
}'

Step 3

Note the SID list ID in the API response. You will use this when creating the SID list in the next step. For example:

{
  "cisco-crosswork-optimization-engine-sr-policy-operations:output": {
    "segment-list-hops": [
      {
        "step": 0,
        "sid": 23002,
        "ip-address": "100.100.100.7",
        "type": "node-ipv4"
      }
    ],
    "igp-route": [
      {
        "node": "PE-A",
        "interface": "GigabitEthernet0/0/0/0"
      },
      {
        "node": "P-TOPLEFT",
        "interface": "GigabitEthernet0/0/0/2"
      },
      {
        "node": "P-BOTTOMRIGHT",
        "interface": "GigabitEthernet0/0/0/3"
      }
    ],
    "state": "success",
    "message": ""
  }
}

Step 2 Create the SID list in the provisioning UI

In this scenario, we will create a SID list for traffic from PE-C to PE-A and another SID list for traffic in the opposite direction.

Procedure


Step 1

From the main menu, choose Services & Traffic Engineering > Provisioning (NSO) > SR-TE > SID-List.

Step 2

Click to create a new SID list and give it a unique name. For this example, the SID list name is L2VPN_NM-P2P-SRTE-PE-C-240. Click Continue.

Step 3

Under Sid, click to create a new SID index and give it a numeric value. Click Continue.

Step 4

Under mpls, enter the SID ID that was received in the API response in Step 1.

Figure 42. SID-List
SID-List

Step 5

Click X in the top-right corner to return to the SID list. Your new SID appears in the index table.

Step 6

Repeat these steps to create additional SID indexes, as required.

Step 7

Commit your changes.

Step 8

Check that the new SID list appears in the table.

Step 9

Create another SID list for the traffic from PE-A to PE-C. For this example, the SID list name is L2VPN_NM-P2P-SRTE-PE-A-240.


Step 3 Create an explicit SR-TE policy for each VPN endpoint by importing a file

In this step, we will provision two explicit SR-TE policies which will reference the SID lists created in Step 1.

The first SR-TE policy specifies PE-C as the headend and provides the IP address of PE-A as the tail end. The second SR-TE policy specifies PE-A as the headend and provides the IP address of PE-C as the tail end.

Instead of manually filling in each field in the provisioning UI, we will import an xml file containing all the configurations required to create the SR-TE policy.

Procedure


Step 1

From the main menu, choose Services & Traffic Engineering > Provisioning (NSO) > SR-TE > Policy.

Step 2

Click to import.

Step 3

Download the sample .json or .xml file, which will serve as a template for the required configuration. In the Import Service dialog, click the Download sample .json and .xml files (.zip) link.

Figure 43. SR-TE Policy Import Service
SR-TE Policy Import Service

Step 4

Unzip the downloaded file and open sr-Policy.xml in an XML editor.

Step 5

Edit the xml file as required. Provide a name for the SR-TE policy, and specify the SID list to be associated with this policy. Save the xml file.

Figure 44. sr-Policy.xml
sr-Policy.xml

Step 6

In the Import Service dialog, select Policy as the type of file to import, browse to the edited xml file, and click . If there are any errors in the file, you will receive a notification. If there are no errors, the file will be imported, and the policy and the devices will be configured accordingly.

Step 7

Check whether the new SR-TE policy appears in the Policy table and whether its Provisioning State is Success.

Step 8

Click in the Actions column and choose Config View to see the Yang model-based service intent data that details the SR-TE policy you created. You can also check the devices themselves to ensure they were provisioned correctly.


Step 4 Create and provision the L2VPN service

In this step, we will create and provision a P2P VPN service with PE-A and PE-C as the endpoints. The VPN service will reference the SR-TE policies we created in the previous step to ensure that the traffic traversing the VPN will follow the path defined in the SID lists.

As we did with the SR-TE policy, we will create the VPN service by importing an xml file containing all the required configurations. Once we have provisioned the VPN service, we will edit it in the provisioning UI to associate the SR-TE policies.

Procedure


Step 1

From the main menu, choose Services & Traffic Engineering > Provisioning (NSO) > L2vpn > L2vpn-Service.

Step 2

Click to import.

Step 3

If you did not download the sample .json or .xml files in Step 3, do so now.

Step 4

Open l2vpn-service.xml in an XML editor.

Step 5

Edit the xml file as required. Provide a name for the L2VPN, configure each endpoint, and define the VPN parameters.

This is the configuration for PE-A in our example:

Figure 45. l2vpn-service.xml
l2vpn-service.xml

Step 6

Save the xml file.

Step 7

In the Import Service dialog, select l2vpn service as the type of file to import, browse to the edited xml file, and click . If there are any errors in the file, you will receive a notification. If there are no errors, the file will be imported, and the policy and the devices will be configured accordingly.

Step 8

Check that the new L2VPN service appears in the L2VPN Service table and its Provisioning State is Success.

Step 9

Click in the Actions column and choose Config View to see the Yang model-based service intent data that details the VPN service you created. You can also check the devices themselves to ensure that they were provisioned correctly.


Step 5 Attach the SR-TE policies to the L2VPN service

At this stage, the provisioned L2VPN service you created does not have associated SR-TE policies that define the transport path. In this step, we will edit the L2VPN service in the provisioning GUI, attach the relevant SR-TE policies to each endpoint, and re-provision it.

Procedure


Step 1

Locate the L2VPN in the VPN Service table.

Step 2

Click in the Actions column and choose Edit.

Step 3

Under vpn-nodes, select PE-A and click the Edit button above the table.

Step 4

In the pane that opens on the right, open the te-service-mapping > te-mapping section.

Step 5

In the sr-policy tab, you can find the list of configured SR policies in the policy-type drop-down list. Choose the policy created for PE-A: L2VPN_NM-P2P-SRTE-PE-A-240 from the list or enter the name of the SR-TE policy in the policy field.

Step 6

Click X in the top-right corner to close the PE-A pane.

Step 7

Repeat the above steps for PE-C and attach the SR-TE policy: L2VPN_NM-P2P-SRTE-PE-C-240.

Step 8

Click Commit Changes.


Step 6 Enable Service Health monitoring

After creating and provisioning the required L2VPN services, you can begin monitoring their health.

Before you begin

  • Ensure that Crosswork Service Health is installed. For details, see the Install Crosswork Applications chapter in Crosswork Network Controller 7.0 Installation Guide.

  • Ensure that the required L2VPN services are created and provisioned.

To enable service health monitoring, do the following:

Procedure


Step 1

From the main menu, choose Services & Traffic Engineering > VPN Services. The map opens on the left side of the page, and the table opens on the right side.

Step 2

In the Actions column, click for the service you want to start monitoring for health.

Step 3

Click Start Monitoring.

Figure 46. Start Monitoring

Start Monitoring

Note


The Health column color coding indicates the health of the service:

  • Blue = Initiated

  • Green = Good

  • Orange = Degraded

  • Red = Down

  • Gray = Not Monitoring

Step 4

In the Monitor Service dialog box, select the Monitoring Level. For help choosing the appropriate monitoring level for your needs, see Crosswork Network Controller 7.0 Service Health Guide reference chapter, Basic Monitoring and Advanced Monitoring Rules.

Figure 47. Basic and Advanced Monitoring Rules

Basic and Advanced Monitoring Rules

Once you have started monitoring the health of this service, select the Actions column and click to view additional Service Health options. You will see Stop Monitoring, Pause Monitoring, Edit Monitoring Settings, and Assurance Graph options.

Note


If you select Edit Monitoring Settings, you may update the Monitoring Level setting, from Basic Monitoring to Advanced Monitoring, or from Advanced Monitoring to Basic Monitoring at any time.

Note


If you later decide to Stop Monitoring a service that has already been started, you have the option to retain the historical service data for that stopped service. See Crosswork Network Controller 7.0 Service Health Guide, Stop Service Health Monitoring section for more details.

Step 5

Click Start Monitoring.

Note


Once you have started monitoring the health of this service, select the Actions column and click to view additional Service Health options. You will see Stop Monitoring, Pause Monitoring, Edit Monitoring Settings, and Assurance Graph options.

Figure 48. Service Health Actions Options

Service Health Actions Options

Step 6

Repeat these steps for each service for which you wish to start health monitoring.

Step 7

Click X in the top-right corner when you are done.


Step 7 Visualize the L2VPN on the map

In this step, we will examine the representation of the L2VPN on the map and see the paths the traffic will take from PE-A to PE-C and vice versa based on the explicit SR-TE policies we created.

Procedure


Step 1

In the L2VPN Service table, in the Actions column for the new VPN, click and choose ViewDetails from the menu. The map opens, and the service details are shown to the right of the map.

or

From the main menu, choose Services & Traffic Engineering > VPN Services.

The map opens, and a table of VPN services is displayed to the right of the map.

  1. Click on the VPN in the Services table. If there are many services in the table, you can filter by name, type, or provisioning state to help locate the VPN.

  2. In the map, you will see the VPN as an overlay on the topology. It shows a representation of the endpoints and a solid line that indicates that it is a virtual path.

  3. Select the Show Participating Only check box if you do not want to see the devices that are not involved in the selected VPN.

    Figure 49. Visualize the L2VPN on the map
    Visualize the L2VPN on the Map

Step 2

Under the Actions column, click and choose View Details to drill down to a detailed view of the VPN service, including the device configurations, the computed transport paths, and the health status for transport paths.

Step 3

In the Transport tab, select one or more SR-TE policies to see the path from endpoint to endpoint on the map. The image below shows the path from PE-C to PE-A. The Show IGP Path check box in the top left corner of the map is selected so the physical path is shown. The dashed line indicates that this link is being used to transport multiple services.

Figure 50. SR-TE policies physical path
SR-TE Policies Physical Path

Step 8 Inspect a degraded service using Service Health and last 24Hr metrics to identify issues

In this step, you can utilize the Last 24Hr Metrics to identify the issues with the degraded services within a specific time range. By narrowing down the issues within a particular time frame, you can focus on the details that may have caused the degraded (or down) service. This will help in troubleshooting the service or the node to address specific symptoms in detail.

Procedure


Step 1

Return to the VPN Services list.

Step 2

In the Actions column, click for the degraded service and click Assurance Graph. The topology map of services and subservices appear with the Service Details panel showing Service Key, Status, Monitoring Status, Monitoring Settings, Sub Services, and Active Symptoms details.

Note

 
This may take up to 5-10 minutes to update after a service has been enabled for monitoring.
Figure 51. Assurance graph

Assurance Graph

Step 3

At the top of the page, click the Show History mode toggle. The historical Date Range graph appears. This graph shows different ranges of historical health service monitoring details from one day (1d) to sixty days (60d). When you hover over an event on the Date Range graph, a tooltip with information about that event appears (such as the date and time of the event and several symptoms).


Show History

Step 4

You can review the Root Cause information by clicking a particular event in the graph. The Service Details panel reloads, showing the active symptoms and the root causes associated with the event. You can resize columns using your mouse, or you can select the gear icon to deselect or select columns you want to appear.

Note


Once you enable Show History mode, Root Cause information in the Active Symptoms table will show the blue Last 24Hr Metrics icon. However, data from the device will be initially delayed and may take some time before the Last 24Hr Metrics begin to populate with data. Until then, the value of zero is reported.

Figure 52. Last 24Hr metrics

Last 24Hr Metrics

Step 5

To further isolate the possible issues and to utilize the Last 24Hr Metrics, perform the following steps:

  1. In the Date Range graph, use your mouse to select the range of historical health service monitoring details from one day (1d) to sixty days (60d).

    Note


    At the top-right of the Date Range graph, select the appropriate icons to zoom in or out, scroll through the date ranges horizontally, or refresh the graph to return to the most recent event, for example. You can also use your mouse to draw a rectangle over events to further zoom in on the degraded devices. Consecutive events may appear as a line of white space.

  2. Click on a degraded event in the graph. The Service Details panel reloads, showing any active symptoms and the root causes to be inspected. Expand the table and information as necessary for further details.

    Figure 53. Active symptoms and the root causes

    Active symptoms and the root causes

Step 6

Check the Down & Degraded Only check box at the top-left corner of the map to show only the Subservices that are degraded, along with other dependent but healthy subservices. Inspect the Service Details panel showing the active symptoms and their root cause. Uncheck the Down & Degraded Only check box and check the Soft Dependencies check box in the top-left corner of the map. Soft Dependencies implies that a child subservice’s health has a weak correlation to its parent’s health. As a result, the degraded health of the child will not result in the parent’s health degradation.

Use the + or symbols in the bottom-right corner of the map to zoom in or out on services mapped. Select the ? to view the Link Color Legend that explains all the icons, symbols, badges, and colors and their definitions.

Step 7

Select the degraded subservice in the map to show the subservice details.

Step 8

Click the Symptoms tab to show any root causes for the service health details, and then click the Impacted Services tab to view the impacted services.

Step 9

Click X in the top-right corner to return to the VPN Services list. In the Actions column, click for the degraded service and click Assurance Graph to show the Service Details panel.

Step 10

Again, select the Show History toggle in the top-right corner of the Service Details panel before selecting the blue metrics icon in one of the Root Cause rows. The Symptoms Metrics – Last 24 Hr bar chart appears. This chart provides details of the metric patterns for different session states (such as active, idle, failed) for individual root cause symptoms with Status, Session, Start Time, and Duration information to assist in troubleshooting prevailing issues. Use your mouse to hover over the chart to view the different details.

Continue to troubleshoot a service health issue using Parameterized Jobs

To further troubleshoot a service health issue (such as a degraded device due to improper data fetching), continue with the following steps to determine whether the problem is related to a collection job.

Step 11

From the main menu, choose Administration > Collection Jobs.

The Collection Jobs page appears.

Step 12

Click the Parameterized Jobs tab.

Step 13

Review the Parameterized Jobs list to identify devices with service health degradation issues. By reviewing Parameterized Jobs, you can identify and focus on gNMI, SNMP, and CLI-based jobs by their Context ID (protocol) for further troubleshooting purposes.

Step 14

In the Job Details panel, select the collection job you want to export and download the status of collection jobs for further examination. The information provided is collected in a .csv file when the export is initiated.

Note


When exporting the collection status, you must fill in the information each time an export is executed. In addition, make sure to review the Steps to Decrypt Exported File content available on the Export Collection Status dialog box to ensure you can access and view the exported information.

Step 15

Click Export.

Step 16

To check the status of the exported collection job data, click View Export Status at the top right of the Job Details panel. The Export Status Jobs panel appears, providing the status of the export request.

Step 17

Review the exported .csv file for collection job details and the possible cause of the degraded device.


Summary and conclusion

In this scenario, we observed how simple it is to create explicit SR-TE policies and attach them to an L2VPN service to mandate a static path for mission-critical traffic. We saw how editing and importing a pre-defined template into the system enables quick and easy provisioning of services and SR-TE policies. We were then able to visualize the actual traffic paths on the map. Lastly, we used Service Health to monitor the health of the new service using the Assurance Graph, Last 24hr Metrics, and SubExpressions metrics to view when service may have been up, degraded, or down, and what the root causes were identified.

Scenario: Provision an L2VPN service over an RSVP-TE tunnel with reserved bandwidth

For the continuous stream transmission required for rich data media types, such as video and audio, bandwidth reservation is often required to provide a higher quality of service. Crosswork Network Controller supports creating and managing RSVP-TE tunnels to reserve guaranteed bandwidth for an individual flow. RSVP is a per-flow protocol that requests a bandwidth reservation from every node in the flow path. The endpoints, or other network devices on behalf of the endpoints, send unicast signaling messages to establish the reservation before the flow is allowed. If the total bandwidth reservation exceeds the available bandwidth for a particular LSP segment, the LSP is rerouted through another LSR. If no segments can support the bandwidth reservation, the LSP setup fails, and the RSVP session is not established.

In this scenario, we will:

  • Create RSVP-TE tunnels with reserved bandwidth.

  • Enable Bandwidth on Demand functionality.

  • Provision a VPN service from PE-A to PE-B and attach the RSVP-TE tunnels as underlay configuration.

  • Visualize the traffic path when link utilization is below the bandwidth threshold. This path would change if the bandwidth utilization on the link crossed the specified threshold.

Assumptions and prerequisites

The following are the assumptions and prerequisites for provisioning an L2VPN service over an RSVP-TE Tunnel with reserved bandwidth.

  • For transport mapping to L2VPN service, devices must be configured with the l2vpn all command.

  • For Service Health enablement, Service Health must be installed. For instructions, see Crosswork Network Controller Installation Guide chapter, Install Crosswork Applications.

  • For steps to enable Service Health during this scenario, see Scenario 3, Step 6 Enable Service Health. For additional details on Service Health, see Scenario 1 and Scenario 3.

  • (Optional) Service Health provides Internal Storage of monitoring data up to a maximum limit of 50 GB. This data is stored on your system. If you exceed the internal storage limit, the least recently used historical data will be lost. If you extend Service Health storage capacity, you can configure External Storage in the cloud using an Amazon Web Services (AWS) cloud account. By leveraging External Storage, all existing internal storage data will be automatically moved to the external cloud storage (see Crosswork Network Controller 7.0 Service Health Guide section, Configure Additional External Storage for more details), and your internal storage will act locally as cache storage. Configuring external storage for Service Health ensures you will not lose historical data for services that continue to monitor a service’s health and will retain service health data for any service you choose to stop monitoring when you select the option to retain historical monitoring service for the data. For more information on Internal and External Storage and how to retain historical monitoring service data when stopped, see Crosswork Network Controller 7.0 Service Health Guide section, Stop Service Health Monitoring.

  • (Optional) For initializing a Heuristic Package to monitor the health of the services, see Crosswork Network Controller 7.0 Service Health Guide chapter, Customize Heuristic Packages for detailed steps to be performed before starting monitoring.

Step 1 Create an RSVP-TE tunnel for both directions of the L2VPN

In this step, we will create an RSVP-TE tunnel from PE-A to PE-B and from PE-B to PE-A, and we’ll reserve bandwidth of 1200 on the link.

Procedure


Step 1

From the main menu, choose Services & Traffic Engineering > Provisioning (NSO) > RSVP-TE > Tunnel.

Step 2

Click to create a new RSVP-TE tunnel and give it a unique name. Click Continue.

Step 3

In the identifier field, enter a numeric identifier for the tunnel. You will use this identifier to associate this RSVP-TE tunnel with the L2VPN service. For this example, the identifier is 2220.

Step 4

In the source and destination fields, enter the loopback0 IP address of the source (PE-A) and the destination (PE-B) devices. This is the TE router ID. To find the TE router ID, go to Topology and click on a device in the map or the list of devices. The Device Details pane opens, and the TE router ID is shown in the Routing section.

Figure 54. TE router ID in device details
TE Router ID in Device Details

Step 5

Define the endpoints:

  1. Under head-end, select the headend device from the dropdown list.

  2. Under tail-end, select the tailend device from the dropdown list.

Step 6

Reserve bandwidth on the link. Under te-bandwidth > generic, enter the bandwidth threshold for the link.

Step 7

Define the path of the RSVP-TE tunnel.

You can define an explicit path or have the path locally computed by the participating devices. Alternatively, you can have the SR-PCE compute a path dynamically. For this scenario we will have the path locally computed.

  1. Under Primary-paths, click to create a new path.

  2. Provide a path name in the pane that appears on the right.

  3. Select the path computation method – path-locally-computed.

  4. Specify a numeric preference for the path. The lower the number, the higher the preference.

  5. Define the optimization metric, in this case, igp.

    Figure 55. Create RSVP-TE tunnel page
    Create RSVP-TE Tunnel Page

Step 8

Click Commit Changes.

Step 9

Verify that the RSVP-TE tunnel appears in the list of tunnels and that its Provisioning State is Success.

Step 10

Click on the tunnel name to visualize the tunnel on the map and to see the tunnel details.

Figure 56. RSVP-TE tunnel visualization
RSVP-TE Tunnel Visualization

Step 2 Create the L2VPN service and attach the RSVP tunnel to the service

In this step, we will create a P2P L2VPN service using the provisioning GUI. If you want to create the service by importing a template, refer to the third scenario, Mandate a static path for an EVPN-VPWS service using an explicit SR-TE policy.

Procedure


Step 1

From the main menu, choose Services & Traffic Engineering > Provisioning (NSO) > L2VPN > L2vpn Service.

Step 2

Click to create a new service and give it a unique name. Click Continue.

Step 3

Choose the vpn-type field.

Step 4

Define each VPN endpoint individually – PE-A and PE-B.

  1. Under vpn-nodes, click .

  2. Select the relevant device from the vpn-node-id and ned-id dropdown lists and click Continue.

Step 5

Define the LDP signaling options by creating one or more pseudowires. In this case, specify the TE router ID of the peer device (PE-B), and provide a unique numeric label to identify the pseudowire.

Step 6

Attach the RSVP tunnel to the service:

  1. Under te-service-mapping > te-mapping, click the te-tunnel-list tab.

  2. Click the te-tunnel-id tab.

  3. If you have an RSVP-TE tunnel on the device that was configured externally to Crosswork Network Controller, you can provide that tunnel ID under this tab. Use the toggle button next to the Select existing te-tunnel-id field to choose the RSVP-TE tunnel from a list of configured tunnels or manually enter the tunnel ID.

    Figure 57. TE Service Mapping to RSVP Tunnel
    TE Service Mapping to RSVP Tunnel
  4. If you want to specify the IETF-TE service name from which te-tunnel-id will be extracted, click the ietf-te-service tab and specify the service name. The tunnel ID will be extracted from the tunnel configuration.

Step 7

Define the VPN network access. In this case, we are using dot1q encapsulation and we have specified the physical interface (GigabitEthernet0/0/0/2) and the VLAN ID (2220).

Step 8

Follow the above steps for PE-B as well.

Step 9

Click Commit Changes. Verify that the L2VPN appears in the list of VPN services and that its Provisioning state is Success.


Step 3 Visualize the L2VPN service on the map

In this step, we look at the representation of L2VPN on the map and see the paths the traffic will take from PE-A to PE-B and vice versa, based on the RSVP-TE tunnels we created.

Procedure


Step 1

In the L2VPN Service table, click on the service name. The map opens, and the service details are shown to the right of the map.

or

  1. From the main menu, choose Services & Traffic Engineering > VPN Services.

    The map opens, and a table of VPN services is displayed to the right of the map.

  2. Click on the VPN in the Services table. When there are many services in the table, you can filter by name, type, or provisioning state to help locate the VPN.

    In the map, the VPN is an overlay on the topology. It shows a representation of the three endpoints and a dashed line indicating that it is a virtual path. Use the buttons at the top right of the map to toggle between the logical and geographical maps.

Step 2

To see the hops in the route between PCC7_56 and PCC5_81, click the Transport tab and select one or more of the underlying TE tunnels to see the path from endpoint to endpoint on the map.

Step 3

As the RSVP-TE tunnels are configured with a reserved bandwidth, if the bandwidth utilization across the link exceeds the specified bandwidth, the path would be rerouted.


Summary and conclusion

This scenario illustrated how to create RSVP-TE tunnels with reserved bandwidth and attach them to an L2VPN service to meet the high quality of service requirements for continuous streaming of rich data media. We observed the path on the map. This path would be recomputed if the bandwidth utilization on the link crossed the bandwidth reservation threshold.

Scenario: Provision a soft bandwidth guarantee with optimization constraints

Service providers must be able to provide fast connections with the lowest latency possible to meet the needs of customers’ peak traffic utilization times and to dynamically optimize services based on the customers’ changing priorities throughout the day. For this purpose, the operator might need to reserve bandwidth on specific links to ensure a dedicated path that can handle a set amount of traffic with a specific optimization intent. The Bandwidth on Demand (BWoD) feature within Crosswork Network Controller enables this functionality. Paths with the requested bandwidth are computed when available. If a path that guarantees the requested bandwidth cannot be found, an attempt will be made to find a best effort path.

In this scenario, we will use BWoD to calculate the lowest TE metric path with a specified amount of available bandwidth between two endpoints.

This scenario uses the following topology as a base:

Figure 58. Base topology
Base Topology

The goal is to create a path from F2.cisco.com to F7.cisco.com that can accommodate 250 Mbps of traffic while keeping the utilization at 80%. BWoD will initially try to find a single path to accommodate the requested bandwidth without exceeding the utilization threshold. If a single path cannot be found, BWoD may recommend splitting the path.

In this scenario, we will:

  • Orchestrate a new SR-TE policy with bandwidth and TE constraints.

  • Configure and enable BWoD.

  • Verify the state of the SR-TE policy and view the path on the map.

Step 1 Create a BWoD SR-TE policy with the requested bandwidth and optimization intent

In this step, we will create a BWoD SR-TE policy with requested bandwidth and optimization intent.

Procedure


Step 1

From the main menu, choose Services & Traffic Engineering > Provisioning (NSO) > SR-TE > Policy.

Step 2

Click to create a new SR-TE policy and give it a unique name. Click Continue.

Step 3

Define the endpoints:

  1. Under head-end, click and select the headend device from the dropdown list and click Continue. Click X to close the Headend pane.

  2. Enter the IP address of the tail-end device.

  3. Enter a color to identify the traffic.

Step 4

Define the parameters on which the path will be computed:

  1. Under path, click .

  2. Enter a path preference and click Continue.

  3. In the dynamic-path tab, select te in the metric-type dropdown list as the optimization objective.

  4. Select the pce check box to have the SR-PCE compute the paths for this policy.

    Figure 59. SR-TE policy path parameters
    SR-TE Policy Path Parameters
  5. Click X to close the path pane.

Step 5

In the Bandwidth field enter the requested bandwidth in Kbps. In this case, we are requesting 250 Mbps or 250,000 Kbps.

Figure 60. SR-TE policy parameters
SR-TE Policy Parameters

Step 6

Click Commit changes. The new policy is created and appears in the list of SR-TE policies. The provisioning state should be Success.

Figure 61. SR-TE policy
SR-TE Policy

Step 7

Verify the new policy by viewing its details and its representation on the map:

  1. Click in the Actions column and choose View.

  2. The map opens with the SR-TE policy details displayed to the right of the map.

    Note

     
    The policy's operational state is down because the SR-PCE alone cannot address bandwidth computations before the BWoD functionality within Crosswork Network Controller is enabled.

Step 2 Enable and configure BWoD

In this step, we will enable and configure BWoD.

Procedure


Step 1

From the main menu, choose Services & Traffic Engineering > Bandwidth on Demand.

Step 2

Toggle the Enable switch to True, and enter 80 to set the utilization threshold percentage. To find descriptions of other options, hover the mouse over.

Step 3

Click Commit changes.

Figure 62. Bandwidth on demand
Bandwidth on Demand

Step 3 Verify that the policy’s operational state is now up and view the path on the map

In this step, we verify the policy’s operational state is Up and inspect the path on the map for verification.

Procedure


Step 1

From the main menu, choose Services & Traffic Engineering > Provisioning (NSO).

Step 2

In the Policy table, locate and select the path computed for the endpoints.

Step 3

The path is shown as an overlay on the map. Select the IGP Path check box to see the physical path between the endpoints.

Figure 63. Computed path on the map
Computed Path on the Map

Summary and conclusion

Operators can set and maintain bandwidth requirements based on optimization intent using the BWoD functionality provided in Crosswork Network Controller. This scenario illustrated how to provision an SR-TE policy with a specific bandwidth request. We saw how to enable BWoD functionality to reroute traffic automatically to maintain bandwidth requirements. This automation alleviates manually tracking and configuring paths to accommodate bandwidth requirements set by SLAs.