Troubleshoot Crosswork Data Gateway
You can troubleshoot a Crosswork Data Gateway instance either directly from the VM or remotely. Crosswork Data Gateway provides logs of errors, requests to the server, and changes made to the VM and reports any process failures/outages.
To access Troubleshooting menu, select 7 Troubleshooting from the Main Menu and click OK, as shown in the following figure:
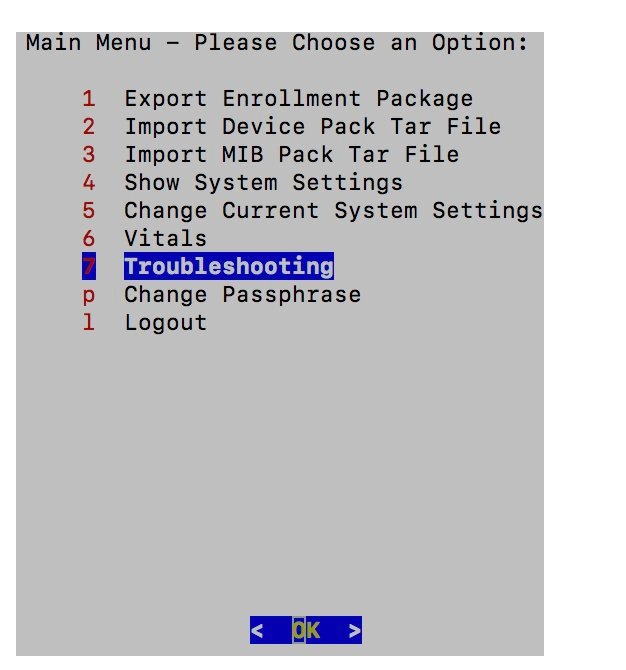
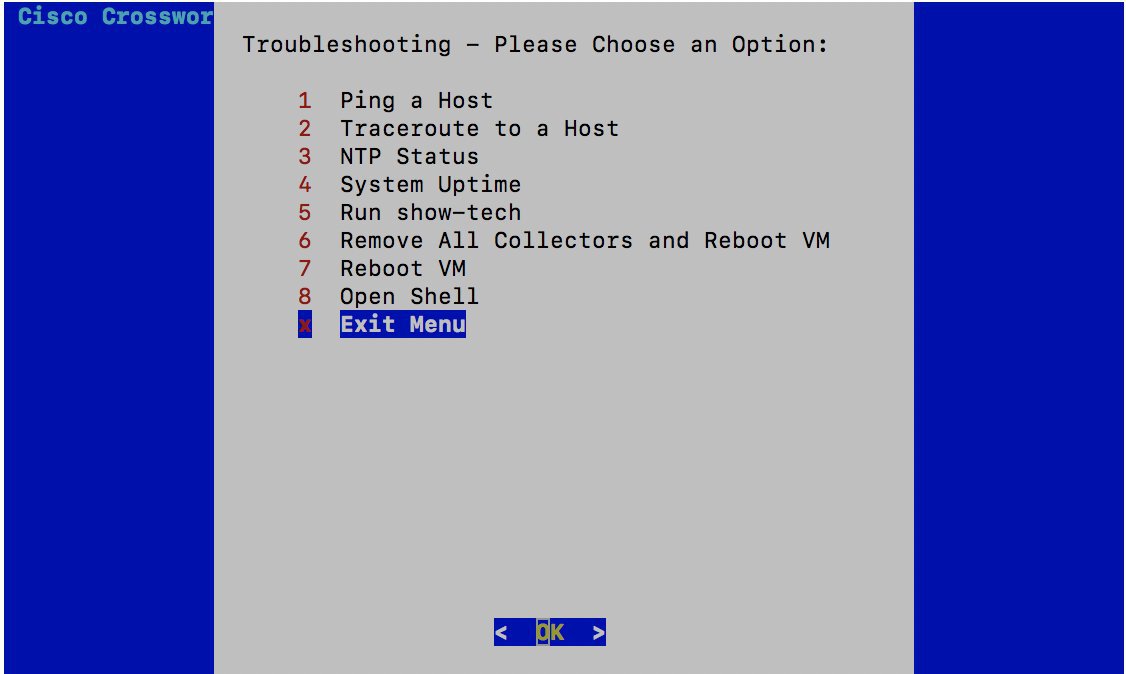
Crosswork Data Gateway opens the Troubleshooting Menu that provides you the following options to troubleshoot your Crosswork Data Gateway instance:
 Note |
The following figure shows the Troubleshooting Menu cprresponding to dg-admin user. Few of these options are not available to dg-oper user. See Table Table 1. |
Ping a Host
To aid troubleshooting, Crosswork Data Gateway provides you Ping utility that can be executed to any IP address to check its reachability.
Procedure
| Step 1 |
From Troubleshooting menu, select 1 Ping a Host. |
| Step 2 |
Click OK. The Crosswork Data Gateway prompts you to enter the ping destination. 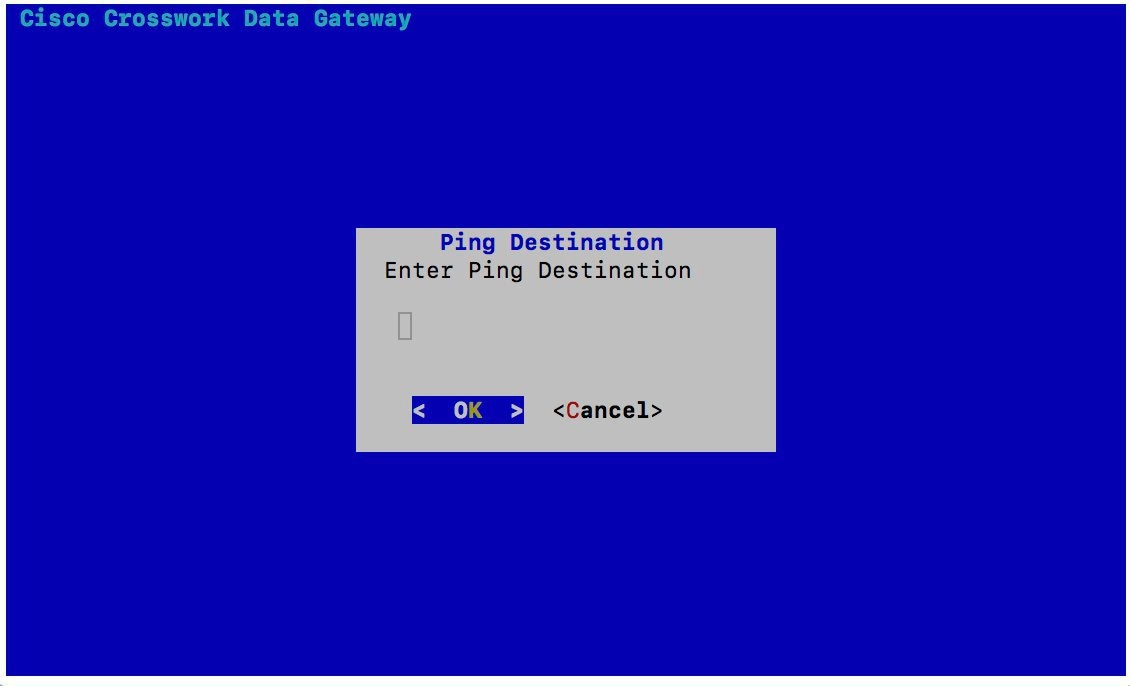 |
| Step 3 |
Enter the ping destination and click OK. Crosswork Data Gateway displays the result of the ping operation. 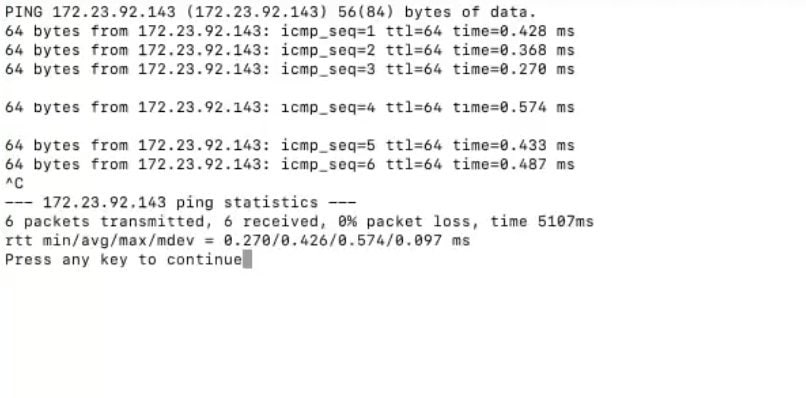 |
Traceroute to a Host
Crosswork Data Gateway provides Traceroute to a Host option to help troubleshoot latency issues. Using this option provides you a rough time estimate for the Crosswork Data Gateway to reach the Controller.
Procedure
| Step 1 |
From Troubleshooting menu, select 2 Traceroute to a Host. Click OK. |
| Step 2 |
Enter the traceroute destination and click OK. 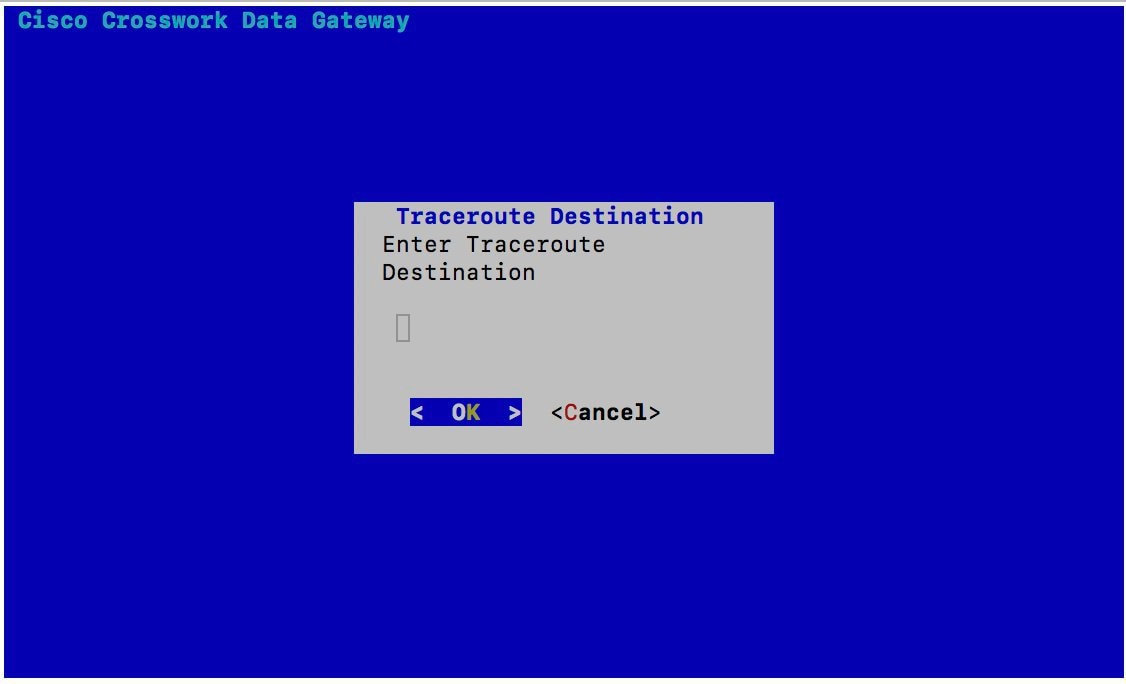 |
| Step 3 |
Enter your SCP passphrase and click OK. 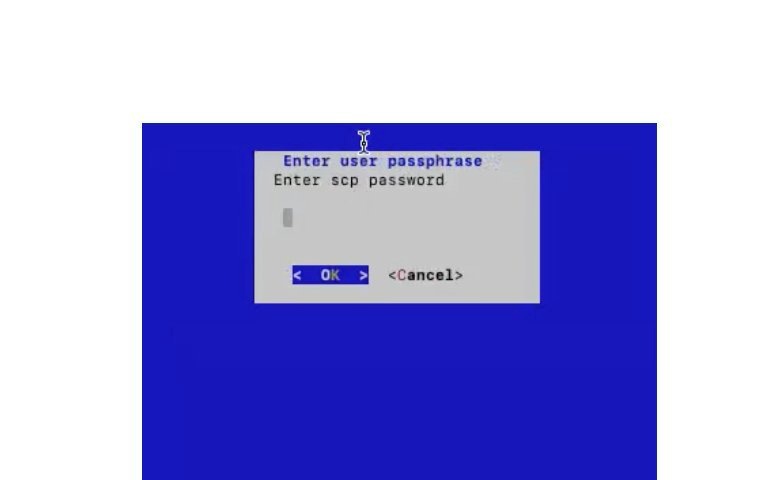 |
Check NTP Status
Use this option to check the status of the NTP server.
Procedure
| Step 1 |
From Troubleshooting menu, select 3 NTP Status. |
| Step 2 |
Click OK. The Crosswork Data Gateway displays the NTP server status. 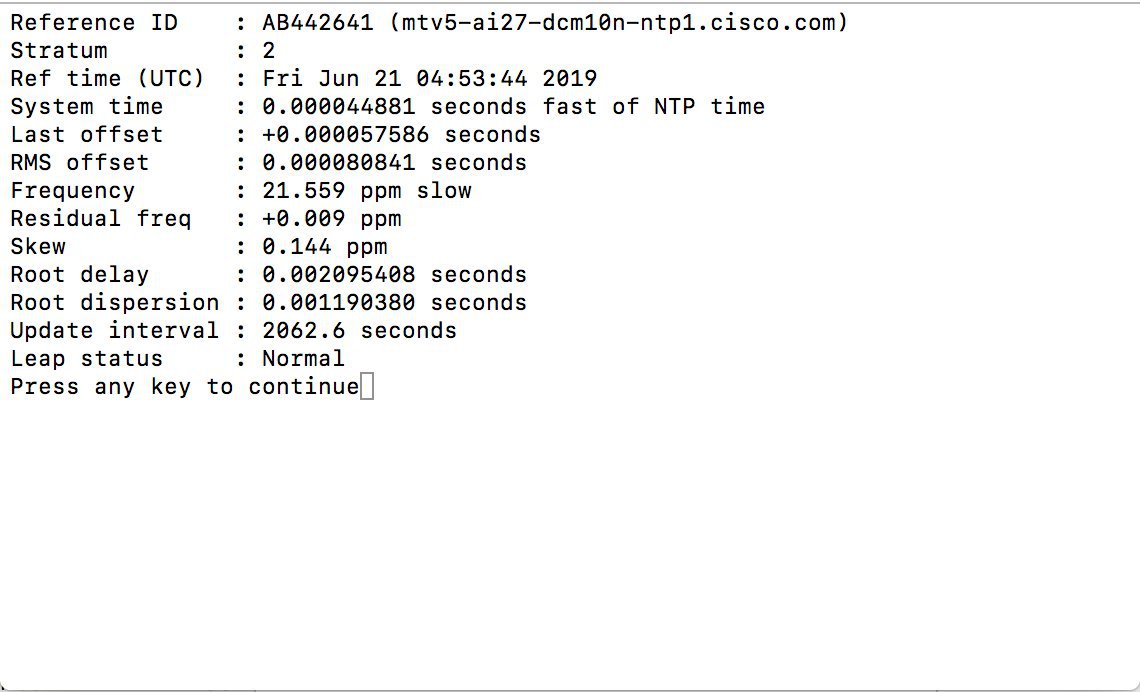 |
Check System Uptime
Use this option to check system uptime.
Procedure
| Step 1 |
From Troubleshooting menu, select 4 System Uptime. |
| Step 2 |
Click OK. The Crosswork Data Gateway displays the system uptime. 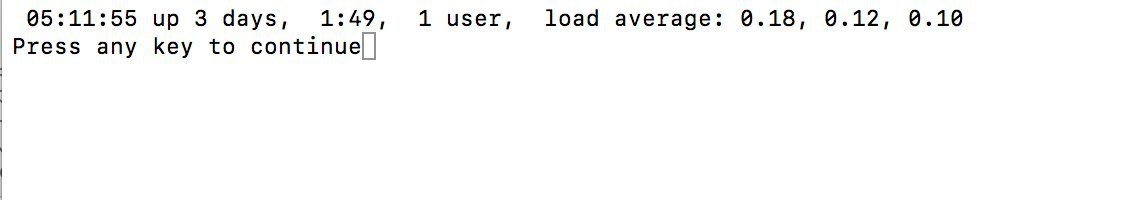 |
Run show-tech
Crosswork Data Gateway provides the option show_tech to gather its state data.
The collected data includes the following:
-
Logs of all the CDG components running on docker containers
-
VM Vitals
It creates a tarball in the directory where it is executed. The output is a tarball named CDG-<CDG-version>-year-month-day--hour-minute-second-*.tar.bz2
The execution of this command may take several minutes depending on the state of Crosswork Data Gateway.
Procedure
| Step 1 |
From Troubleshooting menu, select 5 Show-tech. |
| Step 2 |
Click OK. The Crosswork Data Gateway prompts you to enter the destination for the tarball. 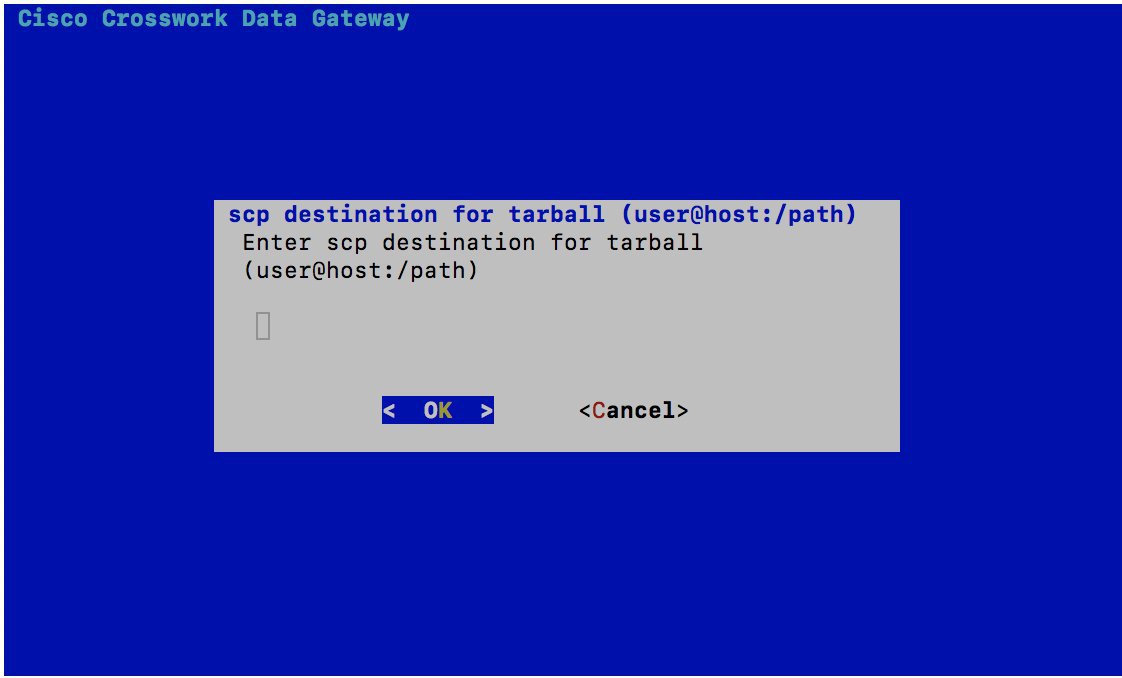 |
| Step 3 |
Enter the destination for the tarball and click OK. Crosswork Data Gateway displays its state data. |
Reboot Crosswork Data Gateway VM
Note |
This task can only be performed by dg-admin user. |
Crosswork Data Gateway gives you two options to reboot the VM:
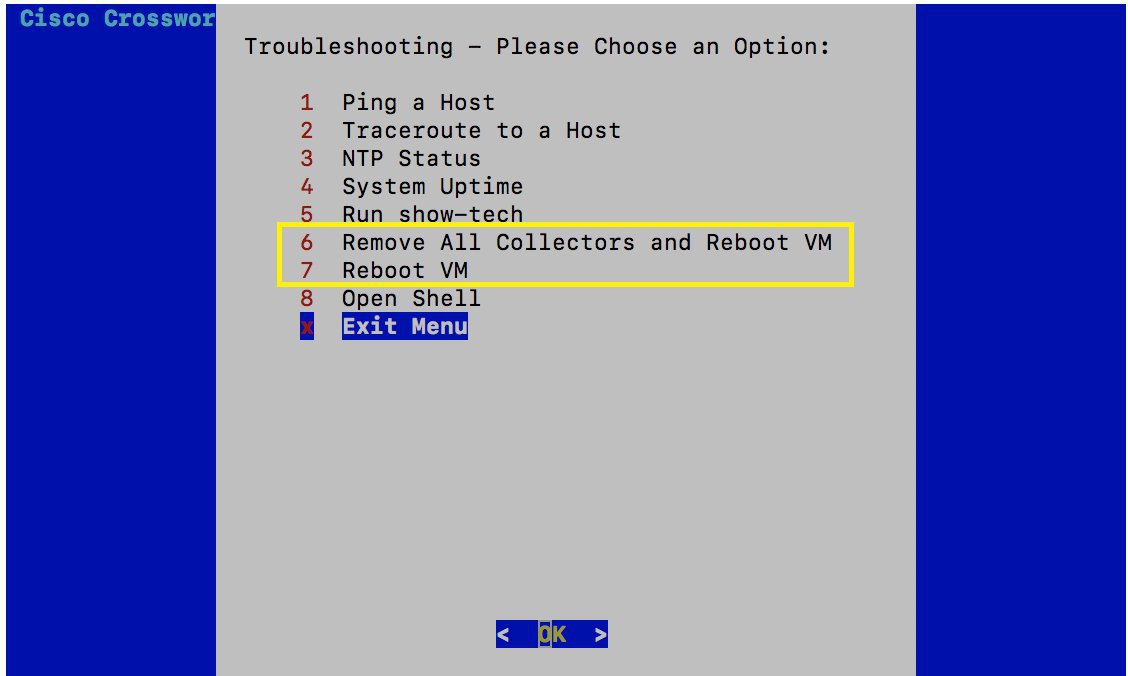
-
Remove All Collectors and Reboot VM: Select this option from the Troubleshooting menu if you want to remove all the collectors (functional images) and reboot VM.
-
Reboot VM: Select this option from the Troubleshooting menu for a normal reboot.
Note |
During the Crosswork Data Gateway VM reboot, all system containers are in the process of being initialized, hence no CDG_CONTAINER_STATE_CHANGE alert regarding startup of the containers is sent to Controller. The CDG_CONTAINTER_STATE_CHANGE alert is sent only when all containers are up and running and a container stops or starts corresponding. Below is an example of CDG_CONTAINER_STATE_CHANGE alert sent to Controller on stop of a container: Below is an example of CDG_CONTAINER_STATE_CHANGE alert sent to Controller on start of a container: The above two alerts are not sent to Controller during reboot. |
 Feedback