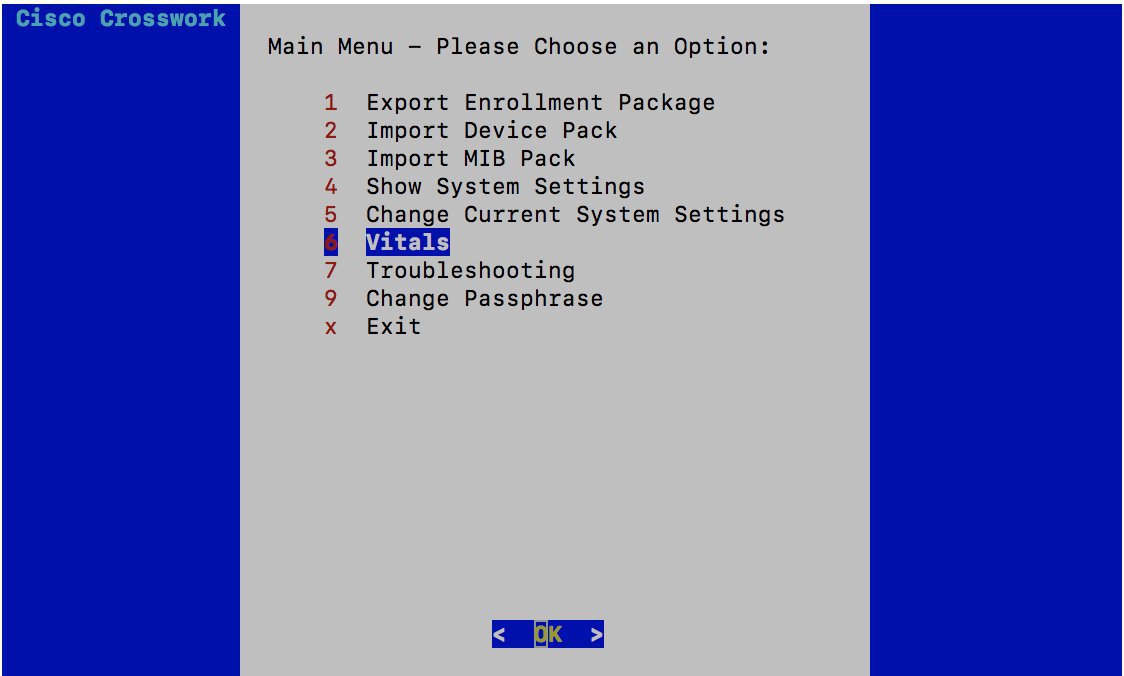
Monitor Crosswork Data Gateway Health

This section contains the following topics:

Vitals Monitor

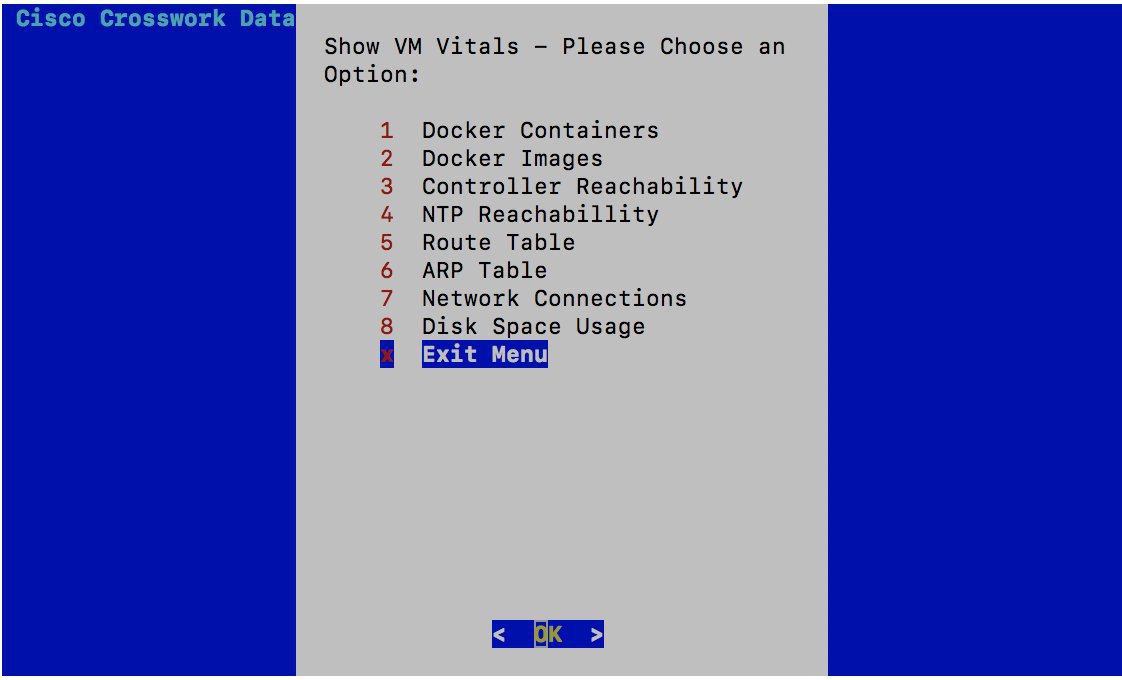
The Vitals Monitor component of Crosswork Data Gateway enables you to view vitals for the following:

  1. Docker containers

  2. Docker images

  3. Controller reachability

  4. NTP reachability

  5. Route table

  6. ARP table

  7. Network connections

  8. Disk space usage

View Crosswork Data Gateway Vitals

Follow these steps to view Crosswork Data Gateway vitals:

Procedure


Step 1

From the Main Menu, select 6 Vitals, as shown in the following figure.


Step 2

Click OK. The Show VM Vitals menu opens.


Step 3

Select the vital you want to view.

Step 4

Click OK. Crosswork Data Gateway displays the vitals for the selected item.

After you are done viewing the vitals, press any key to return to the ShowVM Vitals menu.

To return to the Main Menu, select x Exit Menu and click OK.


View Docker Containers Vitals

Follow this procedure to view the following vitals of the Docker containers:

  • Container ID

  • Image

  • Name

  • Command

  • Created Time

  • Status

  • Port

Procedure


Step 1

From the Show VM Vitals Menu, select 1 Docker Containers.

Step 2

Click OK. Docker Containers vitals are displayed.


View Docker Images Vitals

Follow this procedure to view the following vitals of the Docker images:

  • Repository

  • Image ID

  • Created Time

  • Size

  • Tag

Procedure


Step 1

From the Show VM Vitals Menu, select 2 Docker Images.

Step 2

Click OK. Docker Images vitals are displayed.


View Controller Reachability Vitals

Follow this procedure to view the following Controller reachability vitals:

  • Default gateway

  • Default gateway status

  • Reachability test details (number of packets transmitted and received, packet loss percentage, and time)

  • DNS server

  • DNS server status

  • Reachability test details (number of packets transmitted and received, packet loss percentage, and time)

  • Controller session status

Procedure


Step 1

From the Show VM Vitals Menu, select 3 Controller Reachability.

Step 2

Click OK. Crosswork Data Gateway tests the reachability to the Controller and DNS server and displays the vitals.


View NTP Reachability Vitals

Follow this procedure to view the following NTP reachability vitals:

  • NTP server

  • Resolved IP Address

  • Status

  • Reachability test details (number of packets transmitted and received, packet loss percentage, and time)

  • Chrony status

  • Reference ID

  • System time

Procedure


Step 1

From the Show VM Vitals Menu, select 4 NTP Reachability.

Step 2

Click OK. Crosswork Data Gateway tests the reachability to the NTP server and displays the vitals.


View Route Table

Follow this procedure to view IPv4 and IPv6 route tables.

Procedure


Step 1

From the Show VM Vitals Menu, select 5 Route Table.

Step 2

Click OK. Crosswork Data Gateway displays the route tables.


View ARP Table

Follow this procedure to view ARP tables.

Procedure


Step 1

From the Show VM Vitals Menu, select 6 ARP Table.

Step 2

Click OK. Crosswork Data Gateway displays the ARP tables.


View Network Connections

Follow this procedure to view the following network connections vitals:

  • Netid

  • State

  • Recv-Q

  • Send-Q

  • Local Address and Port

  • Peer Address and Port

Procedure


Step 1

From the Show VM Vitals Menu, select 7 Network Connections.

Step 2

Click OK. Crosswork Data Gateway displays the network connections vitals.


View Disk Space Usage

Follow this procedure to view disk space usage:

  • Filesystem

  • Size

  • Used space

  • Available space

  • Use percentage

  • Mounted on volume

Procedure


Step 1

From the Show VM Vitals Menu, select 8 Disk Space Usage.

Step 2

Click OK. Crosswork Data Gateway displays the disk space usage.


collector-vitals Service

Crosswork Data Gateway comprises of various containerized services running on an Ubuntu VM. Its overall health depends on health of each containerized service.

As part of collector vitals, Crosswork Data Gateway collects host and container metrics and writes them to a container mounted path in vitals.json file and sends it to the Controller.

It collects the following metrics:

Crosswork Data Gateway Host VM/Component

Metric

Drescription

Crosswork Data Gateway Host VM

CPU

CPU consumption - amount of actively used CPU.

Memory

Disk Usage (in GB) - used memory indicates used+buff/cache values.

Load

The average system load calculated over a given period of time of 1, 5 and 15 minutes.

Disk I/O

Disk I/O includes read/write or input/output operations (defined in MB/s) involving a disk.

Network I/O

The amount of data sent/received in MB for NIC interfaces - eth0, eth1, and eth2.

Crosswork Data Gateway Components

Status

Running (Liveness - criteria), Stopped, or Not Deployed

CPU %

CPU consumption - the percentage of the host’s CPU the component container is using.

Memory Usage/Limit

Total memory the container is using and the total amount of memory it is allowed to use.

Memory %

Percentage of the host’s memory the container is using.

Block I/O

Includes read/write or input/output operations (defined in MB/s) involving a disk.

Network I/O

The amount of data the component has sent and received over its network interface (in MegaBytes).


Note

  • When the Docker engine or serviced components listed below are not responsive, Crosswork Data Gateway vitals are not updated:

    • Vitals Monitor

    • Controller Gateway

    The "Collector Vitals" and "Controller Gateway" dockers must be up and running for alerts/vitals to get updated.

  • When Vitals Monitor stops, no alerts are added to cdg-alerts.log. This is because the monitor service runs as a part of Vitals Monitors and it doesn't trigger any alerts when Vitals Monitor itself is down.

  • Also, the alerts are not added to cdg-alerts.log when Vitals Monitor is running and Controller Gateway is down.