Introduction
This document describes one of the most popular tools for wireless debug analysis hosted on cisco.com, Wireless Debug Analyzer.
Background Information
Wireless Debug Analyzer parses debug log files for AireOS and Cat9800 Wireless LAN Controllers. It makes it easier to troubleshoot issues with wireless client association, authentication, roaming, and connectivity issues.
This tool aims to provide logical analysis based on log sequence to match against known issues. For AireOS, the tool can also parse through the output of debug client <mac1> <mac2> ... as well as some portions of the debug aaa/webauth/mdns command. For Catalyst 9800 WLC, the tool can parse through always-on traces and radio-active trace logs generated from WLC. For 9800 RA traces, there is an advanced insights dashboard that is newly added.
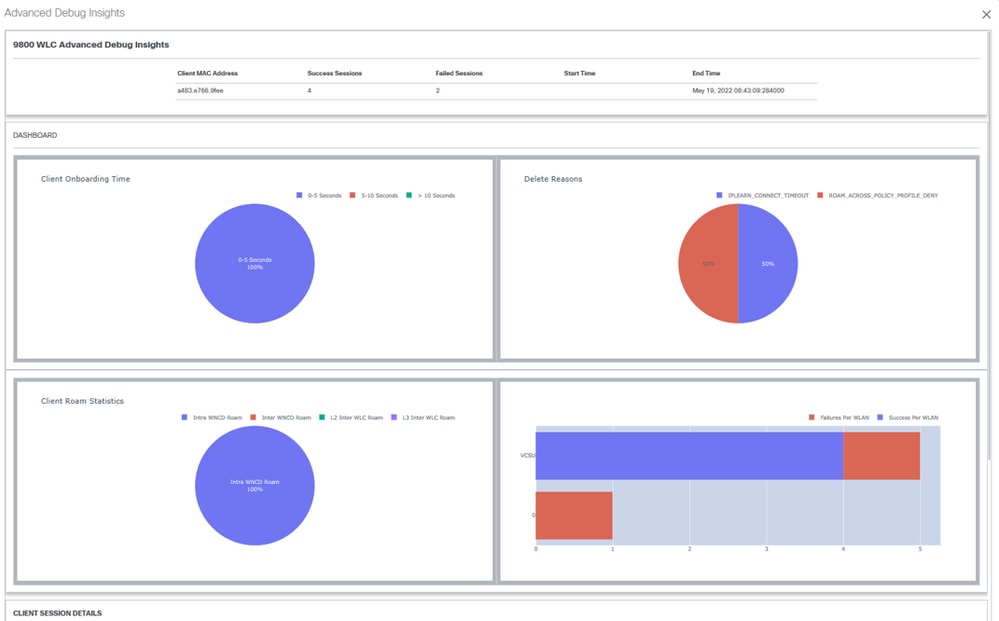
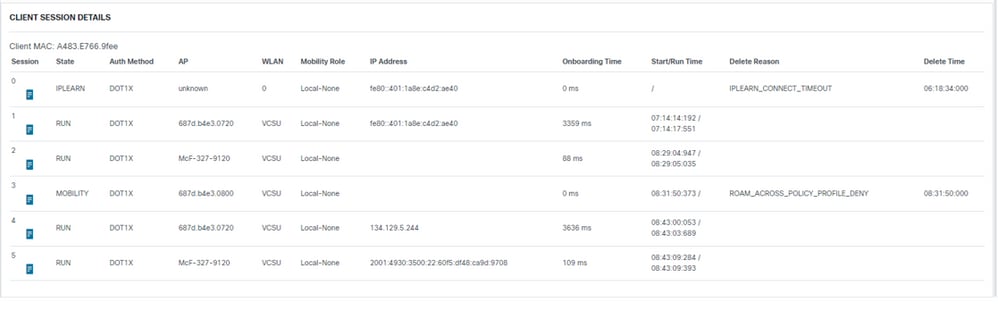
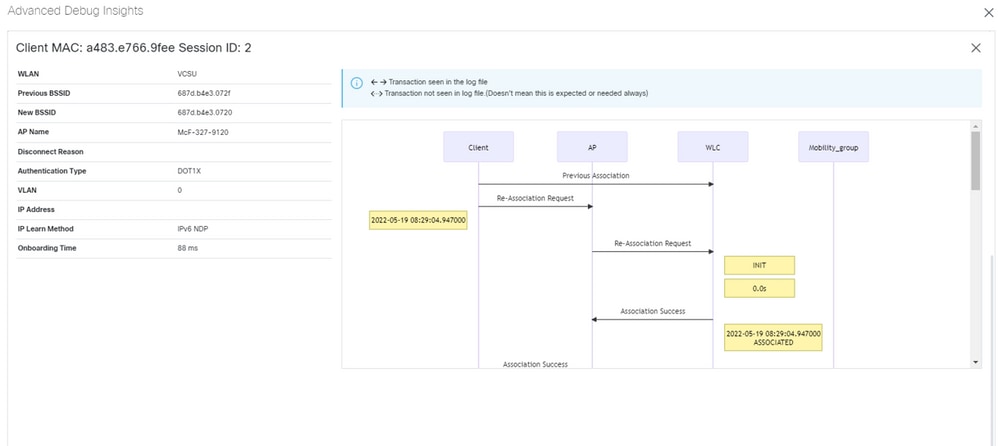
9800 Advanced Debug Insights is a new insight dashboard to analyze RA traces quickly. It provides a quick summary of client roam stats, onboard time, delete reasons, and the number of client sessions per WLAN(Success & Failures). It also provides a high-level table view of all client connection attempts with a start, the end time stamp for each session, delete reason, Auth method, and AP name, and further detailed view can also be seen with all the transactions between clients, AP, WLC in a sequence diagram.
Standard Wireless debugs produce tons of lines of information which takes a long time to collect, analyze and eventually determine the cause.
Approximately 35% of SRs (Volume) is to troubleshoot client issues (drops, disconnects, roam failures). To analyze them manually is time and bandwidth-consuming. Manual analysis is prone to errors. The dashboard gives a holistic & detailed view.
Access
The standalone tool can be accessed at https://cway.cisco.com/wireless-debug-analyzer/
Steps
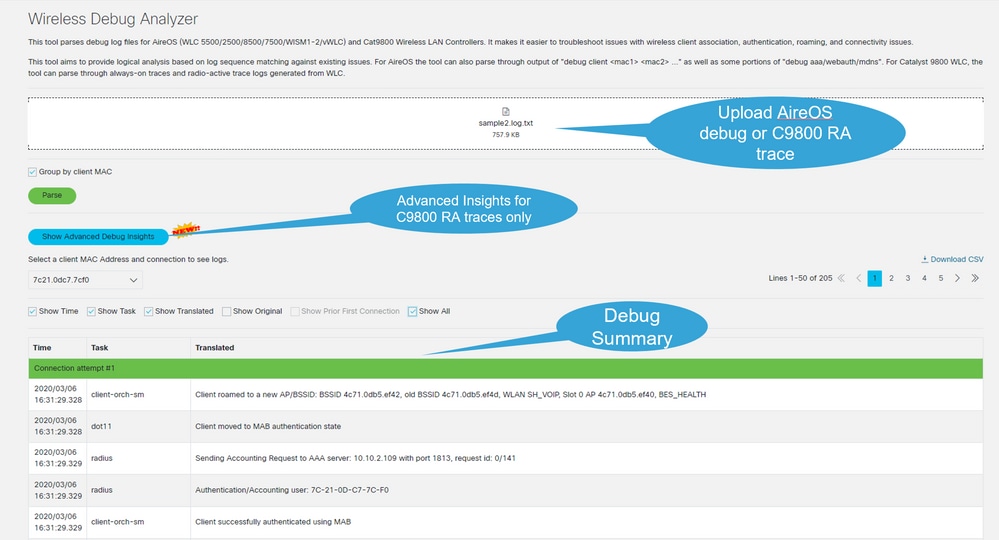
1. Upload the debug file.
2. Click the Parse button (Table View).
3. Click Show Advanced Debug Insights. (Only for C9800 RA Traces).
Dashboards
The tool provides Various dashboard views to help with the analysis.
View
Client Session Details
Scroll to the bottom of the page:
Client Session Detailed - Sequence Diagram
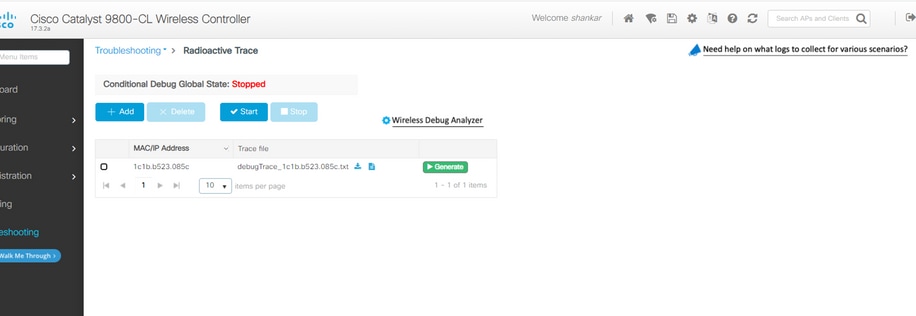
Access Tool from C9800 Web Interface
One could collect RA Trace from C9800 WLC Troubleshoot section and feed it to the Debug Analyzer:
 Feedback