Troubleshoot Wireless LAN Controller CPU Load
Available Languages
Contents
Introduction
This document describes how to monitor CPU usage on Catalyst 9800 Wireless LAN Controllers and it covers several configuration recommendations.
Understanding CPU Usage
Before you delve into CPU load troubleshooting, you must understand the basics of how CPUs are used in Catalyst 9800 Wireless LAN Controllers, and some details on software architecture.
In general, the Catalyst 9800 Best Practices document defines a set of configuration settings that can prevent application-level issues. For example, using location filtering for mDNS or ensuring client exclusion is always enabled. It is advised you apply those recommendations together with the topics exposed here.
Platform Basics
Catalyst 9800 controllers were designed as a flexible platform targeting different network loads, and focusing on horizontal scaling. The internal development naming was eWLC with the "e" for elastic, to signify the same software architecture would run from a small single CPU embedded system to multiple CPU/core large-scale appliances.
Each WLC has two distinct sides:
- Control Plane: Handling all management interactions like CLI, UI, Netconf, and all onboarding processes for clients and APs.
- Data Plane: Responsible for actual packet forwarding and decapsulation of CAPWAP, AVC policy enforcement, among other functionalities.
Control Plane
- Most Cisco IOS® processes run under BinOS (Linux Kernel) with its own specialized scheduler and monitoring commands.
- There is a set of key processes, called Wireless Network Control Daemon (WNCD), each has a local in-memory database, which handles most of the wireless activity. Each CPU owns a WNCD to spread the load across all available CPU cores to each system
- Load distribution across WNCDs is completed during an AP join. When an AP performs a CAPWAP join to the controller, an internal load balancer distributes the AP using a set of possible rules, to ensure proper usage of all available CPU resources.
- Cisco IOS® code runs on its own process called IOSd and has its CPU scheduler. This takes care of specific functionality, for example, CLI, SNMP, multicast and routing.
In a simplified view, the controller has communication mechanisms between the control and data plane, punt, sends traffic from the network to the control plane, injection, and pushes frames from the control plane into the network.
As part of a possible high CPU troubleshooting investigation, you must monitor the punt mechanism to evaluate what traffic is reaching the control plane and can lead to a high load.
Data Plane
For the Catalyst 9800 controller, this is running as part of the Cisco Packet Processor (CPP), which is a software framework to develop packet forwarding engines used across multiple products and technologies.
The architecture allows a common feature set across different hardware or software implementations. For example, it allows similar features for 9800CL vs 9800-40 at different throughput scales.
AP Load Balancing
The WLC performs load balancing across CPUs during the CAPWAP AP join process, with the key differentiator being the AP site tag name. The idea is that each AP represents a specific CPU load added, coming from its client activity and the AP itself. There are several mechanisms to perform this balancing:
- If the AP is using a default-tag, it balances in a round-robin fashion across all CPUs/WNCDs with each new AP join going to the next WNCD. This is the simplest method, however, it has a few implications:
- This is the sub-optimal scenario, as APs in the same RF roaming domain have frequent Inter-WNCD roaming, involving additional inter-process communication. Roaming across instances is slower by a small percentage.
- For the FlexConnect (remote) site tag, no PMK key distribution is available. This means you cannot complete fast roaming for Flex mode, impacting OKC/FT roaming modes.
In general, the default tag can be used on lower load scenarios (for example, less than 40% of AP and client load of the 9800 platform), and for FlexConnect deployment only when fast roaming is not a requirement.
- If the AP has a custom site tag, the first time an AP belongs to the site tag name joins the controller, the site tag is assigned to a specific WNCD instance. All subsequent additional AP joins with the same tag are assigned to the same WNCD. This ensures roaming across APs in the same site tag happens in the one WCND context. This provides a more optimal flow, with lower CPU usage. Roaming across WNCDs is supported, just not as optimal in intra-WNCD roaming.
- Default Load Balancing Decision: When a tag is assigned to a WNCD, the load balancer selects the instance with the lowest site tag count at that time. The total load the site-tag can have is unknown, it can lead to sub-optimal balancing scenarios. This depends on the order the AP joins, how many site-tags have been defined, and if the AP count is asymmetrical across them.
- Static Load Balancing: To prevent unbalanced site tag assignment to WNCD, the site load command was introduced in version 17.9.3 and higher. This allows administrators to predefine the expected load of each site tag. This is useful when handling campus scenarios or multiple branch offices, each mapped to different AP counts to ensure the load is evenly distributed across WNCD.
If you have a 9800-40 handling one main office, plus 5 branch offices with different AP counts, the configuration can look like this:
wireless tag site office-main
 load 120

wireless tag site branch-1
 load 10

wireless tag site branch-2
 load 12

wireless tag site branch-3
 load 45

wireless tag site branch-4
 load 80

wireless tag site branch-5
 load 5
In this scenario, you do not want the main office tag to be on the same WNCD as branch-3 and branch-4. There are 6 site tags in total and the platform has 5 WNCDs and there is a chance the highest loaded site tags land on the same CPU. By running the load command, you can create a predictable AP load balancing topology.
The load command is an expected size. It does not need to match the AP count exactly, however, it is normally set to the expected APs that can join.
- In scenarios where you have large buildings handled by a single controller, it is easier to create as many site tags as WNCDs for that specific platform (for example, C9800-40 has 5, C9800-80 has 8). Assign APs in the same area or roaming domain to the same site tags to minimize inter-WNCD communication.
- RF Load Balancing: This balances APs across WNCD instances, using the RF neighbor relationship from RRM, and creates sub-groups depending on how close the APs are to each other. It must be completed after APs have been up and running for a while and remove the need to configure any static load balance settings. This is available from 17.12 and higher.
How to Find How Many WNCDs are Present
For hardware platforms, the WNCD count is fixed: 9800-40 has 5, 9800-80 has 8. For 9800CL (virtual), the number of WNCDs depends on the virtual machine template used during the initial deployment.
As a general rule, if you want to find determine how many WNCDs are running in the system, you can run this command across all controller types:
9800-40#show processes cpu platform sorted  |  count wncd
Number of lines which match regexp = 5
In the case of 9800-CL, you can run the show platform software system all command to collect details on the virtual platform:
9800cl-1#show platform software system all
Controller Details:
=================
VM Template: small
Throughput Profile: low
AP Scale: 1000
Client Scale: 10000
WNCD instances: 1
Monitoring AP Load Balancing
The AP to WNCD assignment is applied during the AP CAPWAP join process and it is not expected to change during operations, regardless of the balancing method. Unless, there is a network-wide CAPWAP reset event where all APs disconnect and re-join.
Running the CLI show wireless loadbalance tag affinity command can provide an easy way to view the current state of the AP load balance across all WNCD instances:
98001#show wireless loadbalance tag affinity
Tag                               Tag type   No of AP's Joined    Load Config   Wncd Instance
---------------------------------------------------------------------------------------------
Branch-tag                        SITE TAG   10                   0              0
Main-tag                          SITE TAG   200                  0              1
default-site-tag                  SITE TAG   1                    NA             2
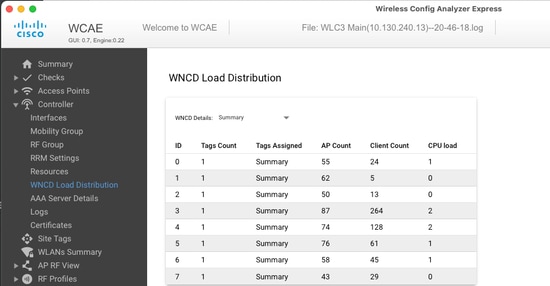
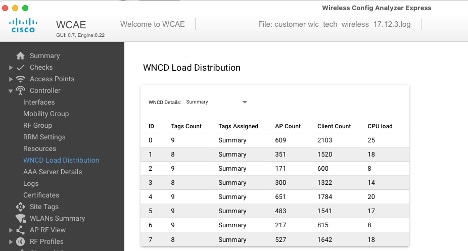
If you want to correlate the AP distribution against client count and CPU load, you can use the WCAE support tool and load a show tech wireless taken during busy times. The tool summarizes the WNCD client count, taken from each AP that is associated with it.
This is an example of a properly balanced controller, during low usage and client count:
Another example is for a more loaded controller, showing normal CPU utilization:
What is the Recommended AP Load-balancing Mechanism
In short, you can summarize the different options in:
- Small networks, no need for fast roaming, less than 40% of controller load: Default tag.
- If fast-roaming is required (OKC, FT, CCKM), or large client count:
- Single building: Create as many site tags as CPUs (platform dependent).
- Before 17.12, or less than 500 AP count: Multiple buildings, branches or large campuses: Create a site-tag per physical RF location and configure load command per site.
- 17.12 and higher with more than 500 APs: use RF load balancing.
This 500 AP threshold, is to mark when it is effective to apply the load balancing mechanism, as it groups APs in blocks of 100 units by default.
AP WNCD Distribution Visualization
There are scenarios where you can apply advanced AP balancing, and it is desirable to have granular control on how APs are spread across CPUs. For example, very high-density scenarios where the key load metric is client count versus focusing on the number of APs present in the system.
A good example of this situation is large events where a building can host thousands of clients over several hundred APs, and you need to split the load across as many CPUs as possible, but optimize roaming at the same time. You do not roam across WNCD unless it is needed. You want to prevent situations where multiple APs in different WNCDs/site tags are intermixed in the same physical location.
To help fine tune and provide a visualization of the distribution, you can use the WCAE tool and take advantage of the AP RF View feature:
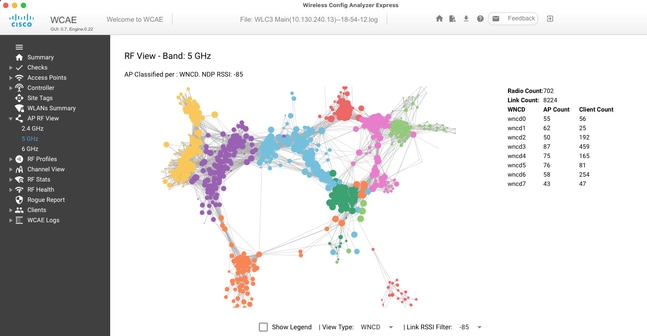
This allows you to view the AP/WNCD distribution, just set the View Type to WNCD. Each color represents a WNCD/CPU and you can set the RSSI filter to -85 to avoid low signal connections. These are also filtered by the RRM algorithm in the controller.
In the previous example, corresponding to Ciscolive EMEA 24, you can see most adjacent APs are clustered across the same WNCD with very limited cross-overlapping. Site tags allocated to the same WNCD receive the same color.
Monitoring Control Plane CPU Usage
It is important to remember the concept of Cisco IOS XE architecture and keep in mind there are two main views of CPU usage. One comes from historical Cisco IOS support, and the main one with a holistic view of the CPU across all processes and cores.
In general, you can run the command show processes cpu platform sorted to collect detailed information for all processes across Cisco IOS XE:
9800cl-1#show processes cpu platform sorted

CPU utilization for five seconds:  8%, one minute: 14%, five minutes: 11%
Core 0: CPU utilization for five seconds:  6%, one minute: 11%, five minutes:  5%
Core 1: CPU utilization for five seconds:  2%, one minute:  8%, five minutes:  5%
Core 2: CPU utilization for five seconds:  4%, one minute: 12%, five minutes: 12%
Core 3: CPU utilization for five seconds: 19%, one minute: 23%, five minutes: 24%
   Pid    PPid    5Sec    1Min    5Min  Status        Size  Name
--------------------------------------------------------------------------------
 19953   19514     44%     44%     44%  S           190880  ucode_pkt_PPE0
 28947    8857      3%     10%      4%  S          1268696  linux_iosd-imag
 19503   19034      3%      3%      3%  S           247332  fman_fp_image
 30839       2      0%      0%      0%  I                0  kworker/0:0
 30330   30319      0%      0%      0%  S             5660  nginx
 30329   30319      0%      1%      0%  S            20136  nginx
 30319   30224      0%      0%      0%  S            12480  nginx
 30263       1      0%      0%      0%  S             4024  rotee
 30224    8413      0%      0%      0%  S             4600  pman
 30106       2      0%      0%      0%  I                0  kworker/u11:0
 30002       2      0%      0%      0%  S                0  SarIosdMond
 29918   29917      0%      0%      0%  S             1648  inet_gethost
There are several key points to highlight:
- The process ucode_pkt_PPE0 handles the data plane on 9800L and 9800CL platforms. It is expected to see a high utilization all the time, even higher than 100%. This is part of implementation and does not constitute a problem.
- It is important to differentiate peak usage versus a sustained load and isolate what is expected in a given scenario. For example, collecting a very large CLI output, like show tech wireless can generate a peak load on IOSd, smand, and pubd processes as a very large text output is being collected with hundreds of CLI commands executed. This is not a problem and the load decreases once the output has been completed.
   Pid    PPid    5Sec    1Min    5Min  Status        Size  Name
--------------------------------------------------------------------------------
 19371   19355     62%     83%     20%  R           128120  smand
 27624   27617     53%     59%     59%  S          1120656  pubd
  4192    4123     11%      5%      4%  S          1485604  linux_iosd-imag
- Peak utilization for WNCD cores are expected during high client activity times. It is possible to see peaks of 80% without any functional impact, and they normally do not cause a problem.
   Pid    PPid    5Sec    1Min    5Min  Status        Size  Name
--------------------------------------------------------------------------------
 21094   21086     25%     25%     25%  S           978116  wncd_0
 21757   21743     21%     20%     20%  R          1146384  wncd_4
 22480   22465     18%     18%     18%  S          1152496  wncd_7
 22015   21998     18%     17%     17%  S           840720  wncd_5
 21209   21201     16%     18%     18%  S           779292  wncd_1
 21528   21520     14%     15%     14%  S           926528  wncd_3
- A sustained high CPU usage on a process higher than 90% for more than 15 minutes,must be investigated.
- You can monitor IOSd CPU utilization by running the show processes cpu sorted command. This corresponds to activity in the linux_iosd-imag process part of the Cisco IOS XE list.
9800cl-1#show processes cpu sorted

CPU utilization for five seconds: 2%/0%; one minute: 3%; five minutes: 3%
 PID Runtime(ms)     Invoked      uSecs   5Sec   1Min   5Min TTY Process
 215          81          88        920  1.51%  0.12%  0.02%   1 SSH Process
 673      164441     7262624         22  0.07%  0.00%  0.00%   0 SBC main process
 137     2264141   225095413         10  0.07%  0.04%  0.05%   0 L2 LISP Punt Pro
 133      534184    21515771         24  0.07%  0.04%  0.04%   0 IOSXE-RP Punt Se
 474     1184139    56733445         20  0.07%  0.03%  0.00%   0 MMA DB TIMER
   5           0           1          0  0.00%  0.00%  0.00%   0 CTS SGACL db cor
   6           0           1          0  0.00%  0.00%  0.00%   0 Retransmission o
   2      198433      726367        273  0.00%  0.00%  0.00%   0 Load Meter
   7           0           1          0  0.00%  0.00%  0.00%   0 IPC ISSU Dispatc
  10     3254791      586076       5553  0.00%  0.11%  0.07%   0 Check heaps
   4          57          15       3800  0.00%  0.00%  0.00%   0 RF Slave Main Th
   8           0           1          0  0.00%  0.00%  0.00%   0 EDDRI_MAIN
- You can use the 9800 GUI for a quick view of IOSd load, per core usage, and data plane load:
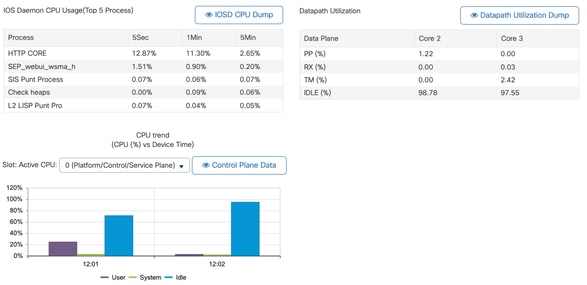
This is available on the Monitoring/System/CPU Utilization tab.
What is Each Process
The process list varies depending on the controller model and the Cisco IOS XE version. This is a list of some key processes and it is not intended to cover all possible entries.
| Process Name |
What Does It Do |
Evaluation |
| wncd_x |
Handles most wireless operations. Depending on the 9800 model, you can have between 1 to 8 instances. |
You can see peaks of high utilization during busy hours. Report if the utilization is stuck for 95% or more for several minutes. |
| linux_iosd-imag |
Cisco IOS Process |
Expect to see high utilization if collecting large CLI output (show tech). Large or too frequent SNMP operations can lead to high CPU. |
| nginx |
Web Server |
This process can show peaks and can only be reported on a sustained high load. |
| ucode_pkt_PPE0 |
Data Plane in 9800CL/9800L |
Run the command show platform hardware chassis active qfp datapath utilization to monitor this component. |
| ezman |
Chipset Manager for Interfaces |
A sustained high CPU can indicate either a HW issue or a possible kernel software problem (it can be reported.) |
| dbm |
Database Manager |
A sustained high CPU here can be reported. |
| odm_X |
Operation Data Manager handles consolidated DB across processes |
High CPU expected on loaded systems. |
| rogued |
Handles Rogue Functionality |
A sustained high CPU here can be reported. |
| smand |
Shell Manager takes care of CLI parsing, and interaction across different processes. |
High CPU expected when handling large CLI output. Sustained high CPU in the absence of load can be reported. |
| emd |
Shell Manager - Handles CLI parsing, and interactions across different processes |
High CPU expected when handling large CLI output. Sustained high CPU on the absence of load can be reported. |
| pubd |
Part of Telemetry handling |
High CPU expected for large telemetry subscriptions. Sustained high CPU on the absence of load can be reported. |
High CPU Protection Mechanisms
Catalyst 9800 Wireless LAN Controllers have extensive protection mechanisms around network or wireless client activity to prevent high CPU due to accidental or intentional scenarios. There are several key features designed to help contain problematic devices:
Client Exclusion
This is enabled by default, and is part of Wireless Protection Policies, and it can be enabled or disabled per Policy Profile. This can detect several different behavior issues, remove the client from the network, and set it into a temporary exclusion list. While the client is on this excluded state, the APs do not talk to them, preventing any further actions.
After the exclusion timer has passed (60 seconds by default), the client is allowed to associate again.
There are several triggers for client exclusion:
- Generating an ARP flood
- Repeated association failures
- 3 or more webauth, PSK, or 802.1x authentication errors
- Repeated authentication timeouts (no response from the client)
- Trying to reuse an IP address, already registered to another client
Client exclusion protects your controller, AP, and AAA infrastructure (Radius) from several high activity types that can lead to high CPU. It is not advisable to disable any exclusion methods unless required for a troubleshooting exercise or compatibility requirement.
The default settings operate for almost all cases and only on some exceptional scenarios are required to increase the exclusion time or disable some specific trigger(s). For example, some legacy or specialized clients (IOT/Medical) must have the association failure trigger to be disabled, due to client-side defects that cannot be easily patched
You can customize the triggers in the UI: Configuration/Wireless Protection/Client Exclusion Policies:
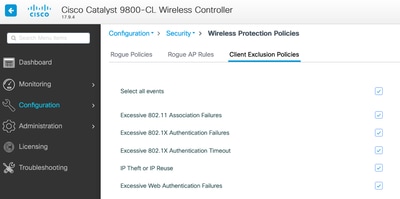
The ARP Exclusion trigger was designed to be permanently enabled at a global level, however, it can be customized on each policy profile. You can check the status by running the sh wireless profile policy all command and look for this specific output:
ARP Activity Limit
  Exclusion                          : ENABLED
  PPS                                : 100
  Burst Interval                     : 5
Control Plane Protection from Data Traffic
This is an advanced mechanism in the Data Plane to ensure traffic sent to the Control Plane does not exceed a predefined set of thresholds. This feature is called Punt Policers and in almost all scenarios, it is not necessary to touch them, and even then, only must be used when working with Cisco Support.
The advantage of this protection is it provides detailed insight into the network, and if there is any specific activity that has an increased rate, or unexpected high packets per second.
This is only exposed through CLI, as they are normally part of advanced functionality that rarely needs modification.
To receive a view of all punt policies:
9800-l#show platform software punt-policer

Per Punt-Cause Policer Configuration and Packet Counters
Punt                                Config Rate(pps)     Conform Packets                   Dropped Packets               Config Burst(pkts)  Config Alert
Cause  Description                   Normal   High     Normal           High             Normal           High             Normal   High     Normal   High
-------------------------------------------------------------------------------------------------------------------------------------------------------------
  2    IPv4 Options                  874      655      0                0                0                0                874      655      Off      Off
  3    Layer2 control and legacy     8738     2185     33               0                0                0                8738     2185     Off      Off
  4    PPP Control                   437      1000     0                0                0                0                437      1000     Off      Off
  5    CLNS IS-IS Control            8738     2185     0                0                0                0                8738     2185     Off      Off
  6    HDLC keepalives               437      1000     0                0                0                0                437      1000     Off      Off
  7    ARP request or response       437      1000     0                330176           0                0                437      1000     Off      Off
  8    Reverse ARP request or repso  437      1000     0                24               0                0                437      1000     Off      Off
  9    Frame-relay LMI Control       437      1000     0                0                0                0                437      1000     Off      Off
 10    Incomplete adjacency          437      1000     0                0                0                0                437      1000     Off      Off
 11    For-us data                   40000    5000     442919246        203771           0                0                40000    5000     Off      Off
 12    Mcast Directly Connected Sou  437      1000     0                0                0                0                437      1000     Off      Off
This can be a large list with more than 160 entries, depending on the software version. On the table output, check the dropped packet column along with any entry that has a non-zero value on the high drop count. To simplify the data collection, you can run the show platform software punt-policer drop-only command to filter for only policer entries with drops.
This feature can be useful to identify if there are ARP storms or 802.11 probe floods (they use queue 802.11 Packets to LFTS and LFTS stands for Linux Forwarding Transport Service.)
Wireless Call Admission Control
In all recent maintenance releases, the controller has an activity monitor to dynamically react to high CPU, and ensure AP CAPWAP tunnels remain active in the face of unsustainable pressure. This feature checks on the WNCD load and starts throttling new client activity to ensure enough resources remain available to handle existing connections and to protect CAPWAP stability. This is enabled by default and it does not have configuration options.
There are three levels of protection defined, L1 at 80% load, L2 at 85% load, and L3 at 89%. Each one triggering different incoming protocol drops as protection mechanisms. The protection is automatically removed as soon as the load decreases.
In a healthy network, you cannot see L2 or L3 load events and if they happen frequently, it can be investigated.
To monitor, run the command wireless stats cac:
9800-l#  show wireless stats cac

WIRESLESS CAC STATISTICS
---------------------------------------------
L1 CPU Threshold: 80         L2 CPU Threshold: 85         L3 CPU Threshold: 89
Total Number of CAC throttle due to IP Learn:  0
Total Number of CAC throttle due to AAA:       0
Total Number of CAC throttle due to Mobility Discovery:  0
Total Number of CAC throttle due to IPC:       0
CPU Throttle Stats
      L1-Assoc-Drop:    0          L2-Assoc-Drop:    0          L3-Assoc-Drop: 0
      L1-Reassoc-Drop:  0          L2-Reassoc-Drop:  0          L3-Reassoc-Drop: 0
      L1-Probe-Drop:    12231      L2-Probe-Drop:    11608      L3-Probe-Drop: 93240
      L1-RFID-Drop:     0          L2-RFID-Drop:     0          L3-RFID-Drop: 0
      L1-MDNS-Drop:     0          L2-MDNS-Drop:     0          L3-MDNS-Drop: 0
mDNS Protections
mDNS as a protocol allows a zero-touch approach to discover services across devices, but at the same time, it can be very active, and drive load significantly if not configured properly.
mDNS, without any filtering, can easily increase WNCD CPU utilization, coming from several factors:
- mDNS policies with unrestricted learning, the controller obtains all services offered by all devices. This can lead to large service lists,with hundreds of entries.
- Policies set without filtering causes the controller to push those large service lists to each client that asks who is providing a given service.
- Some mDNS-specific services are provided by all wireless clients, leading to higher service count and activity with variations of this by OS version.
You can check mDNS list size per service by running this command:
9800-l#  show mdns-sd service statistics
Service Name                                                  Service Count
-----------------------------------------------------------------------------
_ipp._tcp.local                                               84
_ipps._tcp.local                                              52
_raop._tcp.local                                              950
_airplay._tcp.local                                           988
_printer._tcp.local                                           13
_googlerpc._tcp.local                                         12
_googlecast._tcp.local                                        70
_googlezone._tcp.local                                        37
_home-sharing._tcp.local                                      7
_cups._sub._ipp._tcp.local                                    26
This can provide an idea of how large any given query can get. It does not denote a problem by itself, just a way to monitor what is tracked. There are some important mDNS configuration recommendations:
- Set mDNS transport to a single protocol:
9800-1(config)# mdns-sd gateway

9800-1(config-mdns-sd)# transport ipv4
By default, it uses IPv4 transport and for performance, it is advisable to use either IPv6 or IPv4, but not both.
- Always set a location filter in the mDNS service policy, to avoid unbound queries/responses. In general, it is recommended to use site-tag, but other options could work, depending on your needs.
I need more Assistance
If you see high CPU load and none of the previous steps help, contact Customer Experience (CX) through a case and add this data as starting point:
- Base data, as this includes AP/Controller configuration, network, and RF operational values:
show tech-support wireless
- Archive for all controller traces. This is a large file similar to a blackbox concept that can be collected by running this command:
request platform software trace archive last <days> to-file bootflash:<archive file>
Revision History
| Revision | Publish Date | Comments |
|---|---|---|
3.0 |
03-Aug-2026
|
Updated Introduction, spelling, grammar, inserted horizontal lines to separate sections/readability, fixed CCW errors. |
2.0 |
06-Jun-2025
|
Updated Alt Text, Style Requirements, Machine Translation, Branding Requirements, and Formatting to Comply with Cisco's Guidelines for Externalization |
1.0 |
09-May-2024
|
Initial Release |

 Feedback
Contact Cisco
- Open a Support Case

- (Requires a Cisco Service Contract)