Validate Wi-Fi Throughput Testing and Monitoring Guide
Available Languages
Contents
Introduction
This document describes how to monitor and troubleshoot throughput issues in large Wi-Fi networks.
Context
In Wi-Fi networks, there are not many types of end-user perceived problems.
Reported problems can range between:
- Clients not being able to connect;
- Clients getting disconnected suddenly or;
- The perceived speed of the application on the user device is not satisfactory.
Behind these simple symptoms can lie various types of problems, most not even involving the actual Wi-Fi networks like DNS issues, internet connection problems, and so on. Management servers such as Cisco Catalyst Center, help the administrator to troubleshoot specific problems and while this article does not go into detail over many types of day-to-day issues that can be easily seen and remediated through Catalyst Center. Instead, this document focuses on the vague feedback from end users such as the network is slow, how to test that along with how to validate the actual throughput throughout your network. And how to triage the speed-related problems into actionable items to improve the overall end user experience; these are all questions this document details.
Defining the Maximum Expected Throughput
The first question in each network is, what is the maximum speed that could potentially and realistically be reached? Since Wi-Fi is a shared medium, the speed experienced depends directly on the number of clients and devices using Wi-Fi at the same moment and on the same channel. The maximum speed that can be achieved implies having a single client device and a single access point in an isolated place where no one is using the same Wi-Fi channel. In these conditions, the factors determine the maximum speed boil down to:
- The Wi-Fi protocol used (Wi-Fi 5, Wi-Fi 6, and so on.)
- The hardware capabilities of the client and the access point (number of antennas, number of spatial streams, Ethernet connection of the access point, and so on.)
- The configuration (channel width, and other configuration details.)
Knowing these factors allows you to have an estimate of what the maximum real-time throughput you can hope to reach in lab conditions. To give you an idea, you can check the data rate your client reports to be connected to the access point. This data rate is not the actual throughput you can prove in your tests. This is because Wi-Fi is a half-duplex medium that has some management overhead (frames must be acknowledged, beacons must be transmitted, and so on). There are also short silences between frames for better reception and decoding. This means when data is sent, it is sent at the documented data rate, however, data is not always sent.
Management and control frames are sent at a much lower data rate to ensure reception. An estimate you can consider achieving is approximately 65% to 70% of the data rate used in an actual throughput test. For example, if your client reports being connected and sending data at 866 Mbps, actual tests must report a transfer speed around 600 Mbps. If you know the configuration parameters in use and the hardware capabilities of the involved devices, you can determine which maximum data rate (and throughput by using the percentage calculation documented in this section) must be achievable.
If there is a mismatch between the reported data rate and the one you were hoping to achieve, you can start the troubleshooting process by the configuration and verify the various parameters to understand where the gap is. For example, if you have an Access Point Model C9120 broadcasting at 20 Mhz channel width in the 5 Ghz band and a typical 2 spatial streams Wi-Fi 6 client, you can calculate that in a perfectly clean RF (Radio Frequency) environment. With a single client, you can hope to achieve 160-200 Mbps in a single file transfer.
Refer to the throughput testing and validation documentation guide Validate and Test Wi-Fi 6/6E and Wi-Fi 7 Wireless Throughput.
Establish the Baseline Experience
It is important to know what can be expected in your venue in typical circumstances. It is often the case a technician visits an empty site before a deployment roll-out and runs speed tests to document expected numbers. Once employees/customers come in, the site becomes busy, and the actual experience differs by a lot. Once a deployment goes live, it is a great idea to send technicians out to measure the actual experience in each area to take note of how the network is performing on an average day. This includes the average amount of clients per radio when the network is operating at a satisfactory level as well as the average throughput achieved with a speed test.
Look for Deviations of the Experience
When managing your network, monitoring for major alerts or devices that suddenly go offline is easy. This document focuses on the hard part, how to spot a wireless network that is operating, however, providing a subpar end user experience.
Finding Evidence of a Problem (Passive-Testing)
You have tested your network yourself and understand how it operates and you monitor your management systems and dashboards. Nothing has been reported as offline: you can take a step back and relax. Or can you?
Waiting for end-user reports of poor performance means you are already too late. By the time users provide feedback, the issue has persisted, and you only hear from the most vocal individuals. Many other users likely experienced frustration without contacting the help desk, which harms your network reputation. How do you identify performance issues as they happen?
1. The client assurance dashboard on Cisco Catalyst Center
The Cisco Catalyst Center Assurance dashboard displays an overall graph of client health. Expect some connection failures due to factors such as incorrect credentials or weak signal strength at the edge of your coverage. Instead of striving for 100 percent health, determine a realistic benchmark for your environment. A health score in the 90s generally indicates optimal performance.
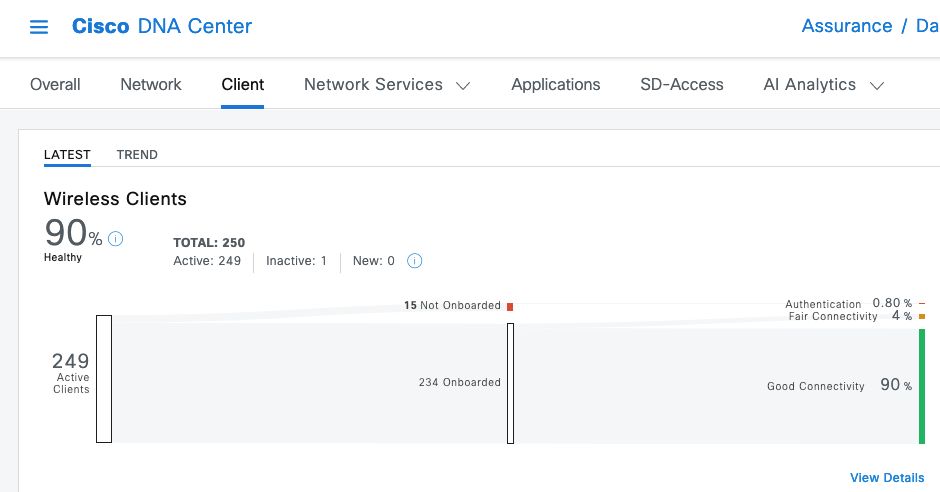
At a quick glance you can identify which clients are unhealthy:
- Are they far away from the AP (Access Point(s))?
- Is it an authentication problem?
This graph displays the ratio of each category.
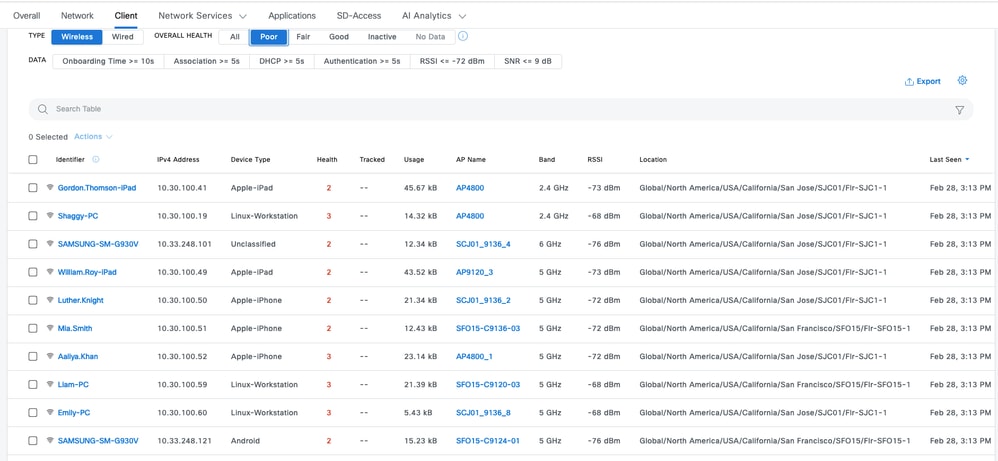
- Scroll to the end of the page.
- Filter the list to display client devices with poor health.
- Analyze the data to identify recurring patterns.
In this example:
- Devices that connect to the 2.4 GHz band, can result in a poorer experience.
- Devices have reported low signal strength on that 2.4 Ghz band.
- Devices share the same physical location .
2. The network assurance dashboard and device 360 on Cisco Catalyst Center
A good metric to spot potential problems is to check the Network Assurance page of Cisco Catalyst Center. There is a widget showing the top access points by client count:
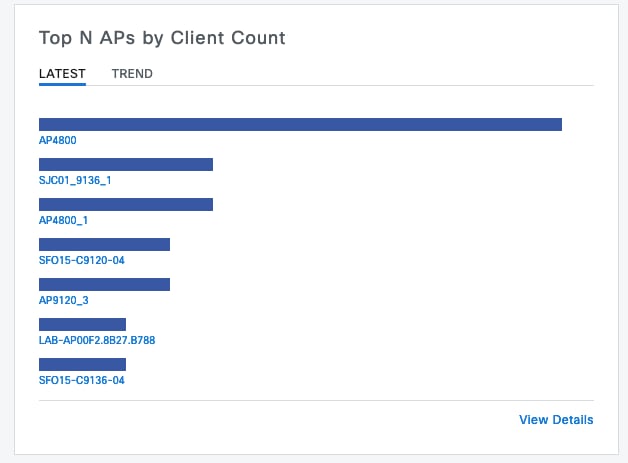
If the top access point in your network has 40 clients connected, this is fine. This implies all other APs (Access Points) have a lower client count. On the other hand, if the top AP(s) has an unusually high number of clients, you can assume the client experience is particularly poor (unless these clients are inactive and not on the network). You can move to a “per AP” investigation and zoom in on the top APs reported on this widget to understand their current health.
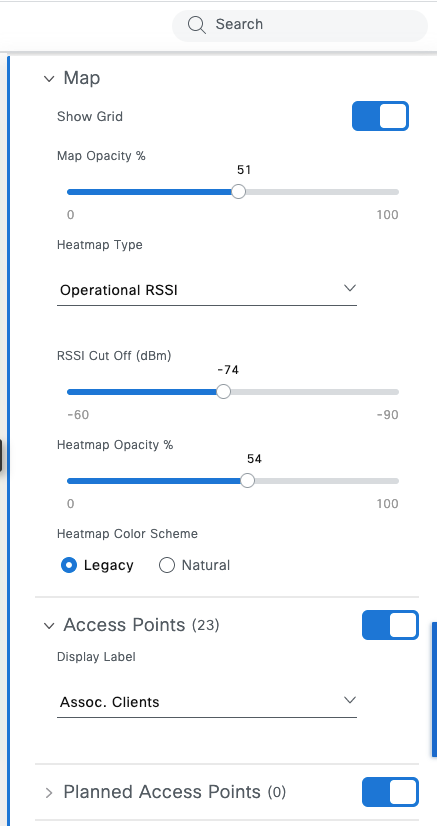
Another view of client count is on the maps in the Network Hierarchy page of your Catalyst Center. Once in the floor view page, click View Options> Access Points and change the display to Assoc. Clients to display the client count per AP.
Review these steps to utilize the map:
- By using the map, you can identify access points (APs) with high client counts and assess whether the density is justified by current activity.
- Examine the neighboring APs to determine if they share the client load.
- Investigate instances where one AP reports an abnormally high client count while neighbors report zero, as this indicates a potential issue.
- Check for RF design flaws, such as excessive transmit (TX) power or antenna configuration differences that cause one AP to attract a disproportionate number of clients.
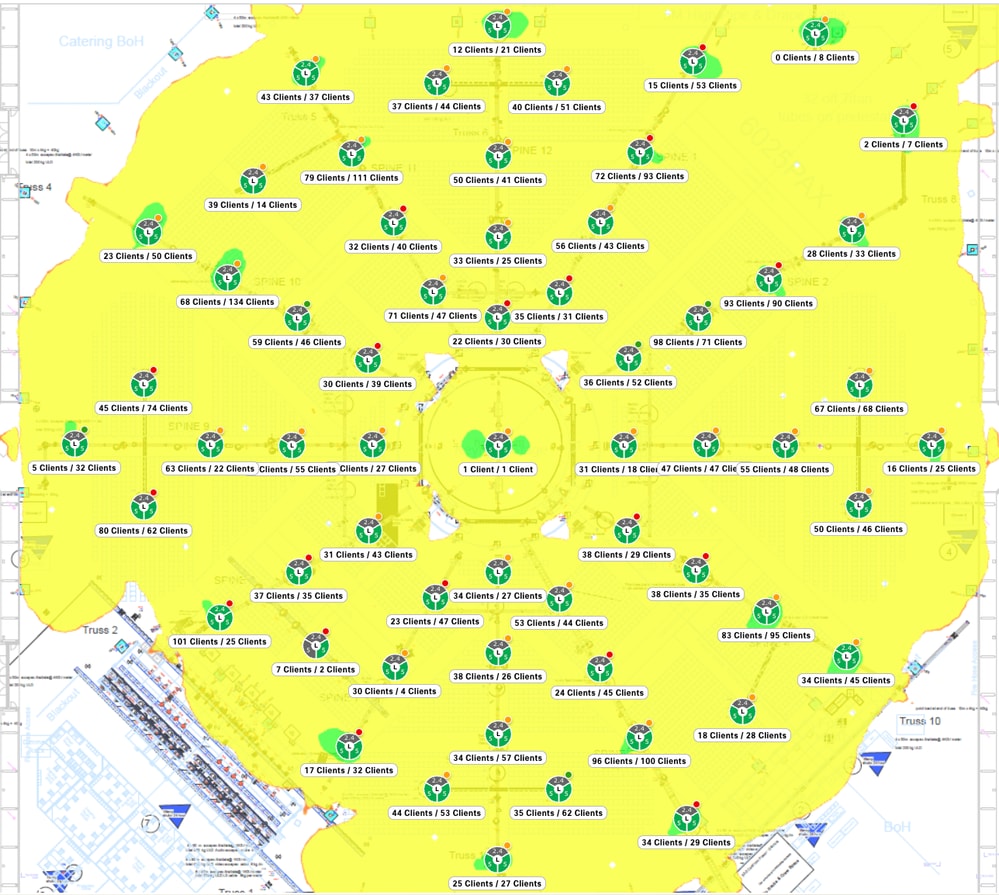 The map gives you a good overview of clients associated on each AP
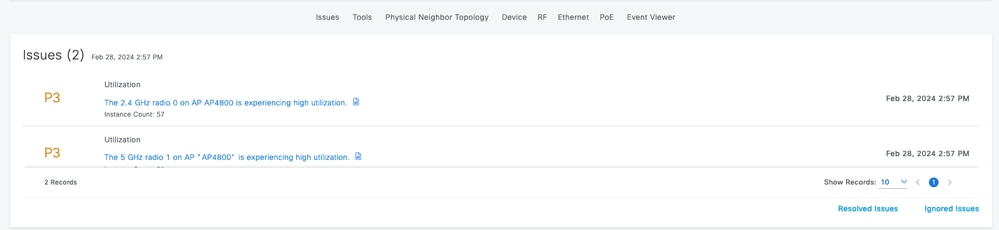
After identifying APs with high client counts, search for the AP name to open the Device 360 page. The health graph shows whether the AP health is currently poor or has persisted over the last 24 hours.

On the same page, you have a list of issues related to that AP. In this case, both radios are experiencing high utilization.
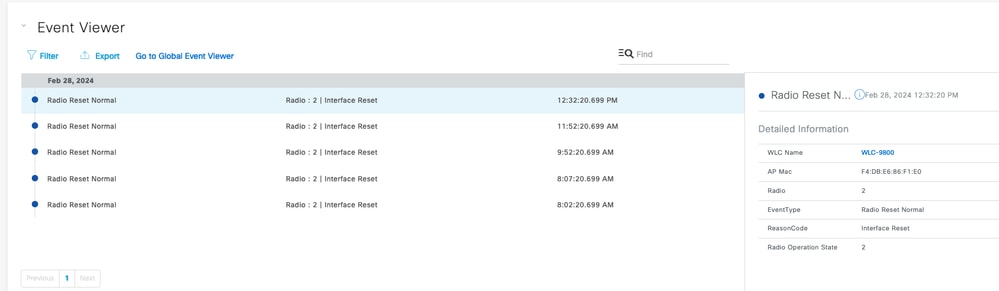
The event viewer identifies specific events related to that AP. For example, the RRM algorithm can run too frequently, causing recurrent channel changes that impact connected clients, or a radio can reset due to interference or other issues.
At the end of the Device 360 page, set the view to RF and select the specific radio to access data for evaluating the source of the problem. A high client count does not necessarily indicate a problem, as performance depends on client activity. Even with few clients, an AP experiences issues if it remains busy; channel utilization serves as the primary indicator. When channel utilization approaches 100%—or even 70%—clients contend for medium access, resulting in latency and collisions. The graphs enable a comparison between total channel utilization and the APs contribution to that load.
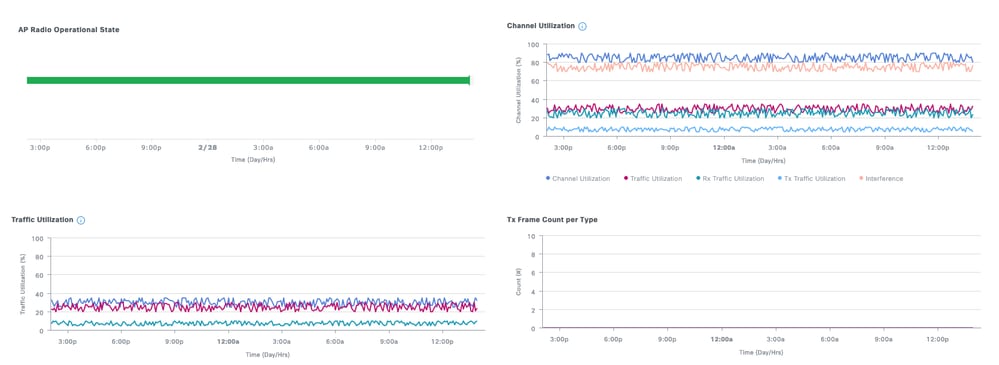
For instance, 80% channel utilization indicates that someone transmits on the channel 80% of the time. If the AP shows 40% Rx and 40% Tx utilization, this AP alone keeps the channel busy with a balanced load between transmit and receive. If the combined Rx and Tx utilization differ significantly from the total channel utilization, another AP—either rogue or managed—uses the same channel, which causes interference.
The image shows an AP with 91% channel utilization:
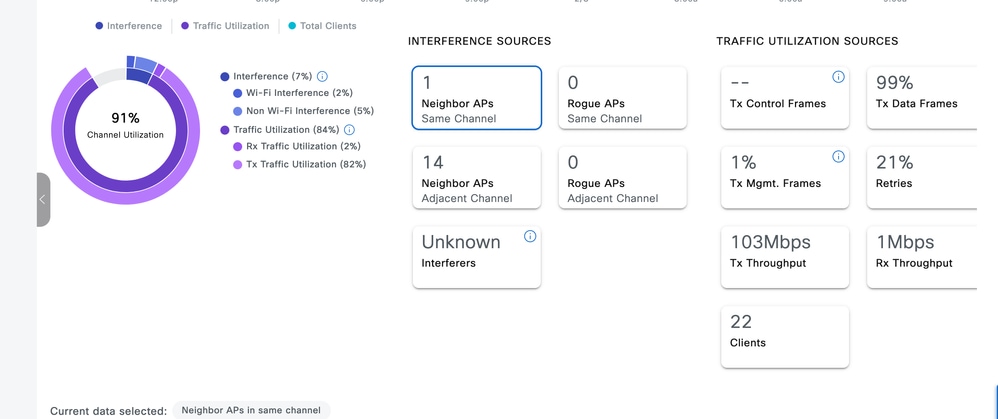
The graph shows 7% of utilization stems from other APs and non-Wi-Fi sources, while the AP transmits 82% of the time and receives 2% of the time. High client counts and total throughput indicate that one or more clients are likely downloading large files. The interference graph helps determine if Wi-Fi transmissions or non-Wi-Fi interference keep the channel busy:
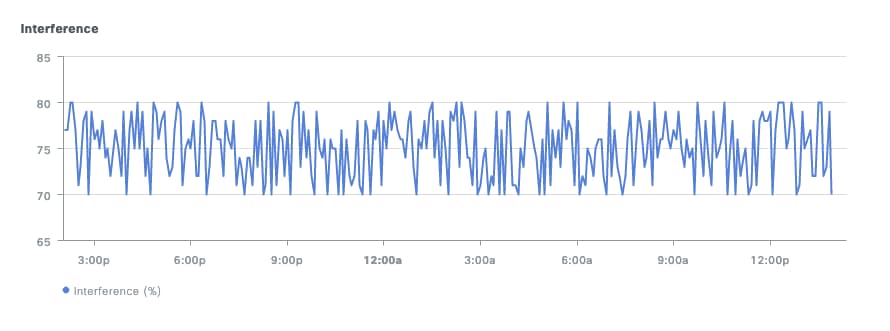
As a rule of thumb, monitor APs with the highest client count and channel utilization. Evaluate whether this load is justified and if it negatively impacts the end-user experience in that area.
3. AI Analytics
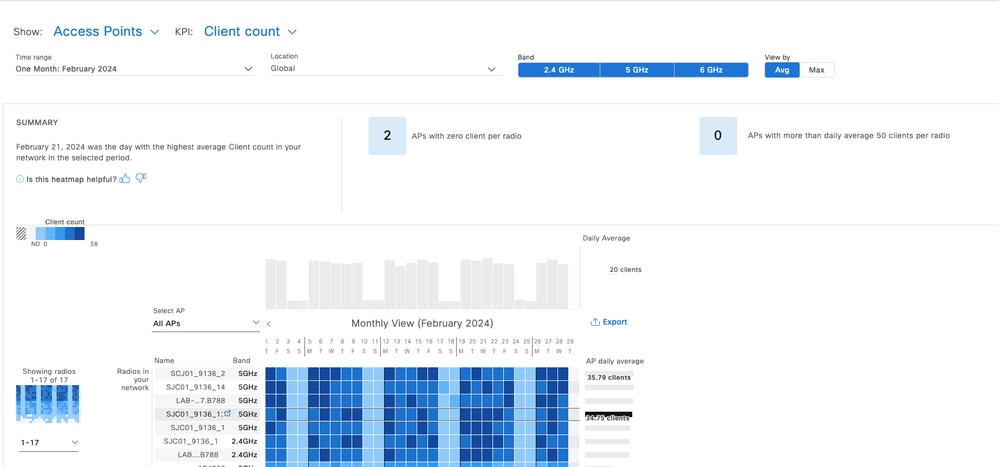
AI analytics provides intelligent monitoring that adapts to your baseline usage rather than relying on fixed thresholds. The network heatmap displays client count trends, highlighting APs with the highest density over the week. It also identifies APs with zero client connections, which indicates a different type of issue. These instances suggest physical problems, such as mounting or antenna issues, or software failures where a radio reboot resolves the state.
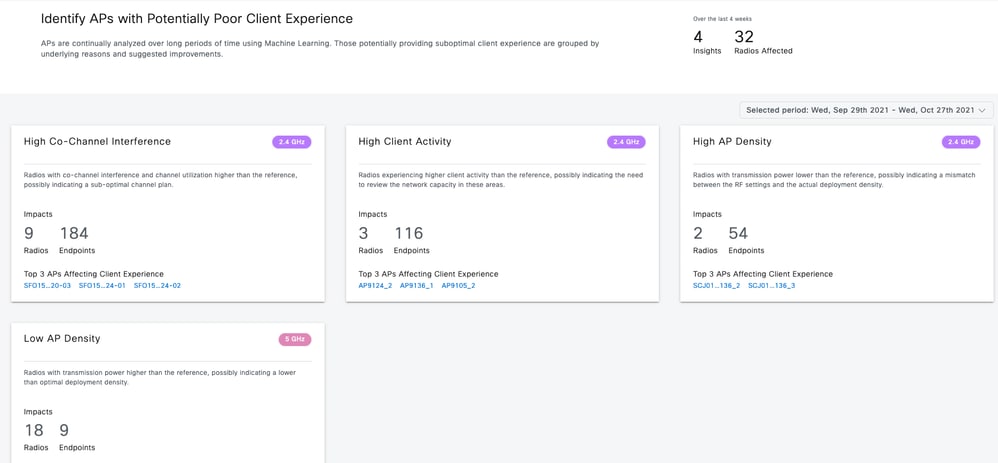
The Trends and Insights page lists APs with high channel utilization or client activity. Use this list to cross-check busiest areas or identify anomalies.
Active Testing of the Infrastructure
Active testing can confirm user reports of poor experience. Testing differs from real-life traffic. Users prioritize application performance over large file transfers. Application behaviors include:
- Video: Consumes variable bandwidth and tolerates jitter through buffering (for example, video variances from 720p or 4K). Traffic appears as periodic bursts.
- Voice: Uses minimal bandwidth but requires low latency and jitter. Often uses QoS (Quality of Service) tagging for prioritization.
- Data: Downloads data in bursts depending on content and user interaction.
Throughput tests maximize protocols for peak transfer speed, which differs from the bursty nature of real-life applications. Testing real-life applications mimics user behavior but lacks objective metrics, providing only a subjective assessment of network performance.
Popular websites test end-to-end bandwidth. To isolate wireless performance from internet, routing, and firewall issues, use a dedicated throughput testing tool such as Iperf.
This tool tests throughput between a client and a server. By moving the server, you can validate different network sections. Use these placement guidelines:
- For local switching or fabric-enabled wireless, place the Iperf server on the same switch as the AP.
- For central switching, place the server on the same switch as the WLC (Wireless LAN Controller), ideally in the client VLAN.
- For anchored traffic, place the server on the same switch as the anchor WLC where traffic terminates.
Test a non-anchored WLAN to determine if anchoring itself impacts throughput. Use only one client for testing. A single client can consume the entire available airtime; using multiple clients divides the results and increases collisions, making the data inaccurate. While third-party tools can automate this process, limit testing frequency to avoid disrupting other clients.
Troubleshooting a Throughput Problem
To identify and isolate throughput issues, use these steps:
- Determine if the RF environment is busy before starting the test. High channel utilization reduces throughput results. If utilization is high, check for co-channel interference and reconsider the RF design. Consider reducing channel width, eliminating rogue devices, or using directional antennas. Adding more APs is not always the solution.
- Perform an over-the-air capture to analyze 802.11 retries. A high retry percentage indicates RF issues. Verify data rates, protocols, and spatial streams. Efficient transfers show rapid data frames followed by a block ACK. Conversely, regular ACKs after every frame or excessive RTS (Request-to-Send)/CTS (Clear-to-Send) frames explain low throughput.
- Test multiple security types on the WLAN. Incompatibilities between the client and AP security settings can cause poor throughput.
Revision History
| Revision | Publish Date | Comments |
|---|---|---|
2.0 |
08-Jul-2026
|
Updated spelling, grammar, sentence structure, spacing, inserted lines to separate sections, alt text, and CCW alerts. |
1.0 |
04-Mar-2024
|
Initial Release |

 Feedback
Contact Cisco
- Open a Support Case

- (Requires a Cisco Service Contract)