Validate and Test Wi-Fi 6/6E and Wi-Fi 7 Wireless Throughput
Available Languages
Download Options
Bias-Free Language
The documentation set for this product strives to use bias-free language. For the purposes of this documentation set, bias-free is defined as language that does not imply discrimination based on age, disability, gender, racial identity, ethnic identity, sexual orientation, socioeconomic status, and intersectionality. Exceptions may be present in the documentation due to language that is hardcoded in the user interfaces of the product software, language used based on RFP documentation, or language that is used by a referenced third-party product. Learn more about how Cisco is using Inclusive Language.
Introduction
This document describes the way of testing the wireless throughput of an access point focusing on 802.11ax and what throughput to expect.
Prerequisites
Requirements
This document assumes an already functioning setup with 802.11ax / Wi-Fi 6 access points (APs) giving client connectivity already
Components Used
The information in this document is focused on 802.11ax/Wi-Fi 6 technology and speeds.
The information in this document was created from the devices in a specific lab environment. All of the devices used in this document started with a cleared (default) configuration. If your network is live, ensure that you understand the potential impact of any command.
Understand the protocol evolution
Wi-Fi 6 can operate on several bands : 2.4Ghz, 5Ghz and even the 6Ghz band as per the Wi-Fi 6E certification.
| 802.11ac (Wi-Fi 5) wave 2 | 802.11ax (Wi-Fi 6/6E) | |
| Channel width | 20,40,80,80-80,160 Mhz | 20,40,80,80-80,160 Mhz |
| Maximum spatial streams | 8 | 8 |
| Maximum modulation | 256-QAM (MCS9) | 1024-QAM (MCS11) |
| Maximum theoretical data rate | 3.47Gbps ( 3 SS) - 6.9Gbps (8 SS) | 9.6 |
| Achievable maximum throughput (assuming a 65% MAC efficiency on highest MCS data rate) | 1.5Gbps (3 spatial streams) | 1.5Gbps (2 spatial stream client) |
802.11ac/Wi-Fi 5 came in two waves. The second wave brought the 160Mhz channel support, along with MU-MIMO and a theoretical maximum of 8 spatial streams.
These numbers are only the theoretical numbers from the standard, differences apply depending on the specific AP datasheet.
802.11ax/Wi-Fi 6 is not directly defined in data rates speeds, but is rather a combination of 12 modulation encoding scheme (MCS 0 to MCS 11), a channel width ranging from 20mhz (1 channel) to 160Mhz (8 channels), a number of spatial streams (typically 1 to 2, there has been some 3 spatial streams products but they are seen less and less).
The short,medium or long Guard Interval (GI) also add around a 10% modification to this.
Here is a table to evaluate a datarate in Mbps when knowing all those factors :
|
Spatial Streams |
VHT MCS Index |
Modulation |
Coding Rate |
20 MHz Data Rates (Mb/s) |
40 MHz Data Rates (Mb/s) |
80 MHz Data Rates (Mb/s) |
160 MHz / 80+80 MHz Data Rates (Mb/s) |
320MHz |
||||||||||
|
800ns GI |
1600ns GI |
3200ns GI |
800ns GI |
1600ns GI |
3200ns GI |
800ns GI |
1600ns GI |
3200ns GI |
800ns GI |
1600ns GI |
3200ns GI |
800ns GI |
1600ns GI |
3200ns GI |
||||
|
1 |
0 |
BPSK |
1/2 |
8.6 |
8.1 |
7.3 |
17.2 | 16.3 | 14.6 | 36 | 34 | 30.6 | 72.1 | 68.1 |
61.3 |
144.1 |
136.1 |
122.5 |
|
1 |
QPSK |
1/2 |
17.2 | 16.3 | 14.6 | 34.4 | 32.5 | 29.3 | 72.1 | 68.1 | 61.3 | 144.1 | 136.1 |
122.5 |
288.2 |
272.2 |
245 |
|
|
2 |
QPSK |
3/4 |
25.8 | 24.4 | 21.9 | 51.6 | 48.8 | 43.9 | 108.1 | 102.1 | 91.9 | 216.2 | 204.2 | 183.8 | 432.4 |
408.3 |
367.5 | |
|
3 |
16-QAM |
1/2 |
34.4 | 32.5 | 29.3 | 68.8 | 65 | 58.5 | 144.1 | 136.1 | 122.5 | 288.2 | 272.2 | 245 | 576.5 |
544.4 |
490 | |
|
4 |
16-QAM |
3/4 |
51.6 | 48.8 | 43.9 | 103.2 | 97.5 | 87.8 | 216.2 | 204.2 | 183.8 | 432.4 | 408.3 | 367.5 | 864.7 |
816.7 |
735 | |
|
5 |
64-QAM |
2/3 |
68.8 | 65 | 58.5 | 137.6 | 130 | 117 | 288.2 | 272.2 | 245 | 576.5 | 544.4 | 490 | 1152.9 |
1088.9 |
980 | |
|
6 |
64-QAM |
3/4 |
77.4 | 73.1 | 65.8 | 154.9 | 146.3 | 131.6 | 324.3 | 306.3 | 275.6 | 648.5 | 612.5 | 551.3 | 1297.1 |
1225 |
1102.5 | |
|
7 |
64-QAM |
5/6 |
86 | 81.3 | 73.1 | 172.1 | 162.5 | 146.3 | 360.3 | 340.3 | 306.3 | 720.6 | 680.6 | 612.5 | 1441.2 |
1361.1 |
1225 | |
|
8 |
256-QAM |
3/4 |
103.2 | 97.5 | 87.8 | 206.5 | 195 | 175.5 | 432.4 | 408.3 | 367.5 | 864.7 | 816.7 | 735 | 1729.4 |
1633.3 |
1470 | |
|
9 |
256-QAM |
5/6 |
114.7 | 108.3 | 97.5 | 229.4 | 216.7 | 195 | 480.4 | 453.7 | 408.3 | 960.8 | 907.4 | 816.7 | 1921.6 |
1814.8 |
1633.3 | |
|
10 |
1024-QAM |
3/4 |
129 | 121.9 | 109.7 | 258.1 | 243.8 | 219.4 | 540.4 | 510.4 | 459.4 | 1080.9 | 1020.8 | 918.8 | 2161.8 |
2041.7 |
1837.5 | |
|
11 |
1024-QAM |
5/6 |
143.4 | 135.4 | 121.9 | 286.8 | 270.8 | 243.8 | 600.5 | 567.1 | 510.4 | 1201 | 1134.3 | 1020.8 | 2402 |
2268.5 |
2041.7 | |
|
12 |
4096-QAM |
3/4 |
154.9 | 146.3 | 131.6 | 309.7 | 295.5 | 263.3 | 648.5 |
612.5 |
551.3 |
1297.1 |
1225 |
1102 |
2594 |
2450 |
2205 | |
|
13 |
4096-QAM |
5/6 |
172.1 | 162.5 | 146.3 | 344.1 | 325 | 292.5 | 720.6 |
680.6 |
612.5 |
1441 |
1361 |
1225 |
2882 |
2722 |
2450 | |
|
2 |
0 |
BPSK |
1/2 |
7.2 | 16.3 | 14.6 | 34.4 | 32.5 | 29.3 | 72.1 | 68.1 | 61.3 | 144.1 | 136.1 | 122.5 | 288.2 | 272.2 | 245 |
|
1 |
QPSK |
1/2 |
34.4 | 32.5 | 29.3 | 68.8 | 65 | 58.5 | 144.1 | 136.1 | 122.5 | 288.2 | 272.2 | 245 | 576.5 | 544.4 | 490 | |
|
2 |
QPSK |
3/4 |
51.6 | 48.8 | 43.9 | 103.2 | 97.5 | 87.8 | 216.2 | 204.2 | 183.8 | 432.4 | 408.3 | 367.5 | 864.7 | 816.7 | 735 | |
|
3 |
16-QAM |
1/2 |
68.8 | 65 | 58.5 | 137.6 | 130 | 117 | 288.2 | 272.2 | 245 | 576.5 | 544.4 | 490 | 1152.9 | 1088.9 | 980 | |
|
4 |
16-QAM |
3/4 |
103.2 | 97.5 | 87.8 | 206.5 | 195 | 175.5 | 432.4 | 408.3 | 367.5 | 864.7 | 816.7 | 735 | 1729.4 | 1633.3 | 1470 | |
|
5 |
64-QAM |
2/3 |
137.6 | 130 | 117 | 275.3 | 260 | 234 | 576.5 | 544.4 | 490 | 1152.9 | 1088.9 | 980 | 2305.9 | 2177.8 | 1960 | |
|
6 |
64-QAM |
3/4 |
154.9 | 146.3 | 131.6 | 309.7 | 292.5 | 263.3 | 648.5 | 612.5 | 551.3 | 1297.1 | 1225 | 1102.5 | 2594 | 2450 | 2205 | |
|
7 |
64-QAM |
5/6 |
172.1 | 162.5 | 146.3 | 344.1 | 325 | 292.5 | 720.6 | 680.6 | 612.5 | 1441.2 | 1361.1 | 1225 | 2882.4 | 2722.2 | 2450 | |
|
8 |
256-QAM |
3/4 |
206.5 | 195 | 175.5 | 412.9 | 390 | 351 | 864.7 | 816.7 | 735 | 1729.4 | 1633.3 | 1470 | 3458.8 | 3266.7 | 2940 | |
|
9 |
256-QAM |
5/6 |
229.4 | 216.7 | 195 | 458.8 | 433.3 | 390 | 960.8 | 907.4 | 816.7 | 1921.6 | 1814.8 | 1633.3 | 3843 | 3629.6 | 3266.7 | |
|
10 |
1024-QAM |
3/4 |
258.1 | 243.8 | 219.4 | 516.2 | 487.5 | 438.8 | 1080.9 | 1020.8 | 918.8 | 2161.8 | 2041.7 | 1837.5 | 4323.5 | 4083.3 | 3675 | |
|
11 |
1024-QAM |
5/6 |
286.8 | 270.8 | 243.8 | 573.5 | 541.7 | 487.5 | 1201 | 1134.3 | 1020.8 | 2402 | 2268.5 | 2041.7 | 4803.9 | 4537 | 4083.3 | |
|
12 |
4096-QAM |
3/4 |
309.7 | 292.5 | 263.3 | 619.4 | 585 | 526.5 | 1297.1 | 1225 | 1102.5 | 2594.1 | 2450 | 2205 | 5188.2 | 4900 | 4410 | |
|
13 |
4096-QAM |
5/6 |
344.1 |
325 |
292.5 |
688.2 | 650 | 585 | 1441.2 | 1361.1 | 1225 | 2882.4 | 2722.2 | 2450 | 5764.7 | 5444.4 | 4900 | |
|
3 |
0 |
BPSK |
1/2 |
25.8 | 24.4 | 21.9 | 51.6 | 48.8 | 43.9 | 108.1 | 102.1 | 91.9 | 216.2 | 204.2 | 183.8 | 432.4 | 408.3 | 367.5 |
|
1 |
QPSK |
1/2 |
51.6 | 48.8 | 43.9 | 103.2 | 97.5 | 87.8 | 216.2 | 204.2 | 183.8 | 432.4 | 408.3 | 367.5 | 864.7 | 816.7 | 735 | |
|
2 |
QPSK |
3/4 |
77.4 | 73.1 | 65.8 | 154.9 | 146.3 | 131.6 | 324.3 | 306.3 | 275.6 | 648.5 | 612.5 | 551.3 | 1297.1 | 1225 | 1102.5 | |
|
3 |
16-QAM |
1/2 |
103.2 | 97.5 | 87.8 | 206.5 | 195 | 175.5 | 432.4 | 408.3 | 367.5 | 864.7 | 816.7 | 735 | 1729.4 | 1633.3 | 1470 | |
|
4 |
16-QAM |
3/4 |
154.9 | 146.3 | 131.6 | 309.7 | 292.5 | 263.3 | 648.5 | 612.5 | 551.3 | 1297.1 | 1225 | 1102.5 | 2594.1 | 2450 | 2205 | |
|
5 |
64-QAM |
2/3 |
206.5 | 195 | 175.5 | 412.9 | 390 | 351 | 864.7 | 816.7 | 735 | 1729.4 | 1633.3 | 1470 | 3458.8 | 3266.7 | 2940 | |
|
6 |
64-QAM |
3/4 |
232.3 | 219.4 | 197.4 | 464.6 | 438.8 | 394.9 | 972.8 | 918.8 | 826.9 | 1945.6 | 1837.5 | 1653.8 | 3891.2 | 3675 | 3307.5 | |
|
7 |
64-QAM |
5/6 |
258.1 | 243.8 | 219.4 | 516.2 | 487.5 | 438.8 | 1080.9 | 1020.8 | 918.8 | 2161.8 | 2041.7 | 1837.5 | 4323.5 | 4083.3 | 3675 | |
|
8 |
256-QAM |
3/4 |
309.7 | 292.5 | 263.3 | 619.4 | 585 | 526.5 | 1297.1 | 1225 | 1102.5 | 2594.1 | 2450 | 2205 | 5188.2 | 4900 | 4410 | |
|
9 |
256-QAM |
5/6 |
344.1 | 325 | 292.5 | 688.2 | 650 | 585 | 1441.2 | 1361.1 | 1225 | 2882.4 | 2722.2 | 2450 | 5764.7 | 5444.4 | 4900 | |
|
10 |
1024-QAM |
3/4 |
387.1 | 365.6 | 329.1 | 774.3 | 731.3 | 658.1 | 1621.3 | 1531.3 | 1378.1 | 3242.6 | 3062.5 | 2756.3 | 6485.3 | 6125 | 5512.5 | |
|
11 |
1024-QAM |
5/6 |
430.1 | 406.3 | 365.6 | 860.3 | 812.5 | 731.3 | 1801.5 | 1701.4 | 1531.3 | 3602.9 | 3402.8 | 3062.5 | 7205.9 | 6805 | 6125 | |
A more complete table can found at : https://mcsindex.com/
Note: The data rate is NOT equal to the expected achievable throughput. This is related to the nature of 802.11 standard which has a lot of administrative overhead (management frames, contention, collision,acknowledgements,...) and it can depend on the link SNR, RSSI and other significant factors.
You can calculate throughput with the use of this equation used for 802.11ax speed or data rate:
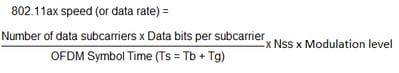
Equation Used for 802.11ax Speed or Data Rate
It is a rule of thumb:
Expected throughput = Data Rate x 0.7
Take a real life example. A Cisco 9120 AP with a modern Wi-Fi 6 capable smartphone that is capable of 2 Spatial Streams. If we are in a high density environment where 20 Mhz channels are used, the maximum data rate used is between 240 and 280Mbps depending on the guard interval. This means that, in a clean environment and test conditions, we could have one client transferring data between 160 to 200 Mbps possibly (65 to 70% of protocol efficiency). This is only valid when doing an actual large transfer or speed test where the protocol is optimized for maximum data throughput. When using other applications, throughput goes down as latency also plays a role in protocols that do a ping-pong of packets and wait for acknowledgements before moving forward.
Note as well that wireless is shared environment, this means that the amount of clients connected to the AP are sharing the effective throughput between each other. If one client doing a speed test can reach between 160 to 200MBps, this means that two clients doing a speed test at the same time see each 80 to 100Mbps. If four clients do a speed test at the same time, they see 40 to 50Mbps each and so on ...
On top of that, more clients mean more contention and inevitably more collision. The effiency of the coverage cell drastically decreases as the number of clients increase. It is thefore unrealistic to set any kind of SLA for throughput in places where you do not control the amount of clients connected or what they are doing on the network in terms of activity.
Wi-Fi 7
Wi-Fi 7 brings a lot of protocol improvements that will make the observed throughput better. However, maximum speeds are mostly improved by the addition of MCS 12 and 13 data rate (Which require to be very close to the access point though) as well as the addition of 320Mhz channel width (which is maybe not realistic to use in an enterprise setting as it bundles a lot of channels together). It does not change much to the testing methodology explained in this document.
Multi-Link Operation (MLO) is another improvement of Wi-Fi 7 that is often used to boast huge potential data rates. In real-life, most clients will connect on several bands with MLO but will mostly use a single band (in order to save battery life). The 5 and 6GHz bands are also hard to use simultaneously due to the interferences the radios cause to each other. Verify how your client is connected in order to anticipate what speeds it can reasonably achieve.
Measure
Generally speaking, we can have two scenarios when you do a throughput test:
- APs are in Flexconnect local switching
- APs are in local mode or Flexconnect central switching
Take those scenarios one by one:
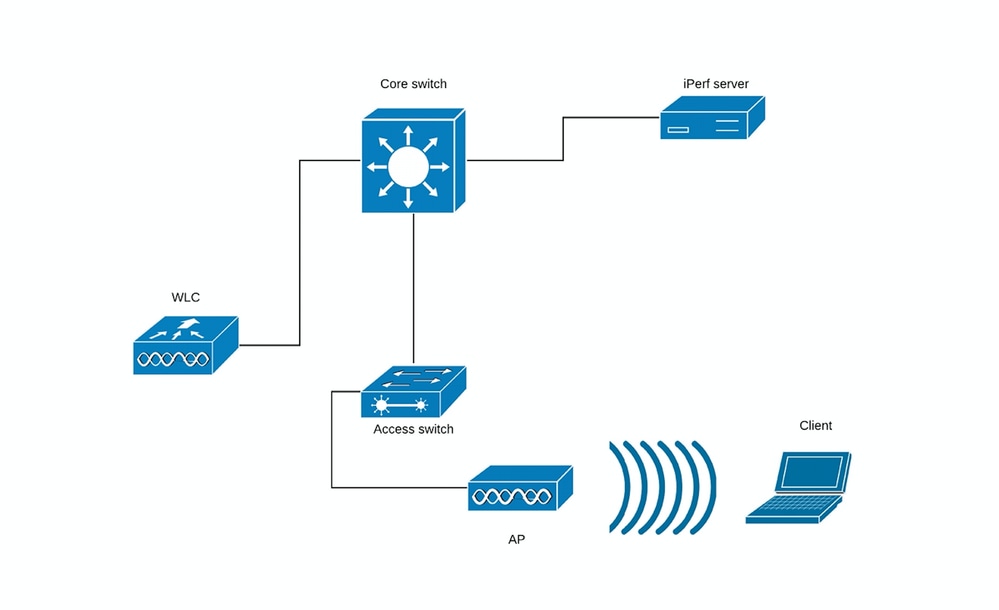
(Diagram 1)
In case of Diagram 1 we suppose that the APs are in local mode of Flexconnect central switching.
This means that all client traffic is encapsulated into CAPWAP tunnel and terminated on the WLC.

(Diagram 2)
The red line in the Diagram 2 shows the traffic flow from the wireless client.
The iPerf server must be as close as possible to the traffic termination point, ideally plugged in the same switch as the WLC itself and use the same VLAN.
In case of Flexconnect local switching, the client traffic is terminated on the AP itself, and considering that the iPerf server must be set up as close to the termination point of wireless client traffic, plug in the iPerf server to the same switch and same VLAN where AP is plugged.
In our case this is access switch (Diagram 3).
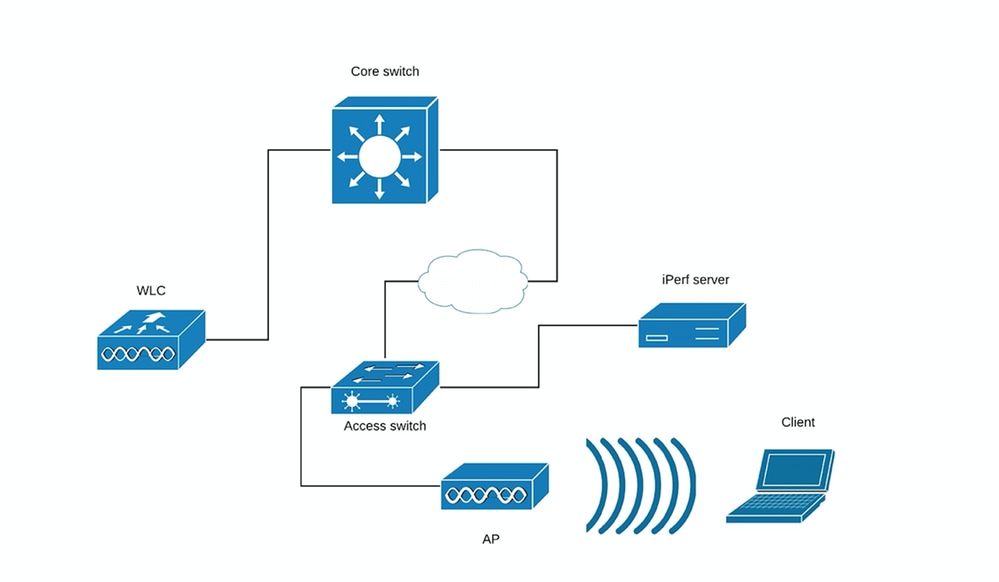
(Diagram 3)
The iPerf tests can be subdivided into two categories: upstream and downstream.
Considering that the iPerf server is listening and iPerf client is generating the traffic, when the iPerf server is on the wired side, this is considered upstream test.
The wireless client is using the iPerf application to push the traffic into the network.
The downstream test is vice-versa, meaning that the iPerf server is set on the wireless client itself and the iPerf client is on the wired side pushing the traffic to the wireless client, in this scenario, this is considered downstream.
The test must be done using TCP and UDP. You can use these commands to perform the tests:
iperf3 -s  <- this command starts iPerf server

iperf3 -c SERVER_ADDRESS -u -b700M <- this command initiates UDP iPerf test with bandwidth of 700 Mbps

iperf3 -c SERVER_ADDRESS <- this command initiates a simple TCP iPerf test

iperf3 -c SERVER_ADDRESS  -w WINDOW_SIZE  -P NUM_OF_PARALLEL_TCP_STREAMS <- this commands initiates a more complex  TCP iPerf test where you can adjust the window size as well the number of parallel TCP streams.
Please not that in this case you should consider the sum of all the streams as the result
Example of iPerf3 outputs:
TCP iPerf3:
[ ID] Interval           Transfer     Bandwidth
[  5]   0.00-10.06  sec  0.00 Bytes  0.00 bits/sec                  sender
[  5]   0.00-10.06  sec   188 MBytes   157 Mbits/sec                  receiver

[ ID] Interval           Transfer     Bandwidth
[  5]   0.00-10.05  sec  0.00 Bytes  0.00 bits/sec                  sender
[  5]   0.00-10.05  sec   304 MBytes   254 Mbits/sec                  receiver
   With 10 parallel TCP streams:
[ ID] Interval           Transfer     Bandwidth
[  5]   0.00-10.06  sec  0.00 Bytes  0.00 bits/sec                  sender
[  5]   0.00-10.06  sec  88.6 MBytes  73.9 Mbits/sec                  receiver
[  7]   0.00-10.06  sec  0.00 Bytes  0.00 bits/sec                  sender
[  7]   0.00-10.06  sec  79.2 MBytes  66.0 Mbits/sec                  receiver
[  9]   0.00-10.06  sec  0.00 Bytes  0.00 bits/sec                  sender
[  9]   0.00-10.06  sec  33.6 MBytes  28.0 Mbits/sec                  receiver
[ 11]   0.00-10.06  sec  0.00 Bytes  0.00 bits/sec                  sender
[ 11]   0.00-10.06  sec  48.7 MBytes  40.6 Mbits/sec                  receiver
[ 13]   0.00-10.06  sec  0.00 Bytes  0.00 bits/sec                  sender
[ 13]   0.00-10.06  sec  77.0 MBytes  64.2 Mbits/sec                  receiver
[ 15]   0.00-10.06  sec  0.00 Bytes  0.00 bits/sec                  sender
[ 15]   0.00-10.06  sec  61.8 MBytes  51.5 Mbits/sec                  receiver
[ 17]   0.00-10.06  sec  0.00 Bytes  0.00 bits/sec                  sender
[ 17]   0.00-10.06  sec  46.1 MBytes  38.4 Mbits/sec                  receiver
[ 19]   0.00-10.06  sec  0.00 Bytes  0.00 bits/sec                  sender
[ 19]   0.00-10.06  sec  43.9 MBytes  36.6 Mbits/sec                  receiver
[ 21]   0.00-10.06  sec  0.00 Bytes  0.00 bits/sec                  sender
[ 21]   0.00-10.06  sec  33.3 MBytes  27.8 Mbits/sec                  receiver
[ 23]   0.00-10.06  sec  0.00 Bytes  0.00 bits/sec                  sender
[ 23]   0.00-10.06  sec  88.8 MBytes  74.0 Mbits/sec                  receiver
[SUM]   0.00-10.06  sec  0.00 Bytes  0.00 bits/sec                  sender
[SUM]   0.00-10.06  sec   601 MBytes   501 Mbits/sec                  receiver
UDP iPerf3:
When using UDP, it is important to make sure there no to little packet loss. It is possible to see very high throughput numbers, but if you have a 50% packet loss, you did not actually transfer that amount of data.
Sometime iPerf does misbehave and does not give the average bandwidth in the end of the UDP test.
It is still possible to sum up the Bandwidth for each second and then divide it by number of seconds:
Accepted connection from 192.168.240.38, port 49264
[  5] local 192.168.240.43 port 5201 connected to 192.168.240.38 port 51711
[ ID] Interval           Transfer     Bandwidth       Jitter    Lost/Total Datagrams
[  5]   0.00-1.00   sec  53.3 MBytes   447 Mbits/sec  0.113 ms  32/6840 (0.47%)
[  5]   1.00-2.00   sec  63.5 MBytes   533 Mbits/sec  0.129 ms  29/8161 (0.36%)
[  5]   2.00-3.00   sec  69.8 MBytes   586 Mbits/sec  0.067 ms  30/8968 (0.33%)
[  5]   3.00-4.00   sec  68.7 MBytes   577 Mbits/sec  0.071 ms  29/8827 (0.33%)
[  5]   4.00-5.00   sec  68.0 MBytes   571 Mbits/sec  0.086 ms  55/8736 (0.63%)
[  5]   5.00-6.00   sec  68.6 MBytes   576 Mbits/sec  0.076 ms  70/8854 (0.79%)
[  5]   6.00-7.00   sec  66.8 MBytes   561 Mbits/sec  0.073 ms  34/8587 (0.4%)
[  5]   7.00-8.00   sec  67.1 MBytes   563 Mbits/sec  0.105 ms  44/8634 (0.51%)
[  5]   8.00-9.00   sec  66.7 MBytes   559 Mbits/sec  0.183 ms  144/8603 (1.7%)
[  5]   9.00-10.00  sec  64.1 MBytes   536 Mbits/sec  0.472 ms  314/8415 (3.7%)
[  5]  10.00-10.05  sec   488 KBytes  76.0 Mbits/sec  0.655 ms  2/63 (3.2%)
- - - - - - - - - - - - - - - - - - - - - - - - -
[ ID] Interval           Transfer     Bandwidth       Jitter    Lost/Total Datagrams
[  5]   0.00-10.05  sec  0.00 Bytes  0.00 bits/sec  0.655 ms  783/84688 (0.92%)
[SUM]  0.0-10.1 sec  224 datagrams received out-of-order
Note: It is expected that the iPerf results are slightly better on the Flexconnect local siwtching compared to the central switching scenario.
This is caused by the fact that client traffic is encapsulated into CAPWAP, which adds more overhead to the traffic and in general the WLC acts as a bottleneck as it is the aggregation point for all wireless clients traffic.
As well, it is expected that the UDP iPerf test gives better results in a clean environment as it is the most efficient transfer method when the connection is reliable. TCP however, can win in case of heavy fragmentation (when TCP Adjust MSS is used) or unreliable connection
.
Verify and validate
First step is to verify the current client configuration. On Windows 11 navigate to Settings > Network & internet > Wi-Fi > Your_SSID_Name:
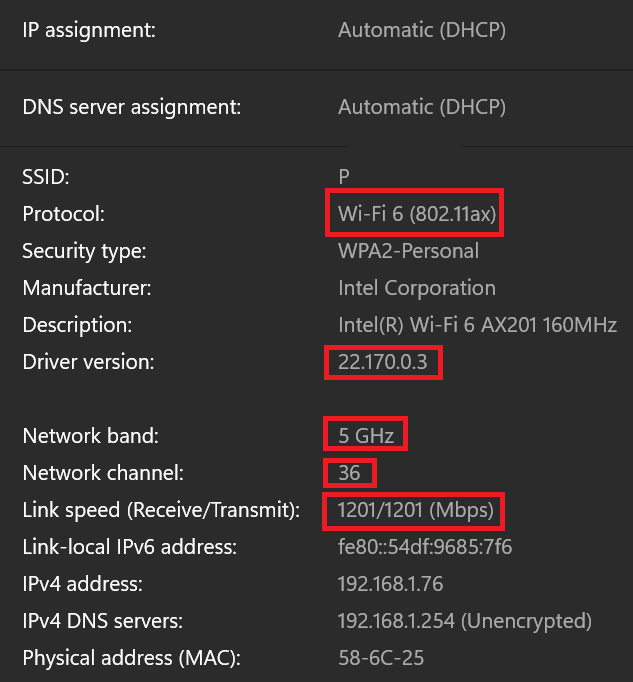 Wi-fi settings on the client
You can see how the IP address is assigned (in this case it was by Dynamic Host Configuration Protocol (DHCP) process) the protocol in use, the driver version, network band and channel, and link speed. The link speed is the maximum theoretical speed between the client and AP, which means that the real-life speed can be slower.

Caution: Verify if your driver version is on the latest version. A driver that is not up-to-date can cause impact on the network performance/speed.
If you do not reach the expected speeds, it can be because your client is not connecting to the 6GHz band and sticking with the other bands only. Despite having a Wi-Fi 6E adapter, some laptops require a BIOS update to get 6Ghz capabilities enabled. It also depends on the country where the test is taking place : some infrastructure APs disable 6GHz in some countries where it is not allowed yet and some client laptops are hardcoded not to use 6GHz in specific countries. Check both your AP and client firmware for details on the specific country you are testing with.
In order to check at which data rate the client is connected, issue these command in WLC CLI:
WLC#show wireless client mac-address 72e6.81a1.XXXX detail
(...)
Current Rate..................................... m11 ss2 -> MCS 11 (m11) index on 2 spatial streams (ss2)
(...)
Radio Signal Strength Indicator............ -46 dBm
      Signal to Noise Ratio...................... 49 dB
You can see the this particular client is connected on these rate:
Current Rate..................................... m10 ss2
Which means that the client is using the MCS 10 (m10) index on 2 spatial streams (ss2)
From the "show wireless client mac <MAC> det" command, it is not possible to see if the client is connected on 20/40/80 MHz channel bonding.
This can be done directly on the AP:
9164 example:
#show controllers dot11Radio 2 client E8:8D:A6:B0:3B:CA
              mac radio vap aid state       encr  Maxrate Assoc   Cap is_wgb_wired      wgb_mac_addr
E8:8D:A6:B0:3B:CA     2   0  33   FWD AES_CCM128 MCS112SS HE-6E HE-6E        false 00:00:00:00:00:00
Configured rates for client E8:8D:A6:B0:3B:CA
Legacy Rates(Mbps): 6 9 12 18 24 36 48 54
HE Rates: 1SS:M0-11 2SS:M0-11
HT:yes     VHT:no     HE:yes     40MHz:no     80MHz:yes     80+80MHz:no     160MHz:yes
11w:yes     MFP:no     11h:no     session_timeout: 79950     encrypt_policy: 4
_wmm_enabled:yes     qos_capable:yes     WME(11e):no     WMM_MIXED_MODE:no
short_preamble:no     short_slot_time:no     short_hdr:no     SM_dyn:no
short_GI_20M:no     short_GI_40M:no     short_GI_80M:no     LDPC:no     AMSDU:yes     AMSDU_long:no
su_mimo_capable:no     mu_mimo_capable:no     is_wgb_wired:no     is_wgb:no
HE_DL-MIMO:yes     HE_UL-MIMO:yes     HE_DL-OFDMA:yes     HE_UL-OFDMA:yes     HE_TWT_CAPABLE:no

Additional info for client E8:8D:A6:B0:3B:CA
RSSI: -52
SNR: 41
PS  : Legacy (Sleeping)
Tx Rate: 1297100 Kbps
Rx Rate: 1921600 Kbps
VHT_TXMAP: 0
CCX Ver: 0
Rx Key-Index Errs: 0

Statistics for client E8:8D:A6:B0:3B:CA
              mac   intf TxData TxMgmt TxUC TxBytes TxFail TxDcrd TxCumRetries RxData RxMgmt RxBytes RxErr                      TxRt(Mbps) RxRt(Mbps) idle_counter stats_ago expirat
ion
E8:8D:A6:B0:3B:CA apr2v0    391      4  391  129127      0      0           97    559      4   74055     0 HE-160,2SS,MCS6,GI0.8 ,BF(1297)         12          295  8.674000      79
950

Per TID packet statistics for client E8:8D:A6:B0:3B:CA
Priority Rx Pkts Tx Pkts Rx(last 5 s) Tx (last 5 s)
       0     539     383           84            28
       1       0       0            0             0
       2       0       2            0             0
       3       0       0            0             0
       4       0       0            0             0
       5       0       0            0             0
       6      20       3            5             1
       7       0       3            0             0

 Rate Statistics:
Rate-Index    Rx-Pkts    Tx-Pkts Tx-Retries
         0        176          3          0
         5          0         62          0
         6          4        178         21
         7        250        152         52
         8        100          2         22
         9         51          0          0
        10          1          0          0
        11          0          0          2
webauth done: true
Pre-WebAuth ACLs:
Post-Auth ACLs:
Acl name Quota Bytes left In bytes Out bytes In pkts Out pkts Drops-in Drops-out
iPSK TAG: \<0000000000000000>
              MAC Allow HIT iPSK tag
E8:8D:A6:B0:3B:CA  true   0      \<>
The last option to check the connected rate is OTA captures. In the radio information of the data packet, you can find the necessary information:
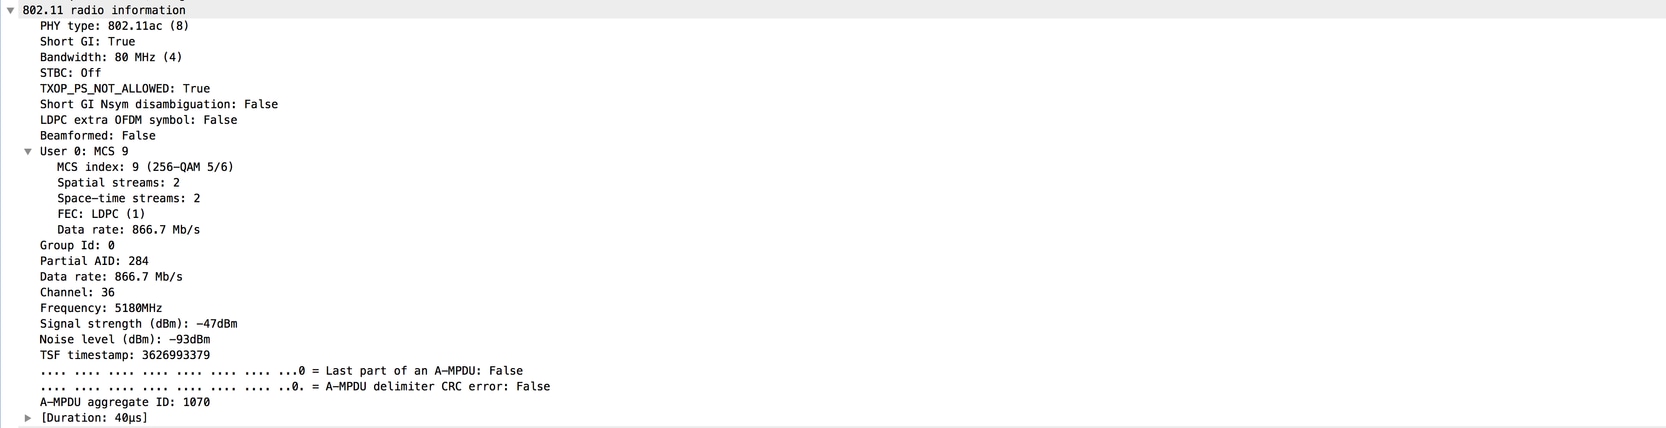
This OTA capture was taken with an 11ac macbook client.
Troubleshoot
In case you are not getting expected results during the test, there are several ways to troubleshoot the issue and collect necessary information before opening a TAC case.
The troughput issues can be caused by these:
- Client
- AP
- Wired path (switching related issues)
- WLC
Client troubleshooting
- First step is updating the drivers on the wireless client devices to the latest version
- Second step is doing the iPerf test with clients that have a different wireless adapter to see if you get the same results
-
If online meetings video 'freezes' or the audio has bad quality, configure QoS (Wi-Fi Quality of Service). Services that rely on real-time audio and video, such as voice over IP (VoIP), online gaming, enterprise videoconferencing have strong requirements in terms of latency and jitter to deliver a quality experience. QoS manages congestion problems and reduces the probability of the occurrence of a collision and avoids congestion in the first place. The real-time applications do not leverage with high throughputs and are not to be compared to low speeds in a network. They relate more to reliability of packet delivery in real-time.
Deploy the QoS settings on the WLC, with the profiles: Voice, Guest, Enterprise, Fastlane. These profiles are configured under the policy profile. WLC also provides four preconfigured QoS profiles: Platinum, Gold, Silver, and Bronze (metal QoS policies). Bronze for background or lowest-priority traffic, Silver for best effort, Gold for video applications, Platinum for voice applications.
AP troubleshooting
There can be scenarios when the AP is dropping traffic, or certain frames or otherwise misbehaving.
In order to get more insight about this, there are needed Over The Air (OTA) captures + span session on the AP switchport (span must be done on the switch where the AP is connected)
The OTA captures and SPAN must be done during the test, using open SSID in order to be able to see the traffic passed to the AP and the traffic AP is passing towards the client and vice a versa.
There are several known bugs for this behavior:
CSCvg07438 : AP3800: Low throughput due to packet drops in AP in both fragmented and non-fragmented packets
CSCva58429 : Cisco 1532i AP: low throughput (FlexConnect Local switching + EoGRE)
Wired path troubleshooting
There can be some problems on the switch itself, you need to check the amount of drops on the interfaces and if those increase during the tests.
Try using another port on the switch to connect the AP or WLC.
Another option is to plug in a client to the same switch (where the client termination point [AP/WLC] is connected to) and put it to the same VLAN, then run the tests wired to wired on the same VLAN to see if there are any issues in the wired path.
WLC troubleshooting
It can be that the WLC is dropping the traffic (when APs are in local mode) from the client.
You can put the AP in Flexconnect mode and the WLAN into local switching, then run the tests.
If you see that there are significant differences in the throughput in local mode (central switching) compared to Flexconnect local switching and there is no problem on the switch connected to WLC, then most probably the WLC is dropping the traffic.
To troubleshoot this, apply the action plan:
- SPAN captures on the WLC switchport (must be done on the switch)
- SPAN captures on the AP port
- OTA captures of the client
By performing this troubleshooting and providing the results to TAC, this speeds up the troubleshooting process.
Related information
- Details to get OTA with MacBook
- Details to get OTA with AP in Sniffer mode
- IPERF Test to measure the throughput/speed of a WLAN client
-
WLAN 802.11ax speed calculator | 802.11ax data rate calculator
-
Understand Wi-Fi 4/5/6/6E/7 (802.11 n/ac/ax/be)
- Cisco Technical Support & Downloads
- Validate Wi-Fi throughput : monitoring and testing guide
Revision History
| Revision | Publish Date | Comments |
|---|---|---|
4.0 |
08-Jan-2025
|
Updated for Wi-Fi7 |
3.0 |
26-Feb-2024
|
Updated for Wi-Fi6 |
2.0 |
12-Jul-2023
|
Recertification |
1.0 |
18-Mar-2018
|
Initial Release |
Contributed by Cisco Engineers
- Alexandr VitosinschiCisco TAC
- Nicolas DarchisCisco TAC
- Marta CoelhoCisco TAC
 Feedback
Contact Cisco
- Open a Support Case

- (Requires a Cisco Service Contract)