Configure and Verify Telemetry on Nexus Platform
Available Languages
Contents
Introduction
This document describes how to implement and verify Streaming Telemetry on Cisco Nexus 9000 switches running Cisco NX-OS.
Prerequisites
Requirements
Cisco recommends that you have basic knowledge of these topics:
- Cisco NX-OS CLI
- Basic Layer 3 IP connectivity
- Basic network monitoring concepts
- Basic familiarity with network telemetry concepts
Components Used
The information in this document is based on these software and hardware versions:
| Component | Platform / Software | Version / Value | Purpose |
|---|---|---|---|
| N9K-TELEMETRY-SW1 | N9K-C9348GC-FXP | 10.6(4) | Telemetry source |
| Telemetry receiver | Ubuntu Server | 22.04.5 | External telemetry receiver |
| Telemetry application | Telegraf | 1.40.0 | Google Protocol Buffers (GPB)-over-gRPC telemetry receiver |
| Listening port | TCP | 57000 | Telemetry receiver port |
| Receiver output format | JavaScript Object Notation (JSON) | — | Human-readable telemetry output |
The information in this document was created from the devices in a specific lab environment. All of the devices used in this document started with a cleared (default) configuration. If your network is live, ensure that you understand the potential impact of any command.
Topology
The lab uses a Cisco Nexus 9000 switch connected directly to an Ubuntu server that operates as the external telemetry receiver.
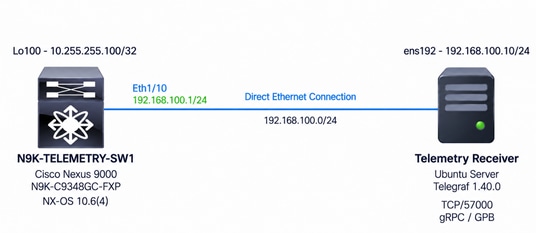
The Nexus switch and telemetry receiver are directly connected through Ethernet1/10 and ens192.
Nexus-to-Receiver Connectivity
Ethernet1/10 provides Layer 3 connectivity between the Nexus switch and the Ubuntu receiver.
The interface configuration is:
N9K-TELEMETRY-SW1# show running-config interface ethernet1/10 interface Ethernet1/10 description TELEMETRY-COLLECTOR ip address 192.168.100.1/24 no shutdown
The Ubuntu receiver uses: Interface: ens192 IP address: 192.168.100.10/24
Background Information
Network monitoring and visibility are fundamental for understanding network health, identifying abnormal behavior, and troubleshooting network issues.
Cisco NX-OS provides several mechanisms to retrieve or export operational information from a Nexus switch, including the CLI, Simple Network Management Protocol (SNMP), and Syslog. Traditional monitoring workflows such as SNMP polling and CLI-based collection commonly rely on a pull model, in which an external monitoring system periodically requests information from the network device.
Streaming Telemetry introduces a push model, where the network device sends selected operational data toward an external receiver based on configured subscriptions. This provides a structured mechanism for collecting network information without requiring the monitoring system to continuously poll the device.
Traditional Polling Versus Streaming Telemetry
In a traditional polling model, the monitoring system determines when information is retrieved from the network device.
For example, a network management system (NMS) can request interface statistics every 60 seconds. This provides periodic snapshots of the device state; however, the visibility available to the monitoring application is directly related to the configured polling interval.
With Streaming Telemetry, the Nexus switch sends selected information toward the telemetry receiver according to the configured subscription.
The fundamental differences can be summarized as follows:
| Traditional Polling | Streaming Telemetry |
|---|---|
| Client initiates the request. | Network device sends the data. |
| Pull model | Push model |
| Data is retrieved according to polling intervals. | Data is sent according to a telemetry subscription. |
| Typically provides periodic snapshots. | Supports periodic and event-based collection. |
| Monitoring system requests information from the device. | Device streams selected information toward a receiver. |
Streaming Telemetry does not necessarily replace traditional monitoring mechanisms. CLI, SNMP, Syslog, and Telemetry can coexist and serve different operational purposes.
The primary difference is the data collection model.
Real-World Use Cases
In production environments, Streaming Telemetry is commonly used to provide continuous visibility into network and system health.
Typical use cases include monitoring interface counters and status changes, system resources such as CPU and memory utilization, and data center fabric information such as Virtual Extensible LAN (VXLAN) peers and Border Gateway Protocol (BGP) peer state. Event-based telemetry can also be used to report operational state changes as the changes occur.
The exported telemetry data can then be consumed by external monitoring and observability platforms for dashboards, alerting, historical analysis, and troubleshooting.
Telemetry Processing Overview
At a high level, Streaming Telemetry on NX-OS can be understood as four main stages:
+-----------------------+

|   Data Collection     |

+-----------+-----------+

            |

            v

+-----------------------+

|    Data Encoding      |

+-----------+-----------+

            |

            v

+-----------------------+

|    Data Transport     |

+-----------+-----------+

            |

            v

+-----------------------+

| Telemetry Receiver    |

+-----------------------+
These stages answer four basic questions:
- Data Collection: What information is collected?
- Data Encoding: How is the information represented?
- Data Transport: How is the telemetry data delivered?
- Telemetry Receiver: Where is the telemetry data sent?
Telemetry Architecture and Terminology
Data Collection
The first stage determines what information must be collected from the switch.
For the examples in this document, telemetry data is collected from the Data Management Engine (DME).
Data Management Engine — DME
The Data Management Engine maintains a structured representation of configuration and operational information within NX-OS.
Instead of representing device information only as CLI text, DME organizes information as managed objects that can be accessed through hierarchical paths.
For example:
sys/intf/phys-[eth1/10]
Identifies the DME object associated with Ethernet1/10.
Other DME paths used in this lab include:
sys/intf/phys-[eth1/10]/dbgIfIn
sys/intf/phys-[eth1/10]/dbgIfOut
sys/intf/phys-[eth1/10]/phys
sys/intf/lb-[lo100]
Each path represents a different object or portion of the information available through DME. These are the same paths already used throughout the lab configuration.
Managed Objects and the Management Information Tree
The DME database is composed of Managed Objects (MOs).
A Managed Object represents an entity within the NX-OS management model, such as:
- A physical interface
- A loopback interface
- Interface input statistics
- Interface output statistics
Managed Objects are organized hierarchically in a Management Information Tree (MIT).
A simplified representation of the objects used in this lab is:
sys
|
+-- intf
|
+-- phys-[eth1/10]
| |
| +-- dbgIfIn
| +-- dbgIfOut
| +-- phys
|
+-- lb-[lo100]
This hierarchy is useful for understanding how telemetry sensor paths identify specific information within DME.
Distinguished Name — DN
Each Managed Object can be uniquely identified by a Distinguished Name (DN).
The DN represents the hierarchical path from the root of the DME tree to the target object.
For example: sys/intf/lb-[lo100]
Identifies the Loopback100 Managed Object.
Similarly:
sys/intf/phys-[eth1/10]/dbgIfIn
Identifies the input statistics object associated with Ethernet1/10.
A simple way to understand a DN is to think of it as the complete address of an object inside the DME hierarchy.
Sensor Path
A sensor path identifies the information that NX-OS must monitor for a telemetry subscription.
In the initial lab examples, DME Distinguished Names are used as sensor paths. A later practical example demonstrates the predefined resources path label.
For example:
sensor-group 2
path sys/intf/phys-[eth1/10]/dbgIfIn
path sys/intf/phys-[eth1/10]/dbgIfOut
path sys/intf/phys-[eth1/10]/phys
These paths provide input statistics, output statistics, and operational information for Ethernet1/10.
Data Encoding
After NX-OS collects the requested information, the data must be encoded before it can be transmitted.
The encoding used in this lab is Google Protocol Buffers (GPB).
The destination configuration specifies:
ip address 192.168.100.10 port 57000 protocol gRPC encoding GPB
GPB defines how the collected telemetry information is represented in the message.
Encoding and transport are separate functions: GPB defines the data representation, while the transport mechanism determines how the message is delivered.
Data Transport
The transport protocol used in this lab is gRPC.
The Nexus switch sends the GPB-encoded telemetry data to:
192.168.100.10:57000
using gRPC.
Therefore:
GPB defines how the telemetry information is encoded.
gRPC provides the transport mechanism used to deliver the telemetry messages to the receiver.
The gRPC transport used by Streaming Telemetry must not be confused with the NX-OS gRPC Agent used for services such as gRPC Network Management Interface (gNMI) and gRPC Network Operations Interface (gNOI).
Telemetry Receiver
The Telemetry Receiver is the external system or application that receives and processes the telemetry stream.
In this lab, an Ubuntu server running Telegraf is used as the receiver. The receiver listens on TCP port 57000 and accepts the GPB-over-gRPC telemetry stream generated by the Nexus switch.
The receiver implementation used in the lab is described later in the Prepare the Telemetry Receiver section.
Destination Group
The destination group defines where telemetry data must be sent and how it must be transported.
The lab uses:
destination-group 1
ip address 192.168.100.10 port 57000 protocol gRPC encoding GPB
use-vrf default
This defines the receiver address, destination port, transport protocol, encoding, and Virtual Routing and Forwarding (VRF) instance used for telemetry delivery.
Sensor Group
The sensor group defines what information must be monitored.
For example:
sensor-group 2
path sys/intf/phys-[eth1/10]/dbgIfIn
path sys/intf/phys-[eth1/10]/dbgIfOut
path sys/intf/phys-[eth1/10]/phys
In this example, Sensor Group 2 monitors Ethernet1/10 input statistics, output statistics, and operational interface information. The dbgIfIn path provides input interface statistics, dbgIfOut provides output interface statistics, and phys provides operational information for the interface.
A sensor group can include multiple related sensor paths and therefore answers the question:
What data is collected?
Subscription
A subscription associates a sensor group with a destination group and defines the collection behavior.
For example:
subscription 2
dst-grp 1
snsr-grp 2 sample-interval 60000
In this example:
- Sensor Group 2 determines what information is collected.
- The sample interval determines the collection behavior.
- Destination Group 1 determines where and how the information is sent.
The subscription therefore connects the main telemetry configuration elements:
Sensor Group + Collection Behavior + Destination Group
Periodic and Event-Based Telemetry
Cisco NX-OS Streaming Telemetry supports periodic and event-based collection for DME-based subscriptions.
The collection behavior is controlled by the sample-interval associated with the sensor group inside a subscription.
Periodic Telemetry
With periodic telemetry, NX-OS collects and sends the monitored information at a configured interval.
The sampling interval is specified in milliseconds.
For example: snsr-grp 2 sample-interval 60000
Configures a 60-second collection interval.
Periodic telemetry is useful for information that changes continuously and is typically analyzed over time, such as:
- Interface packet counters
- Byte counters
- Errors and discards
- Operational statistics
- Resource utilization
In this lab, Subscription 1 and Subscription 2 use periodic collection.
Subscription 1 collects the Ethernet1/10 interface object every 10 seconds, while Subscription 2 collects interface statistics and operational information every 60 seconds.
Event-Based Telemetry
With event-based telemetry, NX-OS does not use a recurring collection timer.
For DME-based telemetry, event-based behavior is configured with:
sample-interval 0
When a monitored object changes, telemetry can generate an update associated with that change.
This collection method is useful for information such as:
- Configuration changes
- Administrative state changes
- Object creation or deletion
- Other changes under a monitored DME object
In this lab, Subscription 3 monitors the Loopback100 DME object:
sys/intf/lb-[lo100]:
snsr-grp 3 sample-interval 0
Changes to the monitored Loopback100 object are therefore used later in this document to demonstrate event-based telemetry.
Collection Behavior Used in the Lab
The three subscriptions used in the initial lab configuration can be summarized as follows:
| Subscription | Monitored Information | Sample Interval | Collection Behavior |
|---|---|---|---|
| 1 | Ethernet1/10 interface object | 10000 ms | Periodic |
| 2 | Ethernet1/10 statistics and operational state | 60000 ms | Periodic |
| 3 | Loopback100 object | 0 | Event-based |
The primary distinction is the trigger used to generate telemetry data:
| Periodic Telemetry | Event-Based Telemetry |
|---|---|
| Uses a configured timer. | Does not use a periodic timer. |
| sample-interval > 0 | sample-interval 0 |
| Produces repeated samples. | Produces updates when monitored objects change. |
| Commonly used for counters and statistics. | Commonly used for configuration or state changes. |
The configuration and verification sections demonstrate both collection behaviors using the subscriptions defined above.
Prepare the Telemetry Receiver
Streaming Telemetry requires an external receiver capable of accepting and processing the telemetry data sent by the Nexus switch.
For the GPB-over-gRPC transport used in this document, the receiver must be capable of:
- Receiving gRPC connections
- Listening on the configured destination port
- Decoding GPB telemetry messages
- Processing or storing the received data
The implementation of the telemetry receiver is independent from the NX-OS telemetry configuration described in this document.

Note: Installation, configuration, operation, and troubleshooting of third-party telemetry receiver software are outside the scope of this document. Refer to the documentation provided by the receiver vendor for configuration and support information.
Receiver Used in This Lab
For demonstration purposes, the lab uses an external Ubuntu server running Telegraf as the telemetry receiver.
The receiver parameters are:
| Parameter | Value |
|---|---|
| Receiver Address | 192.168.100.10 |
| Transport | gRPC |
| Listening Port | TCP/57000 |
| Encoding | GPB |
The receiver-side software configuration is not covered in this document.
Note: Receiver output examples shown in this document are filtered to highlight the fields relevant to each verification step.
Before configuring Streaming Telemetry on the Nexus switch, verify that:
- IP connectivity exists between the Nexus switch and the receiver.
- The receiver application is running.
- The configured destination port is listening.
- The receiver supports the configured transport protocol.
- The receiver supports the configured telemetry encoding.
For this lab, Ethernet1/10 on the Nexus switch uses 192.168.100.1/24 and the telemetry receiver uses 192.168.100.10/24. Basic Layer 3 reachability must be confirmed before troubleshooting telemetry-specific behavior.
Once the receiver is reachable and ready to accept GPB-over-gRPC telemetry on TCP port 57000, the NX-OS telemetry configuration can be applied.
Configure Streaming Telemetry on NX-OS
The configuration uses three primary components:
- Destination Group: Defines where the telemetry data is sent and how it is transported.
- Sensor Group: Defines what information is collected.
- Subscription: Associates a sensor group with a destination group and defines the collection behavior.
The lab uses this telemetry destination:
| Parameter | Value |
|---|---|
| Destination | 192.168.100.10:57000 |
| Transport | gRPC |
| Encoding | GPB |
| VRF | default |
The initial lab configuration uses three subscriptions:
| Subscription | Sensor | Collection Type | Sample Interval |
|---|---|---|---|
| 1 | Ethernet1/10 interface object | Periodic | 10000 ms |
| 2 | Ethernet1/10 statistics and operational state | Periodic | 60000 ms |
| 3 | Loopback100 object | Event-based | 0 |
Enable the Telemetry Feature
Streaming Telemetry must first be enabled globally.
N9K-TELEMETRY-SW1# configure terminal
N9K-TELEMETRY-SW1(config)# feature telemetry
Enter telemetry configuration mode:
N9K-TELEMETRY-SW1(config)# telemetry
N9K-TELEMETRY-SW1(config-telemetry)#
The remaining telemetry configuration is performed under this mode.
Configure the Destination Group
The destination group identifies the external telemetry receiver and defines the transport and encoding used to send telemetry data.
Configure:
N9K-TELEMETRY-SW1(config-telemetry)# destination-group 1
N9K-TELEMETRY-SW1(conf-tm-dest)# ip address 192.168.100.10 port 57000 protocol gRPC encoding GPB
N9K-TELEMETRY-SW1(conf-tm-dest)# use-vrf default
This configuration defines:
- Destination address: 192.168.100.10
- Destination port: 57000
- Transport: gRPC
- Encoding: GPB
- VRF: default
The default VRF is used because the telemetry receiver is reachable through Ethernet1/10 in the default VRF.
The VRF selected for telemetry transport must provide IP reachability to the configured receiver.
Configure Sensor Group 1
Sensor Group 1 monitors the Ethernet1/10 DME interface object.
N9K-TELEMETRY-SW1(config-telemetry)# sensor-group 1
N9K-TELEMETRY-SW1(conf-tm-sensor)# path sys/intf/phys-[eth1/10]
The sensor path identifies the Ethernet1/10 Managed Object in the DME hierarchy and provides general interface information associated with that object.
Configure Subscription 1
Associate Sensor Group 1 with Destination Group 1:
N9K-TELEMETRY-SW1(config-telemetry)# subscription 1
N9K-TELEMETRY-SW1(conf-tm-sub)# dst-grp 1
N9K-TELEMETRY-SW1(conf-tm-sub)# snsr-grp 1 sample-interval 10000
The sampling interval is specified in milliseconds.
10000 ms = 10 seconds
Subscription 1 therefore periodically collects the Ethernet1/10 DME object every 10 seconds and sends the telemetry data to Destination Group 1.
Configure Sensor Group 2
Sensor Group 2 collects statistics and operational information for Ethernet1/10.
Configure:
N9K-TELEMETRY-SW1(config-telemetry)# sensor-group 2
N9K-TELEMETRY-SW1(conf-tm-sensor)# path sys/intf/phys-[eth1/10]/dbgIfIn
N9K-TELEMETRY-SW1(conf-tm-sensor)# path sys/intf/phys-[eth1/10]/dbgIfOut
N9K-TELEMETRY-SW1(conf-tm-sensor)# path sys/intf/phys-[eth1/10]/phys
The sensor paths provide:
| Sensor Path | Information |
|---|---|
| sys/intf/phys-[eth1/10]/dbgIfIn | Input interface statistics |
| sys/intf/phys-[eth1/10]/dbgIfOut | Output interface statistics |
| sys/intf/phys-[eth1/10]/phys | Operational interface information |
A sensor group can contain multiple related sensor paths, allowing the subscription to collect several categories of information from the same monitored interface.
Configure Subscription 2
Associate Sensor Group 2 with Destination Group 1:
N9K-TELEMETRY-SW1(config-telemetry)# subscription 2
N9K-TELEMETRY-SW1(conf-tm-sub)# dst-grp 1
N9K-TELEMETRY-SW1(conf-tm-sub)# snsr-grp 2 sample-interval 60000
The configured sampling interval is:
60000 ms = 60 seconds
Subscription 2 therefore collects the Ethernet1/10 statistics and operational information every 60 seconds.
This subscription is used later in the document to verify periodic telemetry behavior.
Configure the Loopback Interface
A loopback interface is used to demonstrate event-based telemetry without requiring an additional physical connection.
Configure:
N9K-TELEMETRY-SW1(config)# interface loopback100
N9K-TELEMETRY-SW1(config-if)# ip address 10.255.255.100/32
The corresponding DME object is:
sys/intf/lb-[lo100]
The loopback interface provides a simple way to generate controlled configuration and administrative state changes during the event-based telemetry verification.
Configure Sensor Group 3
Configure the Loopback100 DME sensor path:
N9K-TELEMETRY-SW1(config-telemetry)# sensor-group 3
N9K-TELEMETRY-SW1(conf-tm-sensor)# path sys/intf/lb-[lo100]
Sensor Group 3 monitors the Loopback100 Managed Object.
Configure Subscription 3
Associate Sensor Group 3 with Destination Group 1 and configure event-based collection:
N9K-TELEMETRY-SW1(config-telemetry)# subscription 3
N9K-TELEMETRY-SW1(conf-tm-sub)# dst-grp 1
N9K-TELEMETRY-SW1(conf-tm-sub)# snsr-grp 3 sample-interval 0
For DME-based subscriptions, a sample interval of zero configures event-based behavior.
Changes under the monitored Loopback100 object can therefore generate telemetry notifications without using a recurring collection timer.
This subscription is used later to demonstrate description and administrative state changes.
Complete Initial Telemetry Configuration
After the configuration is complete, verify it with:
N9K-TELEMETRY-SW1# show running-config telemetry
feature telemetry
telemetry
  destination-group 1
    ip address 192.168.100.10 port 57000 protocol gRPC encoding GPB
    use-vrf default
  sensor-group 1
    path sys/intf/phys-[eth1/10]
  sensor-group 2
    path sys/intf/phys-[eth1/10]/dbgIfIn
    path sys/intf/phys-[eth1/10]/dbgIfOut
    path sys/intf/phys-[eth1/10]/phys
  sensor-group 3
    path sys/intf/lb-[lo100]
  subscription 1
    dst-grp 1
    snsr-grp 1 sample-interval 10000
  subscription 2
    dst-grp 1
    snsr-grp 2 sample-interval 60000
  subscription 3
    dst-grp 1
    snsr-grp 3 sample-interval 0
At this point, the switch has the destination, sensor groups, and subscriptions required to begin sending telemetry data toward the configured receiver.
The next section verifies the transport session and periodic telemetry generated by the Ethernet1/10 subscriptions.
Verify Periodic Telemetry
After the telemetry configuration is applied, verify that the transport session is established, the periodic sensor groups are active, and telemetry data is being collected and delivered to the receiver.
Verify the Telemetry Transport
Run this command:
N9K-TELEMETRY-SW1# show telemetry transport
Session Id  Dst Grp  IP Address      Port       Encoding     Transport  Status
--------------------------------------------------------------------------------
0           1        192.168.100.10  57000      GPB          gRPC       Connected
--------------------------------------------------------------------------------
Retry buffer Size:             10485760
Event Retry Messages (Bytes):  0
Timer Retry Messages (Bytes):  0
Total Retries sent:            0
Total Retries Dropped:         0
N9K-TELEMETRY-SW1#
The Connected state confirms that the gRPC transport session to the configured telemetry receiver is established.
The relevant transport parameters also match the configured Destination Group.
Verify the Periodic Sensor Groups
Use:
N9K-TELEMETRY-SW1# show telemetry control database

Subscription Database size = 3
--------------------------------------------------------------------------------
Subscription ID      Data Collector Type  Reachability  Configuration Method
--------------------------------------------------------------------------------
3                    DME                  Reachable     CONFIG_DME-ADMIN
2                    DME                  Reachable     CONFIG_DME-ADMIN
1                    DME                  Reachable     CONFIG_DME-ADMIN

Sensor Group Database size = 3
----------------------------------------------------------------------------------------------------
Row ID     Sensor Group ID  Sensor Group type  Sampling interval(ms)  Linked subscriptions  SubID
----------------------------------------------------------------------------------------------------
1          3                Event   /DME                0/No Timer     1                     3
Collection Time in ms (Cur/Min/Max): 0/0/0
Encoding Time in ms (Cur/Min/Max): 0/0/0
Transport Time in ms (Cur/Min/Max): 2/1/414
Streaming Time in ms (Cur/Min/Max): 2/1/414

Collection Statistics:
  collection_id_dropped      = 0
  last_collection_id_dropped = 0
  drop_count                 = 0

Configuration method: CONFIG_DME-ADMIN

2          2                Timer   /DME            60000/Running      1                     2
Collection Time in ms (Cur/Min/Max): 0/0/1
Encoding Time in ms (Cur/Min/Max): 0/0/1
Transport Time in ms (Cur/Min/Max): 2/1/415
Streaming Time in ms (Cur/Min/Max): 3/2/416

Collection Statistics:
  collection_id_dropped      = 0
  last_collection_id_dropped = 0
  drop_count                 = 0

Configuration method: CONFIG_DME-ADMIN

3          1                Timer   /DME            10000/Running      1                     1
Collection Time in ms (Cur/Min/Max): 0/0/1
Encoding Time in ms (Cur/Min/Max): 0/0/1
Transport Time in ms (Cur/Min/Max): 2/1/415
Streaming Time in ms (Cur/Min/Max): 3/2/417

Collection Statistics:
  collection_id_dropped      = 0
  last_collection_id_dropped = 0
  drop_count                 = 0

Configuration method: CONFIG_DME-ADMIN

----------------------------------------------------------------------------------------------------
Row ID     Subscribed Linked Groups  Sec Groups  Retrieve level  Path(GroupId) : Query : Filter
----------------------------------------------------------------------------------------------------
1          No         1              0           Self            sys/intf/phys-[eth1/10](1) : NA : NA
<snip>
2          No         1              0           Self            sys/intf/phys-[eth1/10]/dbgIfIn(2) : NA : NA
<snip>
4          No         1              0           Self            sys/intf/phys-[eth1/10]/dbgIfOut(2) : NA : NA
The Sensor Group Database confirms that the periodic sensor groups are active:
| Sensor Group | Type | Sampling Interval | Subscription |
|---|---|---|---|
| 1 | Timer / DME | 10000 ms / Running | 1 |
| 2 | Timer / DME | 60000 ms / Running | 2 |
Sensor Group 1 collects the Ethernet1/10 interface object every 10 seconds.
Sensor Group 2 collects Ethernet1/10 statistics and operational information every 60 seconds.
The same command also displays the configured sensor paths:
sys/intf/phys-[eth1/10]
sys/intf/phys-[eth1/10]/dbgIfIn
sys/intf/phys-[eth1/10]/dbgIfOut
sys/intf/phys-[eth1/10]/phys
For the sensor paths used in this lab, collection and encoding times were typically between 0 and 1 ms, and no telemetry message drops were observed.
Verify Data Collection
Use:
N9K-TELEMETRY-SW1# show telemetry data collector brief
-------------------------------------------------------------------------------------------------------------------
Row ID         Collector Type       Successful        Payloads          Failed            Skipped           Dropped
-------------------------------------------------------------------------------------------------------------------
1              YANG                 0                 0                 0                 0                 0
2              DME                  513               513               0                 44                0
3              NX-API               0                 0                 0                 0                 0
N9K-TELEMETRY-SW1#
The lab reported:
DME Successful Collections: 513 Payloads: 513 Failed: 0 Skipped: 44 Dropped: 0
The Successful and Payload counters confirm that DME telemetry data is being collected and telemetry payloads are being generated.
The 44 skipped collections are historical counters observed while the telemetry destination was temporarily unavailable during the lab. These counters are examined later in the Basic Troubleshooting section.
For additional per-sensor-path information, use:
N9K-TELEMETRY-SW1# show telemetry data collector details
This command can identify which configured sensor paths contributed to successful, failed, skipped, or dropped collections.
Verify Periodic Data at the Receiver
Subscription 2 collects Ethernet1/10 statistics every 60 seconds.
The telemetry receiver reported these input statistics at 21:44:45 Coordinated Universal Time (UTC):
timestamp: 2026-09-17T21:44:45Z
source: N9K-TELEMETRY-SW1
subscription: 2
path: sys/intf/phys-[eth1/10]/dbgIfIn

broadcastPkts: 5074
discards: 0
errors: 0
multicastPkts: 143403
octets: 12870535
ucastPkts: 31256
One minute later, another sample was received:
timestamp: 2026-09-17T21:45:45Z
source: N9K-TELEMETRY-SW1
subscription: 2
path: sys/intf/phys-[eth1/10]/dbgIfIn

broadcastPkts: 5075
discards: 0
errors: 0
multicastPkts: 143430
octets: 12875428
ucastPkts: 31292
The counter changes between both samples are summarized below:
| Counter | 21:44:45 | 21:45:45 |
|---|---|---|
| Unicast packets | 31,256 | 31,292 |
| Multicast packets | 143,403 | 143,430 |
| Broadcast packets | 5,074 | 5,075 |
| Octets | 12,870,535 | 12,875,428 |
| Errors | 0 | 0 |
| Discards | 0 | 0 |
The timestamps are separated by approximately 60 seconds, matching the sampling interval configured for Subscription 2.
The increasing packet and byte counters also confirm that updated interface statistics are being collected and delivered to the receiver.
Verify Output and Operational Information
The dbgIfOut sensor path provides output statistics for Ethernet1/10.
A sample collected at 21:45:45 UTC reported:
broadcastPkts: 8
discards: 0
errors: 0
multicastPkts: 4712
octets: 2444721
ucastPkts: 4092
The phys sensor path provides operational attributes for the same interface.
The receiver reported:
adminSt: up
operSt: up
operSpeed: 1G
operDuplex: full
operMtu: 1500
operDescr: TELEMETRY-COLLECTOR
These samples confirm that Sensor Group 2 provides both interface statistics and operational information through its three configured DME sensor paths.
Periodic Telemetry Verification Summary
The periodic telemetry verification confirms:
| Verification | Result |
|---|---|
| gRPC transport session | Connected |
| GPB encoding | Confirmed |
| Sensor Group 1 | Running at 10000 ms |
| Sensor Group 2 | Running at 60000 ms |
| DME collections | Successful |
| Failed collections | 0 |
| Dropped payloads | 0 |
| Periodic receiver samples | Received |
| Interface counters | Updating between samples |
Verify Event-Based Telemetry
After verifying periodic telemetry, use Subscription 3 to validate event-based telemetry by generating controlled changes to the Loopback100 Managed Object.
Verify the Event-Based Subscription
Use:
N9K-TELEMETRY-SW1# show telemetry control database

Subscription Database size = 3


--------------------------------------------------------------------------------


Subscription ID      Data Collector Type  Reachability  Configuration Method
--------------------------------------------------------------------------------
3                    DME                  Reachable     CONFIG_DME-ADMIN
2                    DME                  Reachable     CONFIG_DME-ADMIN
1                    DME                  Reachable     CONFIG_DME-ADMIN

<snip>

Sensor Group Database size = 3

----------------------------------------------------------------------------------------------------
Row ID     Sensor Group ID  Sensor Group type  Sampling interval(ms)  Linked subscriptions  SubID
----------------------------------------------------------------------------------------------------

1          3                Event /DME          0/No Timer             1                     3

<snip>

Sensor Path Database size = 5

----------------------------------------------------------------------------------------------------
Row ID     Subscribed  Linked Groups  Sec Groups  Retrieve level  Path(GroupId) : Query : Filter
----------------------------------------------------------------------------------------------------
4          Yes         1              0           Self            sys/intf/lb-[lo100](3) : NA : NA

<snip>

Subscription Id: 3

Snapshot Stats:

    Sent                = 1
    Error               = 0
    Drops               = 0

The Sensor Group Database reports:

Sensor Group ID: 3
Sensor Group Type: Event / DME
Sampling Interval: 0 / No Timer
Subscription ID: 3

The Event / DME type and 0 / No Timer state confirm that Sensor Group 3 is configured for event-based collection.
The associated sensor path is:
sys/intf/lb-[lo100]
The same telemetry database confirms that the sensor path is subscribed through Subscription 3.
Generate Event-Based Updates
In order to verify event generation, modify the Loopback100 description:
N9K-TELEMETRY-SW1(config)# interface loopback100
N9K-TELEMETRY-SW1(config-if)# description TELEMETRY-EVENT-DEMO
The telemetry receiver reported:
{
"timestamp": "2026-09-17T21:41:12Z",
"source": "N9K-TELEMETRY-SW1",
"subscription": "3",
"event": {
"descr": "TELEMETRY-EVENT-DEMO",
"dn": "sys/intf/lb-[lo100]",
"status": "modified"
}
}
The dn identifies the monitored DME object and the descr attribute identifies the property that changed.
Next, administratively disable and restore the interface:
N9K-TELEMETRY-SW1(config)# interface loopback100
N9K-TELEMETRY-SW1(config-if)# shutdown
Then:
N9K-TELEMETRY-SW1(config-if)# no shutdown
The receiver detected both state changes.
| Timestamp | Changed Attribute | Value |
|---|---|---|
| 21:41:12 | descr | TELEMETRY-EVENT-DEMO |
| 21:41:19 | adminSt | down |
| 21:41:24 | adminSt | up |
Each update referenced the same monitored object:
sys/intf/lb-[lo100]
It reported the object status as modified.
These results confirm that changes to different attributes of the monitored Managed Object can generate individual telemetry updates.
Verify the Initial Snapshot and Event Messages
When the event-based subscription was established, NX-OS generated an initial snapshot of the monitored object.
The Sensor Path Database reported:
Snapshot Stats:
Sent = 1 Error = 0 Drops = 0
After the three controlled changes, the same sensor path reported:
Message Stats:
Sent = 3 Error = 0 Drops = 0
The results can therefore be summarized as:
| Collection | Count |
|---|---|
| Initial snapshot | 1 |
| Description modification | 1 |
| Administrative state down | 1 |
| Administrative state up | 1 |
| Total | 4 |
The initial snapshot represents the state of the monitored object when the subscription becomes active, while the subsequent messages correspond to object changes.
Verify Event Collection Statistics
N9K-TELEMETRY-SW1# show telemetry event collector stats
--------------------------------------------------------------------------------
Row ID         Collection Count  Latest Collection Time     Sensor Path(GroupId)
--------------------------------------------------------------------------------
1              4                 Thu Sep 17 21:41:24.045 UTC sys/intf/lb-[lo100](3)
N9K-TELEMETRY-SW1#
The lab reported:
Collection Count: 4
Latest Collection Time: Thu Sep 17 21:41:24.045 UTC
Sensor Path: sys/intf/lb-[lo100]
The collection count matches the one initial snapshot and the three changes generated during the test.
Verify Event Collector Errors
N9K-TELEMETRY-SW1# show telemetry event collector errors

--------------------------------------------------------------------------------
Error Description                                  Error Count
--------------------------------------------------------------------------------
Dme Event Subscription Init Failures               - 0
Event Data Enqueue Failures                        - 0
Event Subscription Failures                        - 0
Pending Subscription List Create Failures          - 0
Subscription Hash Table Create Failures            - 0
Subscription Hash Table Destroy Failures           - 0
Subscription Hash Table Insert Failures            - 0
Subscription Hash Table Remove Failures            - 0
N9K-TELEMETRY-SW1#
No event collector errors were observed during the test.
Event-Based Telemetry Verification Summary
The event-based telemetry verification confirms:
| Verification | Result |
|---|---|
| Sensor Group | 3 |
| Sensor Path | sys/intf/lb-[lo100] |
| Collection Type | Event / DME |
| Sampling Interval | 0 / No Timer |
| Initial Snapshot | Sent |
| Description Change | Detected |
| adminSt Down | Detected |
| adminSt Up | Detected |
| Total Collections | 4 |
| Event Collector Errors | 0 |
The successful detection of the controlled Loopback100 changes confirms that Subscription 3 is operating as expected.
The next section examines the primary verification and troubleshooting commands used to evaluate Streaming Telemetry operation.
Basic Troubleshooting
When telemetry data is not received as expected, begin troubleshooting by determining whether the issue is related to the transport session, data collection, sensor configuration, or the external receiver.
This workflow uses an issue observed during this lab, where NX-OS reported 44 skipped collections and one historical gRPC transmission error.
Verify the Current Transport State
N9K-TELEMETRY-SW1# show telemetry transport
Session Id  Dst Grp  IP Address      Port       Encoding     Transport  Status
--------------------------------------------------------------------------------
0           1        192.168.100.10  57000      GPB          gRPC       Connected


--------------------------------------------------------------------------------
Retry buffer Size:                      10485760
Event Retry Messages (Bytes):  0
Timer Retry Messages (Bytes):  0
Total Retries sent:                     0
Total Retries Dropped:              0

N9K-TELEMETRY-SW1#
During the final verification, the telemetry session reported:
Session ID: 0
Destination Group: 1
IP Address: 192.168.100.10
Port: 57000
Encoding: GPB
Transport: gRPC
Status: Connected
A Connected state confirms that the transport session is currently established.
However, the current session state does not necessarily indicate whether connectivity problems occurred earlier. Therefore, review the historical collection and transport counters as well.
Review Data Collection Counters
N9K-TELEMETRY-SW1# show telemetry data collector brief
-------------------------------------------------------------------------------------------------------------------
Row ID         Collector Type       Successful        Payloads          Failed            Skipped           Dropped
-------------------------------------------------------------------------------------------------------------------
1              YANG                 0                 0                 0                 0                 0
2              DME                  513               513               0                 44                0
3              NX-API               0                 0                 0                 0                 0

N9K-TELEMETRY-SW1#
The lab reported:
DME Successful Collections: 513
Payloads: 513
Failed: 0
Skipped: 44
Dropped: 0
The Successful and Payload counters confirm that DME telemetry collections and payload generation have occurred.
However, the Skipped counter indicates that 44 scheduled collections were not performed.
In order to identify which sensor paths were affected, use:
N9K-TELEMETRY-SW1# show telemetry data collector details
--------------------------------------------------------------------------------------------------------------
Row ID         Successful     Payloads       Failed         Skipped        Dropped        Sensor Path(GroupId)
--------------------------------------------------------------------------------------------------------------
1              414            414            0              29             0              sys/intf/phys-[eth1/10](1)
2              54             54             0              5              0              sys/intf/phys-[eth1/10]/dbgIfIn(2)
3              54             54             0              5              0              sys/intf/phys-[eth1/10]/dbgIfOut(2)

4              54             54             0              5              0              sys/intf/phys-[eth1/10]/phys(2)

N9K-TELEMETRY-SW1#
The detailed output reported:
| Sensor Path | Skipped |
|---|---|
| sys/intf/phys-[eth1/10] | 29 |
| sys/intf/phys-[eth1/10]/dbgIfIn | 5 |
| sys/intf/phys-[eth1/10]/dbgIfOut | 5 |
| sys/intf/phys-[eth1/10]/phys | 5 |
| Total | 44 |
The skipped collections were distributed across the periodic sensor paths, indicating that the issue was not isolated to a single DME object.
Note: Collection counters are cumulative. A non-zero historical counter does not necessarily indicate that the same condition is currently present.
Determine Why Collections Were Skipped
N9K-TELEMETRY-SW1# show telemetry control stats
--------------------------------------------------------------------------------
Error Description                                            Error Count
--------------------------------------------------------------------------------
<snip>
Collections skipped due to destination unreachable           44
<snip>
N9K-TELEMETRY-SW1#
This output directly identifies the reason for the skipped collections:
Destination unreachable = 44
The value matches the 44 skipped collections reported by the DME data collector.
This allows the investigation to move away from the sensor paths themselves and toward the telemetry destination and transport path.
Inspect Transport Errors
Use the session ID reported by show telemetry transport:
N9K-TELEMETRY-SW1# show telemetry transport 0 errors
Session Id:                    0
Connection Errors
   Connection Error Count:     0
Transmission Errors
   Tx Error Count:             1
   Last Tx Error:              Thu Sep 17 21:22:16.008 UTC
   Last Tx Return Code:        UNAVAILABLE
N9K-TELEMETRY-SW1#
The lab reported:
Connection Error Count: 0
Tx Error Count: 1
Last Tx Error: Thu Sep 17 21:22:16.008 UTC
Last Tx Return Code: UNAVAILABLE
The UNAVAILABLE return code records a gRPC transmission failure associated with the telemetry destination.
In this lab, the external receiver was intentionally stopped and restarted while its configuration was being modified. During that interval, NX-OS could not reach the telemetry destination, which corresponds with the destination-unreachable collection counters observed above.
The important correlation is:
| Observation | Result |
|---|---|
| Skipped collections | 44 |
| Destination unreachable | 44 |
| Transport Tx errors | 1 |
| Last Tx return code | UNAVAILABLE |
| Current transport state | Connected |
The matching skipped and destination-unreachable counters provide direct evidence for why the collections were skipped.
The historical transport error provides additional information about the transport failure observed during the same lab activity.
Verify Transport Recovery
After connectivity to the receiver is restored, use:
N9K-TELEMETRY-SW1# show telemetry transport 0 stats
Session Id:                    0
Connection Stats
   Connection Count            3
   Last Connected:             Thu Sep 17 21:27:16.010 UTC
   Disconnect Count            0
   Last Disconnected:          Never
Transmission Stats
   Compression:                disabled
   Source Interface:           not set()
   Transmit Count:             603
   Last TX time:               Thu Sep 17 21:51:36.008 UTC
   Min Tx Time:                1                   ms
   Max Tx Time:                414                 ms
   Avg Tx Time:                6                   ms
   Cur Tx Time:                1                   ms

Flow Stats
   Allowed Queued Msgs Size (bytes):     78643200
   Current Queued Msgs Size (bytes):     0
   Utilization (percent):                0
   Max Queued Msgs Size (bytes):         3849
   Total Queued Msgs Size (bytes):       865313
   Current Msgs Held (# Msgs):           0
   Total Msgs held (# Msgs):             604
   Max Msgs Held (# Msgs):               5
   Msgs Dropped (# Msgs):                0
   Flow Control Apply Time (secs):       0
   Flow Control Last Applied:            Never
<snip>
N9K-TELEMETRY-SW1#
The final lab verification reported:
Connection Count: 3
Disconnect Count: 0
Transmit Count: 603
Average Transmission Time: 6 ms
Current Transmission Time: 1 ms
Current Queued Messages Size: 0
Transport Utilization: 0%
Messages Dropped: 0
Flow Control Last Applied: Never
These values show that the transport session recovered and was actively transmitting telemetry data without queued or dropped messages.
The most important current-state indicators were:
| Indicator | Result |
|---|---|
| Transport Status | Connected |
| Current Queue | 0 |
| Messages Dropped | 0 |
| Flow Control | Never Applied |
This distinction is important when troubleshooting telemetry counters: historical errors can remain visible even after the underlying condition has been resolved.
Check Configuration and Event Collector Errors
Additional commands can be used to verify whether NX-OS reports configuration or event-processing problems.
N9K-TELEMETRY-SW1# show telemetry config errors
--------------------------------------------------------------------------------
Row ID         Path                           Sensor Group    Error
--------------------------------------------------------------------------------
Transport Errors
--------------------------------------------------------------------------------
Destination group ID           Source Interface               Configured VRF  Correct VRF
--------------------------------------------------------------------------------
N9K-TELEMETRY-SW1#
For event-based telemetry, use:
N9K-TELEMETRY-SW1# show telemetry event collector errors
--------------------------------------------------------------------------------
Error Description                                  Error Count
--------------------------------------------------------------------------------
Dme Event Subscription Init Failures               - 0
Event Data Enqueue Failures                        - 0
Event Subscription Failures                        - 0
Pending Subscription List Create Failures          - 0
Subscription Hash Table Create Failures            - 0
Subscription Hash Table Destroy Failures           - 0
Subscription Hash Table Insert Failures            - 0
Subscription Hash Table Remove Failures            - 0
N9K-TELEMETRY-SW1#
All event collector error counters were also zero.
These results help rule out configuration and event collector failures when investigating the skipped periodic collections.
Troubleshooting Workflow
The commands used during this investigation can be summarized as follows:
| Command | Purpose |
|---|---|
| show telemetry transport | Check the current transport session state. |
| show telemetry data collector brief | Identify successful, failed, skipped, or dropped collections. |
| show telemetry data collector details | Determine which sensor paths are affected. |
| show telemetry control stats | Determine why collections were skipped. |
| show telemetry transport <session-id> errors | Inspect transport failures. |
| show telemetry transport <session-id> stats | Review transport recovery, queues, and drops. |
| show telemetry config errors | Identify telemetry configuration errors. |
| show telemetry event collector errors | Identify event collector errors. |
In this lab, the troubleshooting sequence identified a temporary telemetry destination reachability condition rather than a DME sensor-path or configuration failure.
After the receiver became available again, the telemetry transport returned to the Connected state, collections resumed, and no current queue or message-drop condition was observed.
Practical Application Example: Monitor System Resources
System resource monitoring is a common use case for Streaming Telemetry. CPU and memory information can be periodically exported from a Nexus switch to an external monitoring platform for historical analysis, dashboards, capacity monitoring, and alerting.
Cisco NX-OS provides predefined telemetry path labels for commonly monitored information. In this example, the resources path label is used to collect system CPU and memory information.
Configure System Resource Telemetry
Create a new sensor group using the resources path label:
N9K-TELEMETRY-SW1(config)# telemetry
N9K-TELEMETRY-SW1(config-telemetry)# sensor-group 4
N9K-TELEMETRY-SW1(conf-tm-sensor)# path resources
Create Subscription 4 and associate Sensor Group 4 with Destination Group 1:
N9K-TELEMETRY-SW1(config-telemetry)# subscription 4
N9K-TELEMETRY-SW1(conf-tm-sub)# dst-grp 1
N9K-TELEMETRY-SW1(conf-tm-sub)# snsr-grp 4 sample-interval 10000
Sensor Group 4 uses the predefined resources path label. Subscription 4 associates the sensor group with the existing telemetry destination and configures periodic collection with a non-zero sampling interval.
The relevant configuration is:
telemetry
  destination-group 1
    ip address 192.168.100.10 port 57000 protocol gRPC encoding GPB
    use-vrf default

  sensor-group 4
    path resources

  subscription 4
    dst-grp 1
    snsr-grp 4 sample-interval 10000
Review the Resources Path Label
Run this command to examine the DME paths represented by the resources path label:
N9K-TELEMETRY-SW1# show telemetry usability resources

  1) label_name          : resources
     path_name           : sys/proc
     query_type          : poll
     <snip>

  2) label_name          : resources
     path_name           : sys/procsys
     query_type          : poll
     <snip>

  3) label_name          : resources
     path_name           : sys/procsys/sysmem
     query_type          : event
     query_condition     : query-target-filter=and(updated(procSysMem.memstatus),ne(procSysMem.memstatus,"OK"))
The output shows that the resources label represents multiple underlying DME paths.
The sys/proc and sys/procsys paths use polling queries and provide process and system resource information. The sys/procsys/sysmem path uses an event query that can report a change when the monitored memory status is updated and is no longer OK.
This demonstrates the difference between specifying an individual DME Distinguished Name directly and using a predefined telemetry path label.
For example:
Individual DME path:
path sys/intf/phys-[eth1/10]
Predefined path label:
path resources
Verify System Resource Telemetry
Use show telemetry control database to verify the state of Sensor Group 4 and Subscription 4.
The Sensor Group Database reports:
Sensor Group ID  Sensor Group type  Sampling interval(ms)  Linked subscriptions  SubID
----------------------------------------------------------------------------------------------------
4                Timer   /DME            10000/Running      1                     4
The Timer /DME type and 10000/Running sampling interval confirm that Sensor Group 4 is operating as a periodic DME telemetry source.
The Sensor Path Database also shows the underlying paths associated with the resources label.
For example:
resources:sys/procsys(4)
GPB Encoded Data size in bytes (Cur/Min/Max): 20221/20221/20229
Subscription Id: 4
Message Stats:
Sent = 14
Error = 0
Drops = 0
The process-related path also reports active telemetry collection:
resources:sys/proc(4)

GPB Encoded Data size in bytes (Cur/Min/Max): 82284/81262/85098
Subscription Id: 4

Message Stats:

    Sent                = 14
    Error               = 0
    Drops               = 0
These counters confirm that resource information is being collected, encoded as GPB, and transmitted without message errors or drops.
Compare with NX-OS System Resources
The traditional NX-OS CLI can be used to display the current CPU and memory state of the switch:
N9K-TELEMETRY-SW1# show system resources
Load average:   1 minute: 0.57   5 minutes: 0.58   15 minutes: 0.63
Processes   :   854 total, 2 running
CPU states  :   14.64% user,   3.50% kernel,   81.85% idle
<snip>
Memory usage:   24530808K total,   9315248K used,   15215560K free
Kernel buffers:   22104K Used
Kernel cached :   6255520K Used
Current memory status: OK
The CLI provides an instantaneous view of the system resources.
Streaming Telemetry allows the same type of CPU and memory information to be exported toward an external receiver so that multiple samples can be stored and analyzed over time.
CPU utilization can change rapidly. Therefore, CPU values displayed by the CLI and values received through telemetry can differ when the samples are collected at different times.
Verify Resource Data at the Receiver
The telemetry receiver successfully decoded the system resource information associated with Subscription 4.
This example shows CPU and memory information from one telemetry sample:
{
  "timestamp": "2026-09-18T23:15:08Z",
  "source": "N9K-TELEMETRY-SW1",
  "cpu": {
    "user": 11,
    "kernel": 2,
    "idle": 85,
    "averageLast60Seconds": 7.099999904632568
  },
  "memory": {
    "status": "OK",
    "utilization": 38.18336486816406,
    "usedKB": 9366688,
    "freeKB": 15164120,
    "totalKB": 24530808
  }
}
The receiver output confirms that CPU and memory information from Subscription 4 is being successfully decoded and made available for external monitoring.
For comparison, the NX-OS CLI reported approximately 9.3 GB of used memory out of approximately 24.5 GB total memory and a current memory status of OK. The telemetry sample reports the same total memory value, a memory utilization of approximately 38 percent, and the same OK memory state.
The CPU values can vary between the CLI and telemetry samples because CPU utilization changes dynamically and the measurements are not necessarily collected at the same instant.
Observe Resource Utilization Over Time
Multiple telemetry samples can be used to observe how system resource utilization changes over time.
These samples were received from Subscription 4 during the lab:
CPU Average Utilization - Last 60 Seconds
10% |
 9% |     ●
 8% |                 ●
 7% |                             ●
 6% |
    +-------------------------------------
      23:14:08        23:14:38        23:15:08
        8.70%            8.50%            7.10%
                         Time
Memory Utilization
39% |
38% |     ●-----------●-----------●
37% |
    +-------------------------------------
      23:14:08        23:14:38        23:15:08
       37.82%          38.06%           38.18%
                         Time
These samples illustrate how periodic telemetry can provide a time-based view of system behavior instead of a single instantaneous measurement. In a production environment, a monitoring or observability platform can store larger numbers of samples and use the samples to identify trends, generate alerts, and build historical dashboards.
Conclusion
Cisco NX-OS Streaming Telemetry provides a structured mechanism for exporting operational information from Cisco Nexus 9000 switches to an external telemetry receiver.
This document demonstrated the fundamental components of Streaming Telemetry, including DME sensor paths, GPB encoding, gRPC transport, destination groups, sensor groups, and subscriptions.
Using the lab environment, both periodic and event-based telemetry were configured and verified. Periodic subscriptions were used to collect Ethernet1/10 statistics and operational information, while an event-based subscription was used to detect controlled changes to the Loopback100 Managed Object.
A practical system resource monitoring example also demonstrated how the predefined resources path label can be used to export CPU and memory information toward an external telemetry receiver.
The verification and troubleshooting examples demonstrated how NX-OS telemetry commands can be used to validate transport connectivity, data collection, event processing, and historical collection failures.
These concepts provide a foundation for understanding, implementing, verifying, and troubleshooting basic Streaming Telemetry deployments on Cisco Nexus 9000 NX-OS.
Revision History
| Revision | Publish Date | Comments |
|---|---|---|
1.0 |
01-Oct-2026
|
Initial Release |

 Feedback
Contact Cisco
- Open a Support Case

- (Requires a Cisco Service Contract)