Troubleshoot TCP Performance on Nexus 9000 (NX-OS)
Available Languages
Contents
Introduction
This document describes TCP fundamentals, Wireshark deep packet analysis, and practical troubleshooting to optimize end-to-end performance.
Prerequisites
Requirements
Cisco recommends that you have knowledge of these topics:
- IP/TCP
Components Used
The information in this document is based on these software and hardware versions:
- Cisco Nexus 9000 Cloud Scale with Cisco NX-OS 10.6(X).

Note: Any questions about the configuration and interoperability of third-party software or hardware are outside of Cisco support. The use of third-party tools is a best effort to demonstrate your configuration and operation with Cisco equipment.
The information in this document was created from the devices in a specific lab environment. All of the devices used in this document started with a cleared (default) configuration. If your network is live, ensure that you understand the potential impact of any command.
Background Information
What is TCP
Transmission Control Protocol (TCP) is a fundamental transport-layer protocol that operates at Layer 4 of the OSI model and provides reliable, ordered, and error-checked delivery of a stream of bytes between applications communicating over an IP network.
Three Key Benefits
- Reliability: TCP is connection-oriented and guarantees delivery by requiring acknowledgments from the receiver. If a packet is lost or corrupted during transmission, TCP automatically retransmits the data to ensure it reaches the destination.
- Ordered Delivery: Because network packets can arrive out of order, TCP assigns sequence numbers to each segment. This allows the receiving system to reassemble the data in the exact order it was originally sent.
- Flow and Congestion Control: TCP dynamically manages the rate of data transmission to match the receivers processing capacity and the current network conditions, preventing data loss caused by buffer overflows or network congestion.
TCP/IP Encapsulation Overview
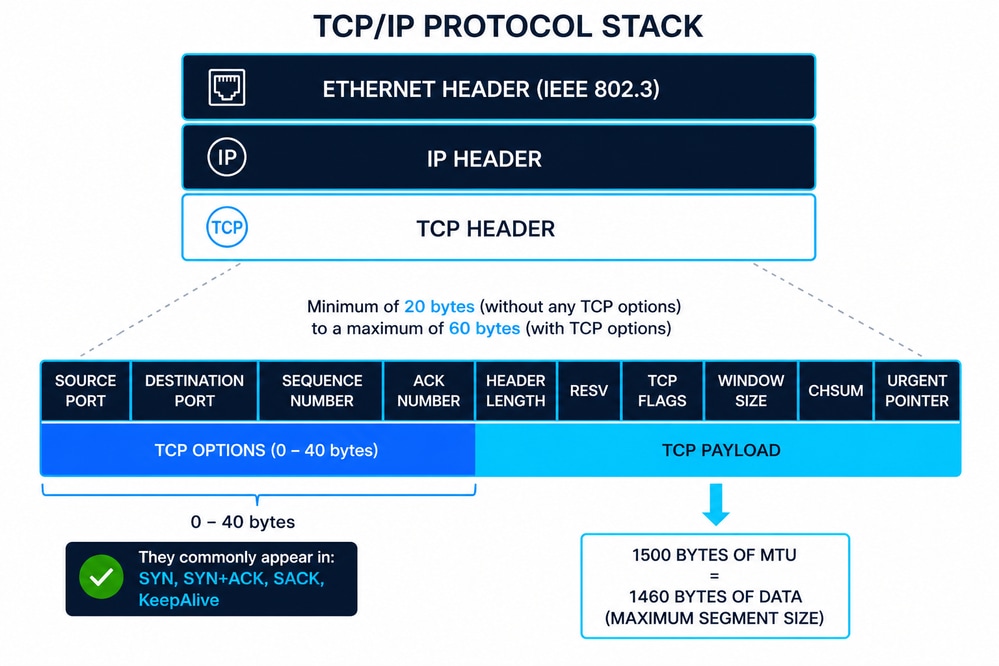
The diagram represents the TCP/IP stack where a TCP segment (Layer 4) is encapsulated within an IP packet (Layer 3), and then inside an Ethernet frame (Layer 2) defined by IEEE 802.3. This layered approach ensures modular communication, where each layer adds its own control information (headers) to guarantee delivery, routing, and data integrity.
Ethernet Header (IEEE 802.3)
The Ethernet header is typically 14 bytes, composed of:
- Destination MAC Address (6 bytes)
- Source MAC Address (6 bytes)
- EtherType/Length (2 bytes)
Additionally, Ethernet frames include a 4-byte Frame Check Sequence (FCS) trailer for error detection at Layer 2. IEEE 802.3 defines framing, minimum/maximum frame sizes, and physical delivery constraints that directly impact upper-layer protocols like TCP.
IP Header (IPv4)
The IPv4 header has a minimum size of 20 bytes, extendable up to 60 bytes with options. Key fields include:
- Source and Destination IP addresses
- Time To Live (TTL)
- Protocol (identifies TCP as payload)
The IP layer is responsible for logical addressing and routing across networks, but it does not guarantee reliability.
TCP Header Structure
The TCP header ranges from 20 to 60 bytes depending on options. Key fields include:
- Source/Destination Ports
- Sequence Number
- Acknowledgment Number
- Flags (SYN, ACK, FIN, RST, so on)
- Window Size
- Checksum
TCP adds reliable delivery, proper sequencing, and flow control to IP communication.
TCP Options (Common 10)
TCP options extend the base protocol. The most common include:
- Maximum Segment Size (MSS) – Defines the largest TCP payload a host can accept.
- Window Scale – Extends the receive window beyond 65,535 bytes.
- Selective Acknowledgment Permitted (SACK Permitted) – Enables selective acknowledgment capability.
- Selective Acknowledgment (SACK) – Specifies received data blocks to avoid full retransmissions.
- Timestamps – Used for RTT calculation and Protection Against Wrapped Sequence numbers (PAWS).
- No-Operation (NOP) – Padding for alignment of options.
- End of Option List (EOL) – Marks the end of TCP options.
- TCP Fast Open (TFO) – Allows data exchange during the initial handshake.
- Multipath TCP (MPTCP) – Enables multiple network paths for a single TCP session.
- User Timeout Option (UTO) – Controls how long transmitted data can remain unacknowledged.
TCP Sequence and Acknowledgment Behavior (Including SYN/FIN)
Both SYN and FIN flags each consume one sequence number, even when no payload is present. TCP operates using a byte-oriented sequencing model, where every byte transmitted—and specific control flags—advance the sequence space. This behavior is essential for accurate TCP analysis in packet captures and for diagnosing sequencing or acknowledgment inconsistencies.
ACK = SEQ + Payload Length + (SYN ? 1 : 0) + (FIN ? 1 : 0)
Where:
- SEQ = Initial sequence number
- Payload Length = Data size in bytes
- SYN ? 1: 0 = Adds 1 if SYN flag is set, otherwise 0
- FIN ? 1: 0 = Adds 1 if FIN flag is set, otherwise 0
- ACK = Next expected byte
Example 1: SYN with Data (TCP Fast Open)
- SEQ = 1000
- SYN = 1
- Payload Length = 200 bytes
ACK calculation:
- ACK = 1000 + 200 + 1 + 0 = 1201
This reflects a scenario where data is sent during the TCP handshake. Both the payload and the SYN flag consume sequence space.
Example 2: FIN with Data (Connection Termination)
- SEQ = 3000
- FIN = 1
- Payload Length = 150 bytes
ACK calculation:
- ACK = 3000 + 150 + 0 + 1 = 3151
This shows that TCP can include data during connection teardown, and both the payload and FIN flag increment the sequence number.
MSS and Its Relationship with MTU
The Maximum Segment Size (MSS) defines the maximum payload TCP can send in a segment.
- Typical Ethernet MTU = 1500 bytes
- MSS = MTU − IP Header − TCP Header
- Standard MSS = 1460 bytes (1500 − 20 − 20)
If TCP options are present, MSS is reduced accordingly. MSS is negotiated during the TCP three-way handshake and prevents fragmentation at the IP layer.
How MSS Negotiation Works in the TCP Three-Way Handshake
The Maximum Segment Size (MSS) is exchanged during the TCP three-way handshake using the MSS option in SYN packets:
- Host A → Host B (SYN): advertises its MSS (for example, 1460)
- Host B → Host A (SYN-ACK): advertises its MSS (for example, 1380)
Each side is effectively saying:
This is the largest TCP payload accepted.
Key Rule: MSS is Directional
MSS is not negotiated as a single agreed value.
Instead:
- Each host uses the MSS advertised by the other side.
- This creates two independent limits, one per direction.
Therefore:
- A sends data using B’s MSS.
- B sends data using A’s MSS.
Can the Source Send More TCP Payload Than the Destination MSS
In a correctly functioning TCP stack: No.
- The sender must respect the MSS advertised by the receiver.
- Sending larger segments would risk:
- IP fragmentation (if MTU is exceeded)
- Packet drops (if fragmentation is blocked or unsupported)
- This leads to:
- Retransmissions
- Performance degradation
- Issues like PMTUD (Path MTU Discovery) black holes
Practical Insight for Troubleshooting
- Always verify MSS values in TCP three-way handshake (SYN/SYN-ACK packets).
- Check for mismatches caused by:
- Tunnels (VXLAN, GRE, IPsec)
- Firewalls modifying MSS (MSS clamping)
- On platforms like Cisco NX-OS, MSS adjustment is often used to prevent fragmentation across encapsulated paths
Window Size (Flow Control)
The Window Size defines how much data the receiver can accept without acknowledgment.
What it is:
- A flow control mechanism to prevent buffer overflow.
Purpose:
- Ensures sender does not overwhelm the receiver.
Where to obtain it:
- Visible in packet captures (for example, Wireshark).
- Derived from OS TCP stack configuration and buffer size.
Vendor/OS Variability:
- Different implementations (Linux, Windows, Cisco NX-OS) use dynamic scaling and buffer tuning, leading to varying window sizes.
Zero Window Condition:
- When Window Size = 0, the receiver buffer is full.
- Sender pauses transmission and sends periodic probes.
Variable Windows Mechanisms
- Rate-Based Flow Control
- It assigns the sender a fixed data rate and ensures that data never exceeds that allocation.
- Ideal for streaming applications.
- Broadcast and multicast delivery
- Window-Based Flow Control
- The window size varies over time.
- The receiver achieves flow control by signaling the allowed window to the sender window updates.
Troubleshooting Use:
- Small or zero windows → Receiver-side bottleneck (CPU, memory, application).
- Large windows but low throughput → Network issues (latency, congestion).
- Analyzing window behavior is critical for diagnosing performance problems in TCP sessions.
TCP Data-Plane Troubleshooting on Cisco Nexus 9000 (NX-OS)
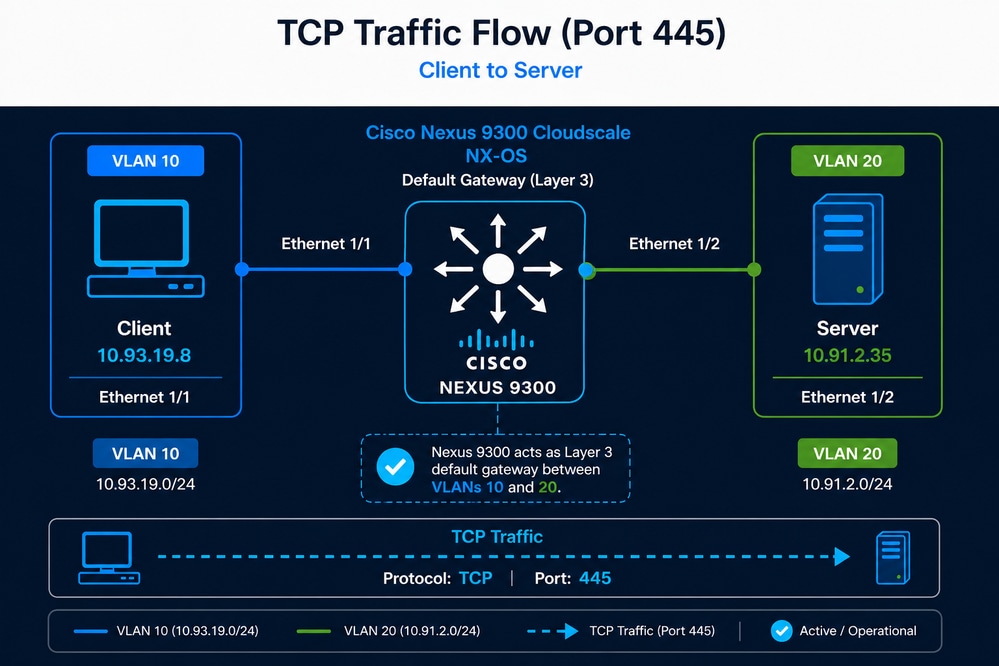
This section describes a practical methodology for diagnosing whether a Cisco Nexus switch running NX-OS is affecting TCP traffic forwarding or introducing performance issues. The approach is presented through a hypothetical scenario.
When TCP latency or performance degradation is observed, it is common to initially suspect that the network is causing it. However, this assumption must be validated through data-driven analysis. The authoritative method for TCP troubleshooting is packet capture, ideally performed:
- Simultaneously at source and destination
- Before traffic initiation
This ensures visibility into the TCP three-way handshake, where critical parameters such as MSS, Window Scale, and SACK are negotiated and not repeated later in the session. If simultaneous captures are not possible, analysis can proceed with a single capture, but conclusions are limited.
Scenario Definition
A user has identified that the backup process for an application dataset of approximately 7.5 TB, which previously completed in about 9 hours, is now taking nearly 21 hours. Although TCP sessions between the client and the server are still established successfully, the significant increase in backup duration suggests a potential degradation in throughput or overall TCP performance. Because the Nexus switch is the only network device in the path and also provides Layer 3 gateway functionality, the network administrator suspects that the Nexus switch is the cause of the problem.
- Client: 10.93.19.8 (VLAN 10)
- Server: 10.91.2.35 (VLAN 20)
- Nexus 9300 acting as default gateway
- TCP Port 445
Initial Validation (Reachability)
- These commands are used to validate the Path MTU (PMTU) between a source and destination by sending ICMP packets with the Don’t Fragment (DF) bit set. This helps determine the maximum packet size that can traverse the network without fragmentation. This process must be performed on both the source and the destination.
- Always verify the MTU of the physical interface on both the source and the destination.
- In this scenario, access is available only to the source host, where an MTU of 1500 was identified.
Linux: ping -c 10 -I 10.93.19.8 -s 1472 -M do 10.91.2.35- -c 10 → Sends 10 ICMP echo requests
- -I 192.168.10.10 → Uses this specific source IP/interface
- -s 1472 → Sets ICMP payload size to 1472 bytes
- -M do → Sets the DF (Don’t Fragment) bit
- 192.168.20.20 → Destination IP
Windows: ping -n 10 -l 1472 -f 10.91.2.35- -n 10 → Sends 10 ICMP echo requests
- -l 1472 → Sets ICMP payload size to 1472 bytes
- -f → Sets the Don’t Fragment (DF) flag
- 192.168.20.20 → Destination IP
Why 1472 Bytes?
- ICMP payload = 1472 bytes
- IP header = 20 bytes
- ICMP header = 8 bytes
- Total packet size: 1472 + 20 + 8 = 1500 bytes (standard MTU)
- This tests whether the path supports a 1500-byte MTU without fragmentation. If you attempt to send 1500 bytes of ICMP payload, the ping can fail because the total packet size would exceed the standard MTU after adding the IP and ICMP headers.
What Can Be Concluded
- If the ping succeeds (no packet loss), the path supports at least a 1500-byte MTU and no fragmentation is required.
- Clean ICMP results → proceed to TCP analysis
- Intermittent ping success → possible packet loss, transient congestion, rate limiting, or a forwarding issue; proceed to packet-loss analysis, since TCP requires a loss-free path to operate efficiently.
- If the ping fails with error “Fragmentation needed” or times out, there is a link in the path with MTU lower than 1500 bytes, the packet cannot be forwarded due to the DF bit, and this indicates a Path MTU issue.
How to Use This for Troubleshooting
- Gradually reduce the payload size (for example, 1472 → 1400 → 1300) to identify the largest size that succeeds.
- Once identified, calculate the MTU using the formula MTU = payload + 28 bytes (IP + ICMP headers).
Practical Relevance to TCP
- If MTU is smaller than expected, TCP segments can be fragmented or dropped.
- This leads to retransmissions, increased latency, and reduced throughput, directly impacting application performance.
Identifying Traffic Path (Interfaces)
To effectively troubleshoot TCP performance on a Cisco Nexus 9000 switch, it is essential to determine which interfaces are receiving and forwarding the traffic between the source and destination.
In simple topologies, this can be inferred directly from the physical connections. For example, if the client is connected to Ethernet1/1 and the server to Ethernet1/2, the traffic path is straightforward. However, in real-world environments with multiple active interfaces, port-channels, or vPC configurations, this identification is not always trivial.
In such cases, the recommended approach is to use Embedded Logic Analyzer Module (ELAM), which provides visibility at the ASIC (data-plane hardware) level.
ELAM allows you to capture a packet as it is processed by the forwarding pipeline and reveals critical information such as:
- Ingress interface
- Egress interface
- Forwarding decision (L2/L3 lookup result)
This method is significantly more accurate than relying on control-plane tools, as it reflects the actual hardware forwarding path.
It is important to note that ELAM captures only one packet at a time, so the filtering criteria must be precisely defined to match the desired traffic (for example, source IP, destination IP, TCP port). If filters are too broad, there is a risk of capturing unrelated traffic such as ICMP or UDP instead of the intended TCP flow.
Additionally, this process must be repeated for both traffic directions:
- Source → Destination
- Destination → Source
In environments using vPC or ECMP, traffic can be load-balanced across multiple paths. As a result, forward and return traffic can traverse different switches or interfaces. In these scenarios, ELAM must be executed on each relevant Nexus switch to ensure complete visibility.
By accurately identifying ingress and egress interfaces, the scope of troubleshooting is significantly reduced, enabling focused validation of interface counters, QoS policies, MTU settings, and potential congestion points along the exact forwarding path.
ELAM Configuration (Nexus 9300 Cloud Scale)
This example filters traffic with source IP 10.93.19.8, destination IP 10.91.2.35, and TCP destination port 445.
ELAM Setup
switch# debug platform internal tah elam
switch(TAH-elam)# trigger init
Slot 1: param values: start asic 0, start slice 0, lu-a2d 1, in-select 6, out-select 0
switch(TAH-elam-insel6)# set outer ipv4 src_ip 10.93.19.8
switch(TAH-elam-insel6)# set outer ipv4 dst_ip 10.91.2.35
switch(TAH-elam-insel6)# set outer l4 l4-type 0
switch(TAH-elam-insel6)# set outer l4 dst-port 445
switch(TAH-elam-insel6)# start
After generating the traffic, retrieve the result:
switch(TAH-elam-insel6)# report
Reverse Traffic Capture (Mandatory for Full Visibility)
To validate the return path, repeat the configuration by swapping source and destination IP addresses:
switch# debug platform internal tah elam
switch(TAH-elam)# trigger init
Slot 1: param values: start asic 0, start slice 0, lu-a2d 1, in-select 6, out-select 0
switch(TAH-elam-insel6)# set outer ipv4 dst_ip 10.93.19.8
switch(TAH-elam-insel6)# set outer ipv4 src_ip 10.91.2.35
switch(TAH-elam-insel6)# set outer l4 l4-type 0
switch(TAH-elam-insel6)# set outer l4 dst-port 445
switch(TAH-elam-insel6)# start
Operational Notes
- ELAM captures only one packet, so ensure traffic is actively flowing when starting the capture.
- Filters must be precise to avoid capturing unrelated traffic.
- In vPC environments, run ELAM on both switches since traffic can hash differently in each direction.
- The output display ingress interface, egress interface, and forwarding decision in hardware, providing authoritative visibility into the data-plane.
Reference
Cisco Nexus 9000 Cloud Scale ASIC ELAM Guide
Interface-Level Validation
Interface-level validation ensures that the Nexus switch is not introducing any constraints or anomalies affecting TCP traffic. The focus is to confirm that configuration, operational state, and hardware counters are consistent with expected behavior for high-performance data-plane forwarding.
Configuration Validation
- Verify that no restrictive ACLs are applied to the interfaces:
switch# show running-config interface ethernet1/1-2 | include access-group- Validate that no unintended QoS policies are impacting traffic (interface-level and global QoS, including queuing, policing, and shaping):
switch#show running-config interface ethernet1/1-2 | include service-policyswitch#show policy-map interface ethernet1/1-2
switch# switch#switch#switch#switch#show policy-map system type network-qos
switch#
switch#- Confirm Layer 2 or Layer 3 configuration (switchport vs routed interface), including VLAN membership, STP state, and IP addressing:
switch#show running-config interface ethernet1/1-2
switch#show interface ethernet1/1-2 switchport
switch#show spanning-tree interface ethernet1/1-2
switch# show ip interface ethernet1/1-2Operational State Validation
- Verify MTU consistency and ensure it matches the expected configuration (for example, 1500 or 9000 bytes):
switch#show interface ethernet1/1-2 | include MTU
- Confirm interface speed and duplex settings:
switch#show interface ethernet1/1-2 | include speed|duplex
- Validate interface stability (no flapping or frequent link transitions):
switch#show interface ethernet1/1-2 | include rate|flap
Error Counter Validation
- Clear counters before testing:
switch#clear counters interface all
- Monitor error counters (only non-zero values):
switch#show interface counters errors non-zero | include Port|Eth1/1|Eth1/2
Post-Test Validation
- Re-run the TCP traffic test and observe counters again:
switch#show interface counters errors non-zero | include Port|Eth1/1|Eth1/2
- Counters must not increment; any increase indicates potential Layer 1 or hardware-related issues such as physical link errors, CRC/FCS errors, or buffer overruns/drops.
Routing and ARP Stability
Ensuring routing and ARP stability is critical to confirm that the Nexus switch has consistent Layer 3 reachability and is not introducing intermittent resolution issues that could impact TCP performance. Instability in routing entries or ARP resolution can lead to packet loss, increased latency, or traffic blackholing.
Validation Criteria
- Routing entries for source and destination must be present, stable, and not frequently changing.
- ARP entries must be resolved and not continuously refreshed or missing.
switch# show ip route 10.93.19.8switch# show ip route 10.91.2.35switch# show ip arp detail | include 10.93.19.8switch# show ip arp detail | include 10.91.2.35Verifying Traffic is Not Punted to CPU
In Cisco Nexus 9000 switches, forwarding is performed in hardware (ASIC), and the CPU is not involved in normal data-plane operations. Therefore, observing host-to-host TCP traffic in the control-plane is abnormal and indicates that packets are being punted due to exceptions or misconfigurations. Once traffic must be processed by the CPU, it becomes subject to Control Plane Policing, and it is expected that drops can be observed if the traffic exceeds the allowed control-plane rate.
Validation Method
- Capture traffic reaching the control-plane using Ethanalyzer:
switch# ethanalyzer local interface inband display-filter "ip.addr==10.93.19.8 and ip.addr==10.91.2.35" limit-capture 0 Expected Behavior
- No host-to-host TCP data-plane traffic can be observed in the CPU.
Unexpected Behavior
- If packets matching the flow are visible, traffic is being punted, which can be caused by:
- Exceptional packet handling (TTL expiration, ACL logging, redirects)
- Misconfiguration or unsupported features
- Incorrect hardware programming
Determining Packet Forwarding Latency
Packet forwarding latency in Nexus 9000 switches depends on packet size, forwarding mode, and enabled features. Cisco specifications typically reference latency for 64-byte packets under cut-through forwarding.
+----------------------+----------------------+-------------------------+-------------------------------+
| Switch Model         | ASIC / Architecture  | Ports (example config)  | Typical Forwarding Latency    |
|                      |                      |                         | (64B packet)                  |
+----------------------+----------------------+-------------------------+-------------------------------+
| Nexus 93180YC-EX     | Cloud Scale (EX)     | 48x25G + 6x100G         | ~1.0 – 1.2 microseconds       |
| Nexus 93180YC-FX     | Cloud Scale (FX)     | 48x25G + 6x100G         | ~0.9 – 1.0 microseconds       |
| Nexus 93180YC-FX2    | Cloud Scale (FX2)    | 48x25G + 6x100G         | ~0.8 – 0.9 microseconds       |
| Nexus 9364C          | Cloud Scale          | 64x100G                 | ~1.0 microsecond              |
| Nexus 9336C-FX2      | Cloud Scale (FX2)    | 36x100G                 | ~0.8 microseconds             |
| Nexus 93240YC-FX2    | Cloud Scale (FX2)    | 48x25G + 12x100G        | ~0.8 – 0.9 microseconds       |
| Nexus 92300YC        | Broadcom Trident II  | 48x10/25G + 6x40/100G   | ~2 – 3 microseconds           |
| Nexus 92160YC-X      | Broadcom Tomahawk    | 48x25G + 6x100G         | ~2 microseconds               |
+----------------------+----------------------+-------------------------+-------------------------------+
- Cut-through forwarding (default in Nexus 9000):
- Begins forwarding before the full packet is received.
- Minimizes latency (sub-microsecond to ~1 µs).
- Store-and-forward:
- Entire packet must be received before forwarding.
- Adds latency proportional to packet size.
Additional features can introduce incremental latency:
- VXLAN encapsulation/decapsulation
- ACL lookups (TCAM processing)
- QoS classification and queuing
- Telemetry (NetFlow, ERSPAN, sFlow)
- Buffering during congestion
However:
- These operations are performed in hardware pipelines.
The only realistic scenario where latency increases noticeably is congestion:
- Packets are buffered in egress queues.
- Delay depends on:
- Queue depth
- Interface utilization
- QoS policies
Even in these cases:
- Latency is usually in the microseconds to low hundreds of microseconds range.
- Sustained millisecond-level delay would imply:
- Severe congestion
- Oversubscription
- Misconfigured QoS or buffering
SPAN to CPU (Packet Capture for Data Plane)
This enables mirroring of data-plane traffic into the control-plane for packet capture and export to a .pcapng file, allowing detailed analysis in Wireshark.
Configuration
monitor session 1
 source interface ethernet1/1 both
 source interface ethernet1/2 both
 destination interface sup-eth0
 no shut
Capture Execution
switch# ethanalyzer local interface inband mirror capture-filter "tcp port 445" limit-capture 0 write bootflash:tcp_capture.pcapng Technical Considerations
- Traffic mirrored to CPU is subject to Control Plane Policing (CoPP).
- If traffic exceeds CoPP:
- Packets can be dropped only in control-plane.
- This creates false positives during analysis.
- SPAN to CPU is recommended for low-to-moderate traffic scenarios.
- For high-throughput environments:
- Use local SPAN (external analyzer)
- Use ERSPAN for remote capture
| Method | Advantage | Limitation |
|---|---|---|
| SPAN |
Accurate, no encapsulation |
Requires physical connection. |
| ERSPAN |
Remote capture capability |
Susceptible to network congestion. |
Control-Plane Rate Limiting Validation
To ensure SPAN-to-CPU captures are reliable, it is necessary to validate that the control-plane is not dropping mirrored packets due to rate limiting.
Validation Command
switch(config)# show hardware rate-limiter | i Allowed|span

Allowed, Dropped & Total: aggregated bytes since last clear counters

R-L Class     Config Allowed Dropped Total

span          50           0       0     0 <<<

span-egress   disabled     0       0     0
Validation Methodology
- Execute the command at ~3-second intervals.
- Observe the SPAN-related drop counters.
Interpretation
- No increment in drop counters for SPAN row indicates a reliable capture.
- Increasing drop counters indicate packet loss in control-plane, making the capture unreliable.
If drops are observed, the capture method must be changed to SPAN or ERSPAN.
ICMP-Based Validation Before TCP
ICMP testing provides a baseline validation of data-plane integrity before performing complex TCP analysis. Because ICMP is stateless and simpler, it allows quick detection of packet loss, duplication, or path inconsistencies.
Expected Behavior in SPAN Capture
- Each ICMP packet can appear twice:
- Once on ingress
- Once on egress
- For a standard ping:
- Echo Request → 2 packets
- Echo Reply → 2 packets
This confirms correct forwarding and absence of packet loss in the data-plane.
Abnormal Behavior
- Missing duplicates or asymmetric packet counts indicate potential packet loss or capture limitations.
- Intermittent timeouts suggest Layer 1 issues, congestion, or upstream problems.
If ICMP traffic is consistently forwarded without loss, there is a high probability that TCP traffic is also being forwarded correctly at Layer 2/3.
Determining Nexus Switch Forwarding Latency Using Packet Capture
When traffic is captured using SPAN to CPU (or SPAN/ERSPAN), each packet can be observed twice: once on ingress and once on egress. This duplication can be used to estimate the forwarding latency introduced by the Nexus switch by calculating the time difference between both instances of the same packet.
In practice, this latency can be measured using the previously captured ICMP traffic by comparing the time delta between duplicated Echo Request and Echo Reply packets. This provides a simple and effective baseline for switch forwarding performance. If deeper analysis is required, the same methodology can be applied to TCP traffic by capturing the flow and measuring the time difference between duplicated TCP packets.
Methodology
- Identify a packet and its duplicate (same sequence number).
- Measure the time delta between the ingress and egress copies.
- This delta represents an upper-bound estimate of the switch forwarding latency, as it can include mirroring and timestamping overhead.
Wireshark Configuration
- Enable time delta display:
View > Time Display Format > Seconds Since Previous Displayed Packet
- Add a custom column for time delta:
Right-click on "Time Delta from Previous Displayed Packet" → Apply as Column
- Filter relevant traffic (example):
ip.addr==10.93.19.8 and ip.addr==10.91.2.35 and tcp
- Sort packets by sequence number or TCP stream:
Right-click packet → Follow → TCP Stream
Interpretation
- The time delta between duplicated packets can be in the microsecond range.
- If this is the case, Nexus switch is not introducing latency to packet forwarding.
- Consistent low deltas confirm hardware-based forwarding performance.
- Higher or inconsistent deltas can indicate:
- Congestion or buffering
References
- Cisco Nexus 9000 Series Data Sheets
- Cisco Nexus 9000 Series Switches Design Guides
- Intelligent Buffer Management on Cisco Nexus 9000 Series Switches White Paper
TCP Traffic Analysis from the Source Host Packet Capture
This section provides a detailed methodology for analyzing a TCP packet capture in Wireshark, including the profile configuration, through the hypothetical case described previously. The images shown were taken directly from Wireshark. As a reminder, the scenario is:
A user has identified that the backup process for an application dataset of approximately 6.5 TB, which previously completed in about 9 hours, is now taking nearly 21 hours. The only accessible network device is a Cisco Nexus 9300 switch connected to the source server (10.93.19.8). The MTU configured on the switch interface is 9000 bytes (jumbo frames), while the MTU on the server is unknown. A packet capture from the source server is available, and all prior Nexus validation steps have already been completed with no anomalies detected.
Key Observations and Constraints
- Nexus switch has been ruled out:
- No packet drops
- No interface errors
- No QoS or ACL impact
- Hardware forwarding confirmed
- Interface configuration:
- Access port
- MTU: 9000 bytes
- Available data:
- Packet capture at source
- End-to-end MTU knowledge
- The ping completed successfully without fragmentation using a 1500-byte packet with 1,472 bytes of data.
- Missing data:
- Destination visibility
- No packet capture is available on the destination server.
In Wireshark, you can create custom profiles tailored to the specific type of analysis you want to perform.
Column Description
- tcp.analysis.initial_rtt (iRTT): Estimates the initial round-trip time based on the TCP three-way handshake.
- tcp.analysis.ack_rtt (ACK RTT): Measures the time between a TCP segment and its corresponding acknowledgment.
- tcp.window_size (Window): Indicates the receiver’s advertised TCP window size before scaling is applied.
- tcp.options.wscale.multiplier (Multi): Represents the window scaling factor used to calculate the effective receive window.
- tcp.seq (Seq#): Displays the sequence number of the first byte in the TCP segment.
- tcp.len (Payload): Shows the size of the TCP payload in bytes for that segment.
- tcp.ack (ACK#): Indicates the next expected byte from the sender (cumulative acknowledgment).
- tcp.options.mss_val (MSS): Displays the Maximum Segment Size advertised during the TCP handshake.
- ip.ttl (TTL): Shows the Time To Live value, useful for identifying hop count and routing behavior.
- tcp.analysis.bytes_in_flight (Bytes in Flight): Represents the amount of unacknowledged data currently in transit.
Analysis of the TCP Three-Way Handshake
Capturing the TCP three-way handshake is mandatory because it contains critical parameters such as MSS, Window Scale, and SACK that define how the session behaves.
Without this information, any TCP analysis is incomplete and can lead to incorrect conclusions about performance or root cause.

Traffic Identification
From the packet capture:
- Source IP Address: 10.93.19.8
- Destination IP Address: 10.91.2.35
Initial Round-Trip Time (iRTT) Analysis
The initial RTT (iRTT) is calculated as:
- iRTT = 798 microseconds
This value is derived from:
- Packet 2 (SYN-ACK) ACK RTT: 750 µs → Time for the destination to respond to the SYN.
- Packet 3 (ACK) ACK RTT: 48 µs → Time for the source to acknowledge the SYN-ACK.
The majority of latency (~94%) is in the forward path (client → server → client), while the response time from the source is minimal, indicating no CPU or application delay on the client.
TCP Port Identification
- Destination TCP Port: 445
Port 445 corresponds to Microsoft Server Message Block (SMB), commonly used for file sharing, network drives, and Windows authentication services. This protocol is sensitive to both latency and throughput, making it highly dependent on TCP efficiency and network stability.
TCP Window Size Analysis
- Source Window (scaled): 64,240 bytes
- Destination Window: 65,535 bytes
The TCP window represents how much data can be sent before waiting for acknowledgment. In this case, the source is slightly more restrictive than the destination. These values are relatively small for modern environments and can limit throughput, especially as RTT increases.
The maximum theoretical throughput can be estimated using:
Throughput = TCP Window Size / RTT
Substituting the observed values:
- TCP Window Size = 64,240 bytes
- RTT = 798 microseconds = 0.000798 seconds
Throughput ≈ 64,240 / 0.000798 ≈ 80.5 MB/s (~644 Mbps)
This represents the upper bound throughput assuming:
- No packet loss
- No retransmissions
- Ideal network conditions
Throughput, Transfer Time, and Required Conditions Analysis
At the current throughput of 644 Mbps, transferring a 6.5 TB file takes approximately 23.5 hours, which aligns with the observed degradation. To achieve a 9-hour transfer window, the throughput must increase to approximately 1.68 Gbps, requiring either a larger TCP window (~2.7x increase) or a significantly lower RTT (~291 µs).
With current conditions (64 KB window and ~798 µs RTT), it is not possible to reach the 9-hour objective, because TCP throughput is constrained by the bandwidth-delay product. Without increasing the window size or reducing latency, the protocol cannot utilize higher available bandwidth, making the target unattainable.
| Scenario | Throughput | Estimated Transfer Time (6.5 TB) | Required TCP Window | Required RTT |
|---|---|---|---|---|
| Current State |
644 Mbps (~80.5 MB/s) |
~23.5 hours |
64 KB |
798 µs |
| Target (9 hours) |
~1683 Mbps (~210 MB/s) |
9 hours |
~172 KB |
~291 µs |
This worked previously, indicating that a change occurred in the network, the application, the source, or the destination. It is important to note that, based on this initial analysis alone, a significant conclusion can already be established: under the current TCP window size and RTT conditions, achieving the 9-hour objective is not possible.
The tables show a comparison of how throughput varies as RTT and TCP window size increase or decrease.
RTT Impact on Throughput (Fixed Window Size = 64,240 bytes)
| RTT | Throughput (MB/s) | Throughput (Mbps) |
|---|---|---|
| 200 µs (0.0002 s) |
~321 MB/s |
~2,568 Mbps |
| 798 µs (0.000798 s) |
~80.5 MB/s |
~644 Mbps |
| 2 ms (0.002 s) |
~32.1 MB/s |
~257 Mbps |
| 10 ms (0.01 s) |
~6.4 MB/s |
~51 Mbps |
TCP Window Size Impact (Fixed RTT = 798 µs)
| TCP Window Size | Throughput (MB/s) | Throughput (Mbps) |
|---|---|---|
| 16 KB (16,384 B) |
~20.5 MB/s |
~164 Mbps |
| 64 KB (64,240 B) |
~80.5 MB/s |
~644 Mbps |
| 256 KB (262,144 B) |
~328 MB/s |
~2,624 Mbps |
| 1 MB (1,048,576 B) |
~1,314 MB/s |
~10.5 Gbps |
Technical Interpretation
- Throughput is inversely proportional to RTT → higher latency reduces performance.
- Throughput is directly proportional to TCP window size → larger windows increase capacity.
- Small window sizes severely limit throughput, even in low-latency environments.
- High-speed networks (10G+) require window scaling to fully utilize bandwidth.
This demonstrates that both RTT and TCP window size are critical factors in TCP performance and must be analyzed together when troubleshooting throughput issues.
IP and TCP Header Length
- IP Header Length: 20 bytes
- TCP Header Length: 32 bytes
A 20-byte IP header indicates no IP options are present. The 32-byte TCP header confirms that TCP options are being used, adding 12 bytes beyond the base header. These options typically include MSS, Window Scale, and SACK Permitted.
TCP Options Analysis and TTL
Selective Acknowledgment (SACK) is enabled on both endpoints. This is not visible in the picture. SACK allows the receiver to acknowledge non-contiguous blocks of data, informing the sender exactly which segments were received successfully.
For example, if segments 1000–2000 and 3000–4000 are received but 2000–3000 is missing, the receiver can indicate this explicitly. Without SACK, the sender would retransmit all data after the gap; with SACK, only the missing portion is retransmitted. This significantly improves performance in environments with packet loss.
Packet 1 (SYN) Analysis
- Seq#: 0 (Wireshark normalized)
- Payload: 0 bytes
- ACK#: 0
- MSS: 1460 bytes
- TTL: 128
Wireshark normalizes the sequence number to zero for readability, although in practice it is a large random value. The absence of payload is expected during connection establishment. The MSS value of 1460 bytes indicates an MTU of 1500 bytes (20 bytes IP header + 20 bytes TCP header). A TTL of 128 can be a Windows-based host, and seeing this value in the capture indicates the capture was likely taken at or very near the source via Layer 2.
Packet 2 (SYN-ACK) Analysis
- ACK#: 1
The ACK value is 1 because the SYN flag consumes one sequence number, even when no payload is present. Therefore, ACK = SEQ + 1.
- TTL: 59
The observed TTL of 59 suggests an initial TTL of 64, meaning the packet traversed approximately 5 routing hops (64 − 59 = 5). Each routed hop decrements the TTL by one.
Fragmentation Risk and Network Impact
The presence of approximately five routing hops introduces potential performance risks, particularly related to MTU mismatches and fragmentation.
If any intermediate link has a lower MTU than the original packet size, fragmentation can occur. This leads to several consequences:
- Increased latency due to fragmentation and reassembly overhead.
- Higher probability of packet loss, since losing a single fragment requires retransmission of the entire packet.
- Reduced throughput, as TCP interprets loss as congestion and reduces its sending rate.
- Increased CPU utilization on network devices handling fragmentation.
- Risk of Path MTU Discovery (PMTUD) failures if ICMP is blocked, resulting in silent packet drops.
Given these factors, it is critical to ensure consistent MTU across the path or implement MSS clamping where necessary.
TCP RTT Analysis: ACK RTT vs Initial RTT
When ACK RTT is greater than iRTT, it indicates that latency has increased compared to the baseline established during the TCP handshake.
This means the network or endpoints are introducing additional delay during the session, commonly due to:
- Network congestion or queueing
- Receiver or application processing delays
- Intermediate devices (firewalls, load balancers)
- Retransmissions
If this condition persists throughout the TCP session, it leads to:
- Reduced TCP throughput
- Inefficient window utilization
- Degraded application performance
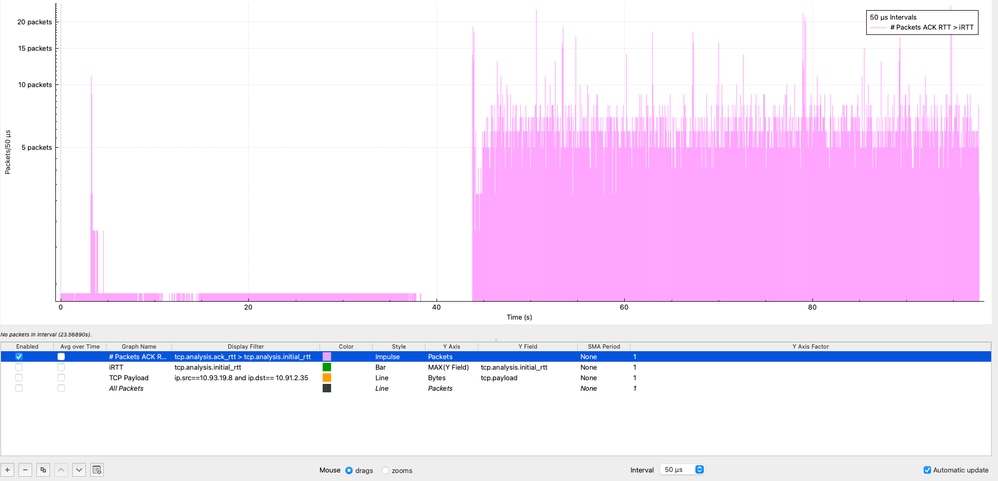
In Wireshark, it is possible to visualize how often the condition ACK RTT > iRTT occurs by using the I/O Graphs feature under: Statistics → I/O Graphs, applying the display filter (tcp.analysis.ack_rtt > tcp.analysis.initial_rtt), selecting Impulse style, setting the Y Axis to Packets, and using an interval of 50 microseconds.
In the graph, the purple impulses represent the number of packets that meet this condition within each 50-microsecond interval. As observed, this condition persists throughout the entire packet capture, indicating that latency during the session is consistently higher than the initial baseline. This behavior strongly suggests sustained performance degradation rather than a transient condition, reinforcing the need to investigate potential sources such as congestion, buffering, or endpoint processing delays across the end-to-end path.
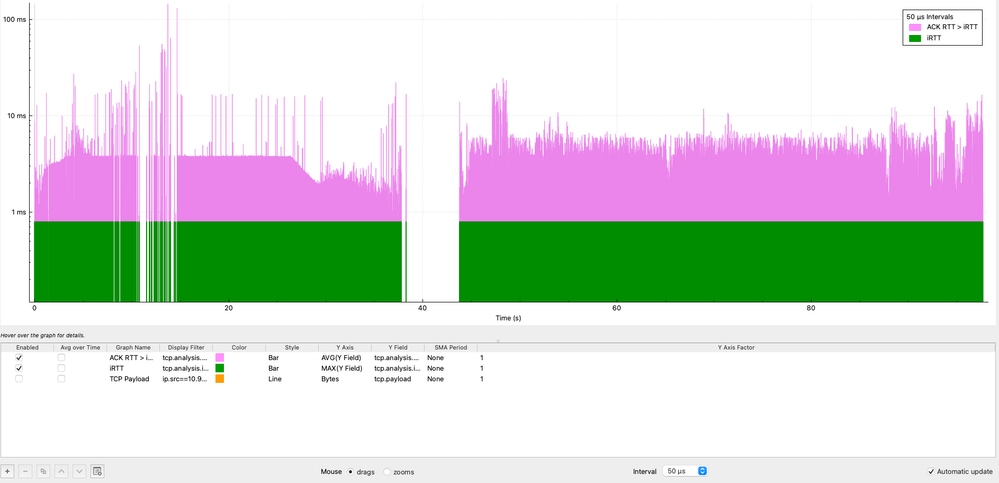
It is also important to determine for how long the iRTT is being exceeded, not just how often. While Wireshark does not directly allow subtraction between fields, a visual comparison can be achieved using I/O Graphs:
- Navigate to Statistics → I/O Graphs
- Graph 1:
- Display Filter: tcp.analysis.ack_rtt > tcp.analysis.initial_rtt
- Style: Bar
- Y Axis: AVG
- Y Field: tcp.analysis.ack_rtt
- Interval: 50 microseconds
- Graph 2:
- Display Filter: tcp.analysis.initial_rtt
- Style: Bar
- Y Axis: MAX
- Y Field: tcp.analysis.initial_rtt
- Then right-click on the graph and enable Log scale.
In this visualization, the purple graph represents the condition ACK RTT > iRTT, which is consistently present throughout the entire TCP session. The data shows sustained latency inflation, with multiple peaks reaching 11 milliseconds and a maximum spike of over 100 milliseconds, representing 11x to 100x the baseline iRTT.
This behavior confirms that the latency increase is not transient but persistent, indicating a systemic issue affecting the session over time. Such sustained deviation strongly suggests factors like network congestion, buffering (bufferbloat), or endpoint processing delays.
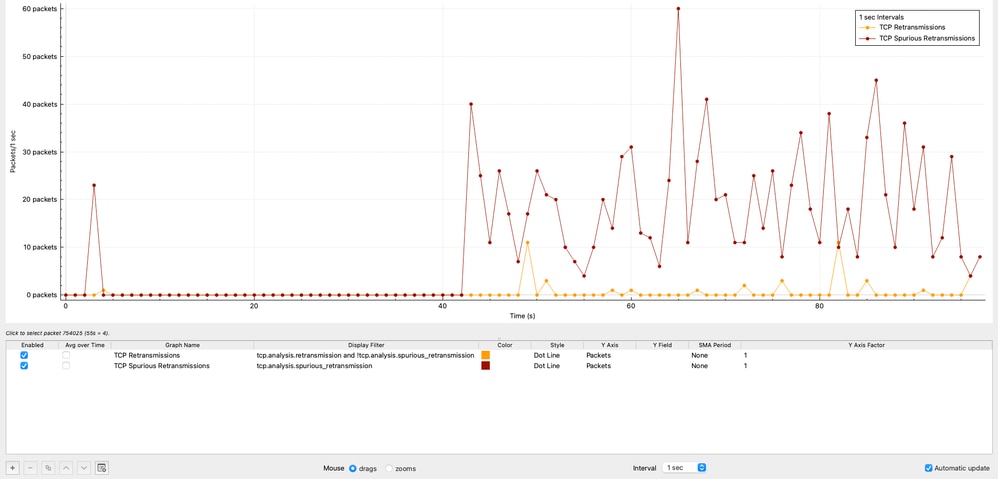
TCP Retransmissions and Spurious Retransmissions Analysis
This section evaluates TCP reliability by analyzing retransmissions over time, allowing validation of whether packet loss is contributing to performance degradation.
TCP Retransmissions Over Time
The graph shows the distribution of TCP retransmissions over time. A total of 42 retransmissions were observed, representing only 0.00125% of the total traffic.
This level of retransmissions is negligible and clearly indicates that packet loss is not a contributing factor in this scenario.
Wireshark Configuration (TCP Retransmissions)
Statistics → I/O Graphs
- Display Filter:
tcp.analysis.retransmission and !tcp.analysis.spurious_retransmission
- Style: Impulse or Bar
- Y Axis: Packets
- Interval: 1 sec
TCP Spurious Retransmissions
The graph shows the number of TCP Spurious Retransmissions in 1 sec intervals generated by the source 10.93.19.8.
In Wireshark, a TCP Spurious Retransmission indicates that a host retransmitted a segment that was not actually lost. The original packet successfully reached the receiver, but the sender incorrectly assumed loss due to inaccurate timing estimation. This behavior does not indicate real packet loss, but rather inefficient retransmission logic at the sender.
In this capture:
- The source 10.93.19.8 retransmits packets after only ~8 microseconds.
- While typical retransmission timers are in the order of ~200 milliseconds.
This confirms that the retransmission behavior is entirely controlled by the source TCP stack, not by the network.
The total number of spurious retransmissions observed is 1,112, representing 0.0332% of the total captured traffic.
Wireshark Configuration (TCP Spurious Retransmissions)
Statistics → I/O Graphs
- Display Filter:
tcp.analysis.spurious_retransmission and ip.src==10.93.19.8
- Style: Impulse or Bar
- Y Axis: Packets
- Interval: 1 sec
Technical Interpretation
- The extremely low percentage of real retransmissions confirms that packet loss is not present in the network.
- The presence of spurious retransmissions indicates premature retransmission decisions by the source host.
- This behavior can slightly impact efficiency but is not a primary cause of severe throughput degradation.
This analysis further reinforces that the issue is not related to network reliability, but rather to TCP behavior, latency, or endpoint performance.
Effective Throughput Analysis
The graph shows the effective throughput, calculated based on TCP payload (actual data transferred) in Megabits per second. The observed throughput oscillates primarily between 600 Mbps and 800 Mbps, indicating that while the network is actively transferring data, it is not reaching higher bandwidth potential.
Wireshark Configuration (Effective Throughput)
Statistics → TCP Streams Graphs → Throughout
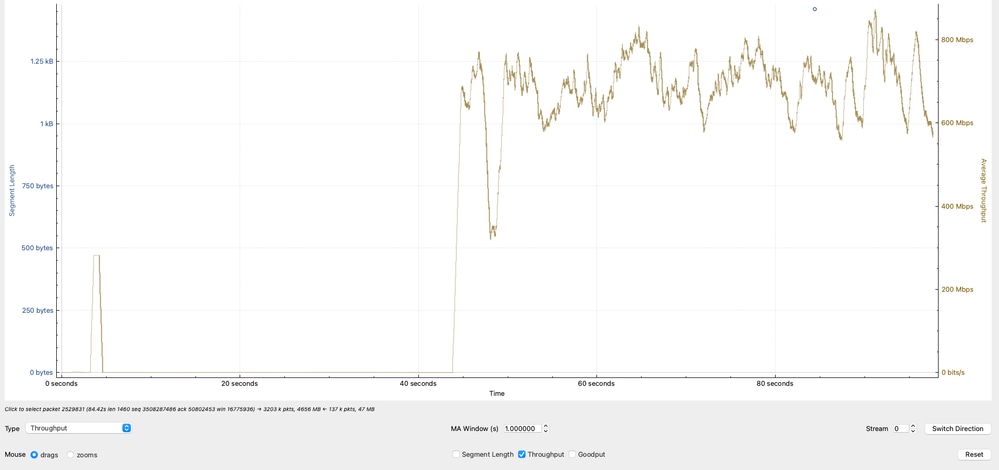
Technical Interpretation
- The throughput range of 600–800 Mbps aligns with previous calculations based on TCP window size and RTT.
- Variability in throughput reflects:
- RTT fluctuations
- TCP congestion control adjustments
- Application pacing or buffering
- Since the throughput does not approach line rate (for example,10G), the limitation is not physical bandwidth but rather TCP efficiency constraints.
- This analysis confirms that the observed throughput is consistent with TCP limitations (window size and latency), reinforcing that the bottleneck is not due to packet loss or interface capacity, but due to transport-layer behavior and endpoint conditions.
Data in Flight (TCP Window) Analysis
The graph highlights a critical behavior in the TCP session by comparing the receiver capacity versus the actual data in transit (bytes in flight).
- The green line represents the amount of TCP data that 10.91.2.35 (receiver) can accept (effective receive window).
- The blue line represents the amount of TCP data currently in flight from 10.93.19.8 (sender).
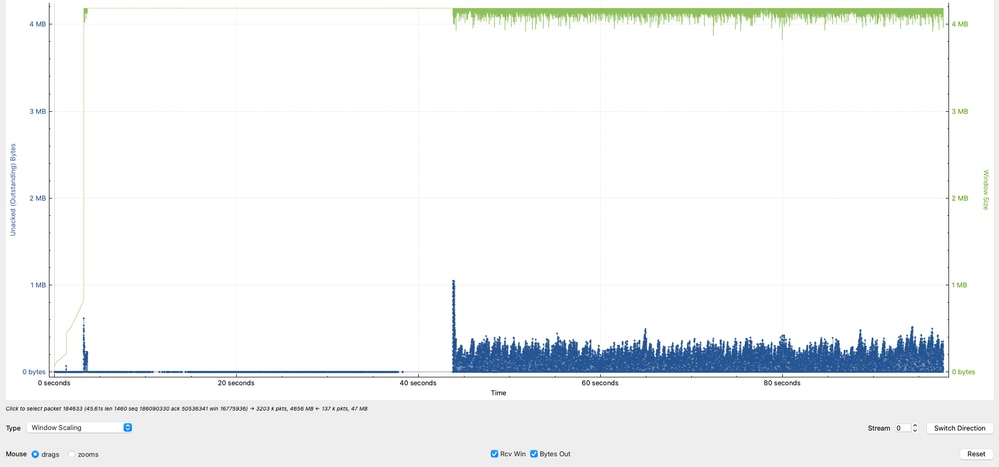
The observed Data in Flight peaks at approximately 1 MB, with additional peaks around 8 KB and 5 KB, but it is primarily concentrated between 1 KB and 250 KB.
This indicates that although the receiver is capable of handling larger volumes of data, the sender is not consistently utilizing the available window.
Wireshark Configuration (Data in Flight vs Window)
Statistics → TCP Streams Graphs → Throughout Technical Interpretation
- The receiver (10.91.2.35) advertises a significantly larger window, indicating it is capable of receiving more data.
- The sender (10.93.19.8) is underutilizing the available window, as shown by the lower and inconsistent Data in Flight values.
- The sender can ideally maintain Data in Flight values closer to the receivers advertised window (~1 MB) to maximize throughput.
- The inability to sustain high in-flight data levels directly limits throughput and is a strong indicator of TCP inefficiency at the source, not a network capacity issue.
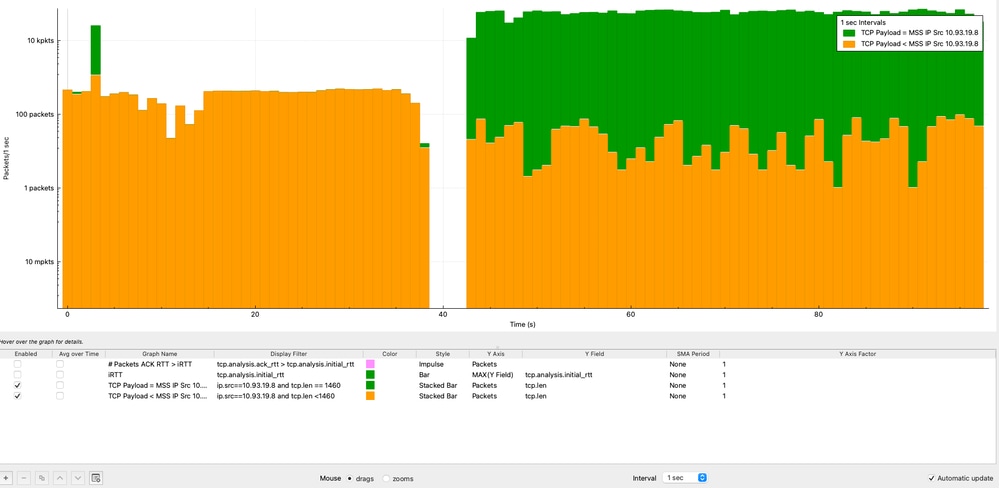
TCP Payload vs MSS Over Time Analysis
Analyzing TCP payload size against MSS over time helps determine whether the sender is efficiently utilizing each TCP segment. This analysis is performed from the perspective of the source IP address (10.93.19.8).
In Wireshark, the graphs are configured as follows:
- Graph 1 (MSS-sized packets):
- Display Filter: ip.src==10.93.19.8 and tcp.len == 1460
- Style: Stacked Bar
- Y Axis: Packets
- Interval: 1 second
- Graph 2 (all packets ≤ MSS):
- Display Filter: ip.src==10.93.19.8 and tcp.len <= 1460
- Style: Stacked Bar
- Y Axis: Packets
- Interval: 1 second
- Apply Logarithmic scale for better visualization
From the analysis:
- The majority of packets (>10,000 packets per second) consistently reach the MSS value of 1460 bytes.
- A smaller portion of packets carry less payload due to normal TCP behavior (ACKs, segmentation, or end-of-stream data).
Root Cause Analysis (RCA): TCP Performance Degradation
This analysis demonstrates that identifying the root cause of TCP performance issues requires a holistic, end-to-end approach, rather than assuming the network is the primary source of degradation.
Extensive validation was performed on the Cisco Nexus 9300 switch, including interface counters, QoS policies, routing and ARP stability, CPU punt verification, SPAN-based packet capture, and ASIC-level forwarding validation using ELAM. All results consistently confirmed that the switch was operating within expected parameters:
- No packet drops
- No abnormal latency (microsecond range)
- No QoS or control-plane impact
- Correct hardware forwarding
Additionally, TCP analysis revealed:
- Negligible retransmissions (0.00125%)
- No evidence of packet loss
- Consistent MSS utilization at the source
- Throughput aligned with TCP window and RTT constraints
- Underutilization of available TCP window (Data in Flight analysis)
- The network is not the bottleneck
- The source server is limiting performance
Conclusion
The performance degradation is caused by the source server operating with MTU 1500 in a jumbo-capable environment, preventing efficient use of the available network capacity.
Solution
Increase the MTU on the source server from 1500 to 9000 bytes to align with the destination and network infrastructure. The benefits:
- Enable larger TCP segments
- Reduce packet overhead
- Improve overall throughput
Technical Reflection
A key takeaway from this analysis is the importance of avoiding premature conclusions when troubleshooting network performance. While it is common to initially attribute issues to the network, this case clearly demonstrates that the network was functioning correctly throughout the entire data-plane path. Only by performing deep TCP analysis from both the source and destination perspectives—including handshake parameters, RTT behavior, window utilization, retransmissions, and payload efficiency—was it possible to accurately identify the true bottleneck.
Taking the time to analyze TCP behavior in detail prevents misdiagnosis, reduces unnecessary network changes, and ensures that remediation efforts are directed at the actual root cause.
Revision History
| Revision | Publish Date | Comments |
|---|---|---|
2.0 |
07-May-2026
|
Updated Title per Author Request. |
1.0 |
06-May-2026
|
Initial Release |
 Feedback
Contact Cisco
- Open a Support Case

- (Requires a Cisco Service Contract)