Troubleshooting Network Latency and Packet Drops on Catalyst 9000 Switches
Available Languages
Contents
Introduction
This document describes a detailed methodology for troubleshooting network latency and packet loss issues on Cisco Catalyst 9000 Series switches.
Prerequisites
Requirements
Cisco recommends that you have a fundamental understanding of networking concepts, including TCP/IP, VLANs, and Spanning Tree Protocols (STPs). Knowledge of Cisco Catalyst 9000 Series switches and the Cisco IOS® XE CLI is essential. Familiarity with network monitoring tools and access privileges for configuration and diagnostics are also required.
Components Used
The information in this document is based on Cisco Catalyst 9000 Switches with all versions. This document is not restricted to any specific software or hardware versions.
The information in this document was created from the devices in a specific lab environment. All of the devices used in this document started with a cleared (default) configuration. If your network is live, ensure that you understand the potential impact of any command.
Background Information
This document is designed for network administrators and engineers, providing guidance to efficiently identify, isolate, and resolve these issues within enterprise network environments. Network latency and packet drop can adversely affect performance and reliability in enterprise environments. These issues often result from network congestion, misconfiguration, or environmental factors. Cisco Catalyst 9000 Series switches are engineered for high performance and resiliency. This document provides focused troubleshooting steps to help network professionals identify and resolve latency and packet drop problems using these switches.
Understanding Network Latency and Packet Drops
Network Latency
Network latency is the measurement of delay experienced as data traverses a network from source to destination. Most commonly, latency is expressed as Round Trip Time (RTT) — the time it takes for a packet to travel from the source to the destination and back.
Latency is typically measured in milliseconds (ms).
Impact: High latency can degrade application performance, especially for protocols like TCP, which rely on timely acknowledgments to send data efficiently.
Packet Drops
Packet drops occur when network devices are unable to forward packets to their intended destination, often due to congestion, buffer overflows, misconfigurations, or faulty hardware. Packet drops are typically measured as a percentage of lost packets over a specific interval.
Impact: Packet drops reduce throughput, cause retransmissions, and can disrupt application reliability.
Expected Latency Benchmarks
| Network Type |
Typical RTT |
| Same VLAN (Access Layer) |
< 1 ms |
| Campus Core Traversal |
1 – 5 ms |
| Metro WAN |
5 – 30 ms |
| Internet/WAN |
30 – 150 ms |

Note: Geographical distance between network hops can increase RTT and contribute to higher latency.
Measure Network Latency
Begin by thoroughly understanding your network and its topology. When your network is designed with deterministic variables and minimal unpredictability, the process of identifying and resolving latency and packet drop issues becomes significantly more straightforward.
Two main tools are usually used to measure Network Latency.
Ping
It returns as output whether a destination is reachable along with statistics about packet loss and RTT. As soon as you identify the problematic hops, you can try to ping between them directly and check in the devices in order to find the problem.
Switch#ping 8.8.8.8
Type escape sequence to abort.
Sending 5, 100-byte ICMP Echos to 8.8.8.8, timeout is 2 seconds:
!.!!.
Success rate is 60 percent (3/5), round-trip min/avg/max = 12/15/22 ms     <===== 2 dropped out of 5 packets, Average RTT 15 ms
Traceroute
Traceroute shows all the hops in the routing path from source to destination along with RTT results for each hop. For instance, a traceroute can show where in the network (which hop in the routing path) the delay exists or starts. Such an example is shown in the next traceroute output.
Switch#traceroute 8.8.8.81 2 ms 2 ms 2 ms [10.10.10.10]
Type escape sequence to abort. Tracing the route to 8.8.8.8
2 2 ms 1 ms 1 ms [20.20.20.20]
3 7 ms 45 ms 40 ms [30.30.30.30] <===== High latency at this hop
4 7 ms 3 ms 1 ms [40.40.40.40]
Note: The IP addresses shown for each hop are provided for demonstration purposes only.
This output indicates a probable delay at hop 3, as evidenced by a significant increase in RTT between hop 2 and hop 3. The relatively small time difference between hop 3 and hop 4 suggests that the issue is localized to the segment between 20.20.20.20 and 30.30.30.30.
Common Causes of Latency and Packet Drops
Layer 1 (Physical Layer) Issues
Layer 1 issues are a common source of network latency and packet drops. It is important to verify these aspects at the physical layer:
- Verify that duplex and speed settings are correctly configured on all interfaces.
- Check interfaces for CRC, input errors, which can indicate physical layer issues.
- Faulty network cables, fiber connections, SFP modules, or switch ports can also cause packet delay and drops.
Switch#show interface gi1/0/1
GigabitEthernet1/0/1 is up, line protocol is up
  Hardware is Gigabit Ethernet, address is 70b3.171d.c101
  MTU 1500 bytes, BW 1000000 Kbit/sec, DLY 10 usec,
  Full-duplex, 1000Mb/s, media type is 10/100/1000BaseTX
  ...
  5 minute input rate 2000 bits/sec, 5 packets/sec
  5 minute output rate 3000 bits/sec, 8 packets/sec
     250000 packets input, 22000000 bytes, 0 no buffer
     Received 300 broadcasts (200 multicasts)
     0 runts, 0 giants, 0 throttles
     85 input errors, 85 CRC, 0 frame, 0 overrun, 0 ignored     <===== Input errors and CRC
     0 watchdog, 0 multicast, 0 pause input
  ...
     260000 packets output, 23000000 bytes, 0 underruns
     5 output errors, 0 collisions, 0 interface resets
     0 unknown protocol drops
     0 babbles, 0 late collision, 0 deferred
     0 lost carrier, 0 no carrier, 0 pause output

Switch# show interfaces counters errors
Port        Align-Err  FCS-Err    Xmit-Err  Rcv-Err  UnderSize  OutDiscards
Gi1/0/1     0          0         0         0       0          0
Gi1/0/2     0          0          0         0        0          0
...
Output Drops
Output drops occur when a transmit queue of a switch interface is full and cannot forward additional packets. This can lead to increased latency as packets wait in the queue, and can also result in packet drops if the queue overflows, impacting application performance and network reliability.
Switch#show interface gi1/0/1
GigabitEthernet1/0/1 is up, line protocol is up
  Hardware is Gigabit Ethernet, address is 70b3.171d.c101
  MTU 1500 bytes, BW 1000000 Kbit/sec, DLY 10 usec,
  Full-duplex, 1000Mb/s, media type is 10/100/1000BaseTX
...
  Last input never, output never, output hang never
  Last clearing of "show interface" counters 2d00h
  Input queue: 0/2000/0/0 (size/max/drops/flushes); Total output drops: 4216760900
  Queueing strategy: fifo
  Output queue: 0/40 (size/max)
  5 minute input rate 389946000 bits/sec, 84175 packets/sec
  5 minute output rate 694899000 bits/sec, 106507 packets/sec
     7885666654 packets input, 4677291827948 bytes, 0 no buffer
...
The Total output drops counter shows a large number of dropped packets, indicating congestion or queue overflow on this interface. This can lead to increased latency and packet loss, affecting network and application performance.
STP Stability
STP instability can significantly contribute to network latency and packet drops. In a stable network, topology changes must be minimal. Frequent topology changes can indicate underlying issues and can disrupt normal forwarding operations.
Key considerations for minimizing STP-related latency:
Topology Changes (TCNs): Excessive STP topology changes can result in frequent flushing of the MAC address of the switch (CAM) table, causing increased broadcast traffic and latency as switches flood unknown unicast packets until the table is repopulated.
Edge Port Configuration: Ensure all edge ports are configured with PortFast. Enabling PortFast prevents STP Topology Change Notifications (TCNs) from being generated when clients or servers connect or disconnect, which reduces unnecessary CAM table aging and improves stability.
Root Bridge Planning: Manually plan and assign STP root bridge and priorities in order to maintain predictable network topology and minimize unnecessary topology changes.
When a topology change occurs (such as a port transitioning states), the switch sends a TCN BPDU towards the root bridge. The root bridge then propagates TCN BPDUs to all switches, prompting them to shorten their MAC address aging time from the default (300 seconds) to the Forward Delay value (typically 15 seconds). This causes recently idle entries to be flushed, resulting in more unknown unicasts and increased flooding throughout the network.
Switch#show spanning-tree detail | include ieee|from|occur|is exec

VLAN0705 is executing the ieee compatible Spanning Tree protocol
  Number of topology changes 6233 last change occurred 00:00:03 ago <===== Topology Changes
          from GigabitEthernet1/0/25 <===== From Gi1/0/25
MAC Flapping/Layer 2 Loops
MAC flapping/Layer 2 loops cause network latency and packet drops by continuously updating the MAC address table with the same source MAC on different ports. This constant change disrupts traffic forwarding, leading to interruptions and packet loss. Layer 2 loops worsen the issue by causing broadcast packets in order to circulate endlessly, triggering more MAC flapping and further degrading network performance. Implementing loop prevention protocols like STP is essential to maintain stable network operation and avoid these issues.
In order to configure MAC move notification, use the command mac address-table notification mac-move in global configuration mode.
Mac Flapping logs:
%MAC_MOVE-SW1-4-NOTIF: Host 8c45.0021.0b17 in vlan 152 is flapping between port Po2 and port Po1
%MAC_MOVE-SW1-4-NOTIF: Host 8c45.0021.0b17 in vlan 152 is flapping between port Po2 and port Po1
%MAC_MOVE-SW1-4-NOTIF: Host 8c45.0021.0b17 in vlan 152 is flapping between port Po1 and port Po2
%MAC_MOVE-SW1-4-NOTIF: Host b0f1.ec27.69ea in vlan 154 is flapping between port Po9 and port Po8
Flow Control
When flow control is enabled and a receive buffer of a switch port approaches capacity, the switch sends pause frames to temporarily halt incoming traffic. This process can increase latency as data transmission is intermittently paused. Conversely, if flow control is not enabled or upstream devices do not honor pause frames, incoming traffic can exceed buffer capacity, resulting in buffer overruns and packet drops.
Flow control must be configured carefully, considering the capabilities of all devices in the traffic path. Improper use or misconfiguration can lead to increased latency and packet drops, negatively impacting application performance.
Switch#show interfaces gigabitEthernet 1/0/1

GigabitEthernet1/0/1 is up, line protocol is up (connected)

input flow-control is on, output flow-control is unsupported      <===== Input Flow Control is ON
Input queue: 0/2000/0/0 (size/max/drops/flushes); Total output drops: 6530
5 minute input rate 8000 bits/sec, 8 packets/sec

5 minute output rate 0 bits/sec, 0 packets/s
0 watchdog, 5014620 multicast, 1989 pause input <===== Pause Input
0 unknown protocol drops
0 babbles, 0 late collision,
0 deferred
0 lost carrier, 0 no carrier, 0 pause output

Switch#show controllers ethernet-controller gigabitEthernet 1/0/1
Transmit        GigabitEthernet1/0/1     Receive
0 MacUnderrun frames                0 MacOverrun frames
0 Pause frames                      1878 Pause frames       <===== Pause frames in RX
CPU Utilization
High CPU utilization can lead to increased network latency and packet drops. When the CPU is heavily loaded, the switch can not process control plane traffic, routing updates, or management functions efficiently. This can delay packet forwarding, cause timeouts for protocols like ARP or Spanning Tree, and result in dropped packets, especially for traffic that requires CPU intervention.
Switch#show processes cpu sorted
CPU utilization for five seconds: 95%/8%; one minute: 92%; five minutes: 90%      <===== CPU utilization 93%
 PID Runtime(ms)     Invoked      uSecs   5Sec   1Min   5Min TTY Process
 439 3560284 554004 6426 54.81% 55.37% 48.39% 0 SISF Main Thread   438 2325444 675817 3440 22.67% 28.17% 27.15% 0 SISF Switcher Th
 104      548861       84846       6468 10.76%  8.17%  7.51%   0 Crimson flush tr
 119      104155      671081        155  1.21%  1.27%  1.26%   0 IOSXE-RP Punt Se
Memory Utilization
High memory usage can cause latency and packet drops by overloading the CPU and control plane processes. This overload delays the handling of routing updates, QoS policies, and buffer management, leading to congestion in the packet processing pipeline. Consequently, packets can be dropped or delayed. Thus, high memory utilization impacts network performance by reducing the efficiency of the switch in managing traffic.
Switch#show platform resources

Resource                 Usage                   Max             Warning         Critical        State
----------------------------------------------------------------------------------------------------
Control Processor       25.00%                   100%            90%             95%             W
  DRAM                   3656MB(94%)             866MB           90%             95%             W

High memory logs:
%PLATFORM-4-ELEMENT_WARNING:Switch 2 R0/0: smand:  1/RP/0: Used Memory value 94% exceeds warning level 90%
%PLATFORM-4-ELEMENT_WARNING:Switch 2 R0/0: smand:  1/RP/0: Used Memory value 94% exceeds warning level 90%
%PLATFORM-4-ELEMENT_WARNING:Switch 2 R0/0: smand:  1/RP/0: Used Memory value 94% exceeds warning level 90%
ICMP Redirects and Unreachable Messages
When a packet arrives on a Layer 3 interface and is routed out of the same interface, the switch generates an ICMP redirect message in order to inform the source of a more efficient next hop on the same subnet. This causes the original packet to traverse the vLAN twice, increasing bandwidth usage. Additionally, the ICMP redirect packet itself consumes bandwidth and requires CPU processing, which can lead to CPU interrupts and increased latency. If many such redirects occur, especially during heavy traffic, the CPU load can rise significantly, potentially causing packet drops.
Frequent generation and processing of ICMP unreachable messages can also increase CPU utilization, affecting network performance. High volumes of ICMP unreachable traffic consume CPU resources, which can lead to latency and packet drops.
In order to mitigate these effects, Cisco recommends disabling ICMP unreachable messages and ICMP Redirects on Switch Virtual Interfaces (SVIs) and Layer 3 interfaces using the no ip unreachables and no ip redirects commands. This best practice reduces CPU load and enhances network stability.
Switch#show ip traffic | in unreachable
...
  Rcvd: 194943 format errors, 369707 checksum errors, 3130 redirects, 734412 unreachable
  Sent: 29265 redirects, 14015958 unreachable, 196823 echo, 786959149 echo reply
...

Switch#show platform hardware fed active qos queue stats internal cpu policer

           CPU Queue Statistics
============================================================================================
                                              (default) (set)     Queue        Queue
QId PlcIdx  Queue Name                Enabled   Rate     Rate      Drop(Bytes)  Drop(Frames)
--------------------------------------------------------------------------------------------
0    11     DOT1X Auth                  Yes     1000      1000     0            0
1    1      L2 Control                  Yes     2000      2000     0            0
2    14     Forus traffic               Yes     4000      4000     3296567      2336
3    0      ICMP GEN                    Yes     750       750      0            0
4    2      Routing Control             Yes     5500      5500     1085196      12919
5    14     Forus Address resolution    Yes     4000      4000     51723336     760639
6    0      ICMP Redirect               Yes     750       750      8444220485535  6978564145
...
Traffic Storms
A traffic storm occurs when excessive broadcast, multicast, or unicast packets flood a LAN, overwhelming the resources of the switch and degrading network performance.
Storm control on switches monitors broadcast, multicast, and unicast traffic on physical interfaces and compares it to configured thresholds. When traffic exceeds these limits, the switch temporarily blocks the excessive traffic in order to prevent network degradation. This protects switch resources and maintains overall network stability and performance.
Switch#show interfaces counters

Port            InOctets   InUcastPkts   InMcastPkts   InBcastPkts
Gi1/0/1        125487955     550123004    250123555     105234788
Gi1/0/2           500123        100123         5123          1024
Gi1/0/3           250123         50123         1024           512


Switch#show platform hardware fed switch active qos queue stats internal cpu policer

                         CPU Queue Statistics
============================================================================================
                                              (default) (set)     Queue        Queue
QId PlcIdx  Queue Name                Enabled   Rate     Rate      Drop(Bytes)  Drop(Frames)
--------------------------------------------------------------------------------------------
11   13     L2 LVX Data Pack            Yes     1000      1000     0            0
12   0      BROADCAST                   Yes     750       750      32529067     186363
13   10     Openflow                    Yes     250       250      0            0
14   13     Sw forwarding               Yes     1000      1000     48317658492  245507344
15   8      Topology Control            Yes     13000     16000    0            0
CAM vs ARP Aging Time
CAM (MAC Address Table) aging time versus Address Resolution Protocol (ARP) aging time can also cause network latency and packet drops. This happens because the CAM table, which stores MAC address to port mappings, typically ages out entries faster (default around five minutes) than the ARP table, which stores IP to MAC address mappings (default around four hours). When a MAC address ages out of the CAM table but still exists in the ARP table, the switch no longer knows the specific port to forward unicast traffic for that MAC address. As a result, the switch floods the unicast traffic to all ports in the VLAN, causing network congestion and potential packet loss.
How CAM vs ARP Aging Time Causes Latency and Packet Drops
- When the CAM table entry ages out before the ARP entry, the switch floods unicast packets because it lacks the MAC-to-port mapping.
- This flooding increases CPU load and consumes bandwidth unnecessarily, leading to network latency and packet drops.
- The mismatch can also cause inefficient forwarding and increased control plane processing.
Switch#show mac address-table aging-time
Global Aging Time:  300 <===== MAC aging
Vlan    Aging Time
----    ----------

Switch#show ip arp
Protocol  Address          Age (min)  Hardware Addr   Type   Interface
Internet  192.168.95.1          124   Incomplete      ARPA             <===== Arp age
...

Switch#show interface vlan1
Vlan1 is up, line protocol is up , Autostate Enabled
  Hardware is Ethernet SVI, address is 10b3.d6f0.1347 (bia 10b3.d6f0.1347)
  MTU 1500 bytes, BW 1000000 Kbit/sec, DLY 10 usec,
     reliability 255/255, txload 1/255, rxload 1/255
  Encapsulation ARPA, loopback not set
  Keepalive not supported
  ARP type: ARPA, ARP Timeout 04:00:00
  Last input never, output never, output hang never

Configuring MAC Aging and ARP Timeout:

Switch#confure terminal
Enter configuration commands, one per line.  End with CNTL/Z.

Switch(config)#mac-address-table aging-time ?
  <0-0>         Enter 0 to disable aging
  <10-1000000>  Aging time in seconds

Switch(config)#mac-address-table aging-time 14400 ?
  routed-mac  Set RM Aging interval
  vlan        VLAN Keyword
  <cr>        <cr>

Switch(config)#interface vlan 1
Switch(config-if)#arp timeout 300

Switch(config-if)#do show interface vlan 1

Vlan1 is up, line protocol is up , Autostate Enabled
  Hardware is Ethernet SVI, address is 10b3.d6f0.1347 (bia 10b3.d6f0.1347)
  MTU 1500 bytes, BW 1000000 Kbit/sec, DLY 10 usec,
     reliability 255/255, txload 1/255, rxload 1/255
  Encapsulation ARPA, loopback not set
  Keepalive not supported
  ARP type: ARPA, ARP Timeout 00:05:00
  Last input never, output never, output hang never
Monitor Session
When active monitor (SPAN) sessions are configured on a switch with multiple source and destination ports, they can contribute to network latency and packet drops.
Example:

Session 1
---------
Type                   : Local Session
Source Ports           :
    Both               : Po101,Po105,Po109,Po125,Po161,Po170   <===== Multiple source ports
Destination Ports      : Te9/8
Egress SPAN Replication State:
Operational mode       : Centralized
Configured mode        : Centralized (default)

Session 2
---------
Type                   : Local Session
Source Ports           :
    Both               : Po161,Po170
Destination Ports      : Te9/1
Egress SPAN Replication State:
Operational mode       : Centralized
Configured mode        : Centralized (default)
How SPAN Works
SPAN (Switched Port Analyzer) is a hardware-assisted feature that mirrors traffic from source ports to destination ports without involving CPU lookups. The replication ASIC on the supervisor module handles packet mirroring, while the forwarding engine redirects the mirrored packets to the destination ports. Mirrored packets are switched with the same timing as regular traffic.
Impact of Multiple Source and Destination Ports:
In the earler example, the switch must replicate traffic from all source interfaces to the destination interfaces. For instance, interface Po170’s traffic is mirrored and forwarded twice to two different destinations. This replication increases the load on the forwarding engine and can cause congestion in the switch backplane.
- If a Port-channel carries three GBPS of traffic, replicating this traffic to multiple destinations can result in more than 15 GBPS of mirrored traffic.
- The load on the replication ASIC increases proportionally with the traffic rate on source interfaces.
- At lower traffic rates, latency impact can be minimal, but as traffic increases, latency and congestion can become significant.
ASIC-level Exceptions
Use these command in order to check the interface to ASIC mappings, which shows the ASIC instance where the interface resides.
Switch#show platform software fed switch active ifm mappings
Interface                 IF_ID    Inst Asic Core Port SubPort Mac  Cntx LPN  GPN  Type Active

GigabitEthernet2/0/12     0x13       1     0    1     11     0      20    17   12   108  NIF   Y      <===== ASIC Instance 1 (Asic 0/Core 1)
Once the ASIC instance is identified, run the next command in order to view the forwarding ASIC drop exceptions for that ASIC.
Switch#show platform hardware fed switch active fwd-asic drops exceptions asic <ASIC_INSTANCE>

Example output snippet for ASIC instance 1:

****EXCEPTION STATS ASIC INSTANCE 1 (asic/core 0/1)****
=================================================================================
 Asic/core |                NAME                  |   prev       |  current  |  delta

=================================================================================
0       1  NO_EXCEPTION                         2027072618   2028843223    1770605
0       1  ROUTED_AND_IP_OPTIONS_EXCEPTION     735          735            0
0       1  PKT_DROP_COUNT                      14556203    14556203        0
0       1  BLOCK_FORWARD                      14556171    14556171         0
0       1  IGR_EXCEPTION_L5_ERROR              1            1              0
...
Software Bugs
Software bugs can sometimes directly or indirectly cause unintended and unexpected behaviors. These bugs can result in issues such as network latency, packet drops, or other performance degradations. In order to address these problems, a common first step is to reload the switch, which can clear transient faults and restore normal operation. Additionally, it is crucial to keep your devices up to date by regularly applying the latest firmware and software updates. These updates often include fixes for known bugs and improvements that enhance device stability and performance, helping to prevent issues related to software defects.
Case Study
Problem Details
Users are experiencing intermittent network connectivity loss during attempts in order to transfer large volumes of data across vLANs, such as during high-capacity file transfers. These disruptions manifest as sporadic failures in data transmission despite multiple successful attempts, significantly impacting network reliability and application performance. The issue is temporarily resolved by reloading the switch.
Topology
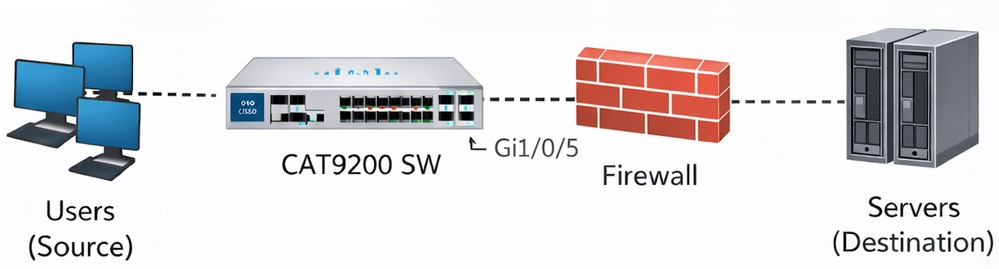
Symptoms Observed
- File transfers between the source and destination intermittently fail after several successful attempts.
- The switch loses connectivity to the firewall during failure periods.
- 802.1X authentication remains operational throughout the incidents.
- The switch remains responsive via the console during the incidents.
- The connected port of the firewall shows only broadcast traffic during failure periods.
- Diagnostic tests (DiagGoldPktTest) consistently fail on interface Gi1/0/5, indicating a data path issue.
Troubleshooting Performed
- Interface counters and platform-level buffer statistics are reviewed.
- The switch interface Gi1/0/5 shows a very high volume of 802.3x pause frames received from the firewall.
- Output drops and pause frame statistics are closely monitored.
- Platform software forwarding engine queue statistics are examined to identify buffer behavior.
- Flow control settings on the switch interface are checked.
Relevant Interface Statistics
Switch#show interfaces GigabitEthernet 1/0/5


GigabitEthernet1/0/5 is up, line protocol is up (connected)

input flow-control is on, output flow-control is unsupported                <===== Input Flow-control is ON

Input queue: 0/2000/0/0 (size/max/drops/flushes); Total output drops: 78444
5 minute input rate 8000 bits/sec, 8 packets/sec

5 minute output rate 0 bits/sec, 0 packets/s   <===== Output rate is 0
0 watchdog, 5014620 multicast, 1989 pause input
0 unknown protocol drops
0 babbles, 0 late collision,
...

Switch#show controllers ethernet-controller GigabitEthernet 1/0/5

Transmit        GigabitEthernet1/0/5.     Receive
0 MacUnderrun frames                0 MacOverrun frames
0 Pause frames                           1878 Pause frames                   <===== Pause Frames In RX
...


Switch#diagnostic start switch 1 test DiagGoldPktTest port 5

Switch#show diagnostic result switch 1 test DiagGoldPktTest detail


Test results: (. = Pass, F = Fail, U = Untested)
______________________________________________________
1) DiagGoldPktTest:
 Port 1 2 3 4 5 6 7 8 9 10 11 12 13 14 15 16 17 18 19 20 21 22 23 24

      U U U U F U U U U U U U U U U U U U U U U U U U.                       <===== DiagGoldPktTest Failed For Port 5
Port 25 26 27 28
----------------
U U U U


Switch#show flowcontrol interface GigabitEthernet 1/0/

Port Send FlowControl           Receive FlowControl RxPause TxPause
        admin   oper              admin  Oper
------------ -------- -------- -------- -------- ------- -------
Gi1/0/5 Unsupp. Unsupp.         on     on.         13256          0          <===== Pause Frames In RX

Switch#show platform hardware fed switch active qos queue stats interface GigabitEthernet 1/0/5

Asic:0 Core:0 DATA Port:8 Hardware Drop Counters

--------------------------------------------------------------
Q   Drop-TH0     Drop-TH1      Drop-TH2      SBufDrop          QebDrop

   (Bytes)        (Bytes)       (Bytes)       (Bytes)              (Bytes)

--------------------------------------------------------------
0     0               0         18106020           0                0
Root Cause Identified
The root cause was identified as buffer lockup due to excessive 802.3x pause frames sent by the Firewall to the switch interface. Ethernet pause frames instruct the switch to stop transmitting in order to allow the receiving device to recover from congestion. However, when pause frames are sent repeatedly or for extended durations:
- The output queue of the switch buffer for the interface becomes fully saturated.
- The switch continues to accept incoming packets destined for the paused interface, which accumulate in the output queue.
- The queue saturation leads to output drops and traffic blackholing.
- In this case, the buffers became locked, and forwarding did not resume even after the pause frame rate decreased.
- A switch reload was required to clear the locked buffer state.
This behavior is documented in Cisco bug CSCwm14612 which describes how overwhelming pause frames cause the interface to incorrectly hold buffers, resulting in output drops.
Resolution
Input flow control was disabled on the affected switch interface using the command:
Switch#configure terminal
Switch(config)#interface GigabitEthernet 1/0/5
Switch(config-if)#flowcontrol receive off
Conclusion
The intermittent network connectivity failures and packet drops between the Cisco C9200L switch and Firewall were caused by a software queue lockup triggered by an excessive volume of 802.3x pause frames. Disabling input flow control on the switch interface resolved the issue by preventing the queue from becoming saturated and locked.
Related Information
- Troubleshoot Output Drops on Catalyst 9000 Switches
- Troubleshoot STP Issues on Catalyst Switches
- Troubleshoot MAC Flaps/Loop on Cisco Catalyst Switches
- Cisco Technical Support & Downloads
Revision History
| Revision | Publish Date | Comments |
|---|---|---|
1.0 |
20-Mar-2026
|
Initial Release |
 Feedback
Contact Cisco
- Open a Support Case

- (Requires a Cisco Service Contract)