Troubleshoot ACI Fabric Port-Track
Available Languages
Contents
Introduction
This document describes ACI Fabric Port Tracking Feature, steps for remediation, and corner case scenarios.
Overview
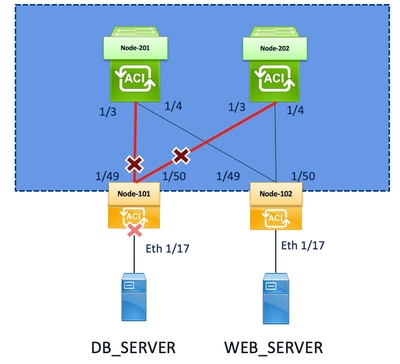
Cisco ACI Fabric Port-Track, also referred to as Fabric Track or Port Tracking, is a resiliency feature used on ACI leaf switches to control the state of host-facing/downlink ports based on the operational state of fabric-facing/uplink ports.
Fabric Port-Track is designed to prevent traffic blackholing when a leaf loses sufficient connectivity to the ACI fabric. Without this feature, a host-facing interface can remain physically up even if the leaf has lost its fabric uplinks. In that condition, connected endpoints can continue forwarding traffic to the leaf, but the leaf must be unable to forward that traffic into the fabric.
When Fabric Port-Track is enabled, the leaf monitors its active fabric uplinks toward the spine layer and compares the number of operational fabric links against the configured threshold. If the number of available fabric links drops under the configured minimum, the leaf automatically brings down selected host-facing/downlink interfaces. This allows attached endpoints, servers, or external devices to detect the link-down event and fail over to another available path or leaf instead of continuing to send traffic to a leaf that no longer has sufficient fabric connectivity.
Once the required number of fabric uplinks is restored and the number of operational fabric links recovers over the configured threshold, the downlink interfaces are brought back up after the configured restore delay.
Example behavior:
- Leaf has two uplinks to spines.
- Fabric Port-Track is enabled.
- Minimum active fabric links threshold is not satisfied.
- Leaf disables host-facing/downlink interfaces.
- Connected servers or external switches detect the link-down event and fail over.
- After fabric connectivity is restored, the leaf re-enables host-facing ports after the configured delay.
Topology
Recommended Troubleshooting Checklist
Use the checklist when investigating Cisco ACI Fabric Port-Track issues. Each step includes the relevant verification or troubleshooting commands.
Confirm the Symptom
Verify whether host-facing/downlink ports are down and whether the event is related to Fabric Port-Track.
Check for Fabric Port-Track fault F0532:
moquery -c faultInst -f 'fault.Inst.code=="F0532"'
Example indication:
descr    : Port is down, reason being fabricTrack(connected)
severity : critical
subject  : port-down
If fault F0532 is present, the interface was brought down due to Fabric Port-Track.
Verify the Fabric Port-Track Policy
Confirm whether Fabric Port-Track is enabled and review the configured parameters.
moquery -c infraPortTrackPol | egrep "adminSt|delay|includeApicPorts|minlinks"
Review the presented values:
| Parameter | Purpose |
|---|---|
| adminSt | Indicates whether Fabric Port-Track is enabled or disabled. |
| delay | Restore delay before downlink ports are re-enabled. |
| includeApicPorts | Indicates whether APIC-connected ports are included. |
| minlinks | Minimum number of operational fabric links required. |
Example:
adminSt          : on
delay            : 300
includeApicPorts : no
minlinks         : 0
Validate Fabric Uplink LLDP Neighbors
Confirm that the leaf still sees expected spine neighbors over fabric uplinks.
show lldp neighbors
For detailed information about a specific fabric uplink:
show lldp neighbors int ethernet 1/49 detail
Use this output to confirm:
- Local leaf interface.
- Remote spine node.
- Remote spine interface.
- LLDP hold time.
- Whether the expected neighbor is still present.
Check Fabric Uplink Interface State and Flap History
Verify whether the fabric-facing interface recently flapped.
show int eth 1/49 | egrep "flapped|state"
Example:
admin state is up, Dedicated Interface
  Last link flapped 00:02:57
A recent flap on the fabric uplink can explain why Fabric Port-Track was triggered.
Check Affected Downlink Interface State
Verify the state and flap history of the host-facing/downlink interface.
show int eth 1/17 | egrep "flapped|state|fabric-track"
This helps correlate the downlink port event with the fabric uplink failure.
Review Fabric Port-Track Debug Logs
Check the Fabric Port-Track process log on the affected leaf.
cat /var/sysmgr/tmp_logs/fabric_track.py.dbg | tail -n 15
Example log output during normal operation:
cat /var/sysmgr/tmp_logs/fabric_track.py.dbg | tail -n 15
 Reading the port track Mo
...
 Reading the port track Mo
Example log file during the failure window:
cat /var/sysmgr/tmp_logs/fabric_track.py.dbg | tail -n 15
Reading Isis Mo to check for Isis Adjacency
1 Fabric links are up
Reading l1PhysIf Mos of fabric links to check number of up fabric links
Bringdown: 0 Fabric links left up
PortTrackIf Mo is not present. Creating PortTrackIf Mo for eth1/17
Committing the port track Mo
These messages indicate that the leaf detected insufficient fabric links and created PortTrack interface objects for affected downlink ports.
Key observations:
- The leaf detected one fabric link up.
- Shortly afterward, it detected zero fabric links up.
- Fabric Port-Track created PortTrack If managed objects for affected interfaces.
- The downlink interface, such as eth1/17, was brought down.
Inspect Transceiver Details
Collect optic information for the affected fabric uplink.
show interface ethernet 1/49 transceiver details | egrep "type|name|serial"
Example:
type is QSFP-40/100-SRBD
name is CISCO-FINISAR
serial number is FIW2440004Z-B
This is especially important when troubleshooting:
- Optical faults.
- BiDi optics.
- Passive TAPs.
- Monitoring tool interaction.
- Unexpected link flaps.
Map the Physical Interface to the Internal Port
Identify the internal port number associated with the physical interface.
vsh_lc -c 'show platform internal usd port info' | egrep "Eth1/49" -A 1
Example:
Port  61.0 (Eth1/49)  : Admin UP  (1) Link UP   Cfg_Fec Disabled Fec Disabled Fcot Fiber retimer 0x0
                AN_knob No AN_cfg Yes   AN_operSt No In_debounce 0, Debounce-Time 0 usecs qsa: No
In this example, Eth1/49 maps to internal port 61.0.
Review Platform Link Event History
After identifying the internal port, review the link event history.
vsh_lc -c 'show platform internal tah event-history linkevents' | grep Port "61.0" -A 1
Example without debounce:
Port 61.0: tahusd_port_handle_debounce: No debounce required!!
Example with debounce configured:
Port 61.0: tahusd_port_handle_debounce/9481: Started Debounce Timer for 10000 ms
This confirms whether link debounce was applied during the link event.
Check and Configure Link Debounce if Required
Verify whether link debounce is configured for fabric interfaces. Link debounce can help prevent transient microflaps from immediately triggering Fabric Port-Track behavior.
Check the fabric interface policy:
moquery -c fabricFIfPol | egrep "dn|linkDebounce"
Example:
dn           : uni/fabric/fintfpol-default
linkDebounce : 0
Check debounce directly from the interface:
show interface eth1/49 debounce
Example without debounce:
------------------------------------------------------------------------------------
 Port          Debounce time  Value(ms)
------------------------------------------------------------------------------------
 Eth1/49       disable                0
If debounce is disabled and microflaps are suspected, configure debounce on the fabric interface:
configure
leaf 101
interface ethernet 1/49
link debounce time 100
Important:
- The value is in milliseconds.
- 100 equals 1 second.
Verify the configuration:
show interface eth1/49 debounce
Expected output:
------------------------------------------------------------------------------------
 Port          Debounce time  Value(ms)
------------------------------------------------------------------------------------
 Eth1/49       enable                100
The default debounce interval is 0 ms. We recommend a value of 100 ms, but you can choose a value that is appropriate to your fabric.
Consolidated Command Reference
| Task | Command |
|---|---|
| Check Fabric Port-Track fault | moquery -c faultInst -f 'fault.Inst.code=="F0532"' |
| Verify Fabric Port-Track policy | moquery -c infraPortTrackPol | egrep "adminSt|delay|includeApicPorts|minlinks" |
| Check LLDP neighbors | show lldp neighbors |
| Check detailed LLDP neighbor | show lldp neighbors int ethernet 1/49 detail |
| Check fabric uplink state | show int eth 1/49 | egrep "flapped|state" |
| Check downlink state | show int eth 1/17 | egrep "flapped|state|fabric-track" |
| Check Fabric Port-Track debug log | cat /var/sysmgr/tmp_logs/fabric_track.py.dbg | tail -n 15 |
| Check transceiver details | show interface ethernet 1/49 transceiver details | egrep "type|name|serial" |
| Map physical interface to internal port | vsh_lc -c 'show platform internal usd port info' | egrep "Eth1/49" -A 1 |
| Check platform link events | vsh_lc -c 'show platform internal tah event-history linkevents' | grep Port "61.0" -A 1 |
| Check fabric debounce policy | moquery -c fabricFIfPol | egrep "dn|linkDebounce" |
| Check interface debounce | show interface eth1/49 debounce |
| Configure debounce | link debounce time 10000 |
Corner Case Scenario 1: Interface Did Not Flap, but Fabric Port-Track Triggered
A possible corner case occurs when the physical fabric interface did not flap, but Fabric Port-Track still behaves as if fabric links are unavailable.
Example:
show int eth 1/49 | egrep "flapped|state"
admin state is up, Dedicated Interface
Last link flapped 1y14w
In this scenario, the interface has not recently flapped.
Because Fabric Port-Track relies on managed object queries, verify whether the leaf can successfully perform the relevant moquery:
moquery -c l1PhysIf -x 'query-target-filter=and(anybit(l1PhysIf.usage,"fabric"),eq(l1PhysIf.switchingSt,"enabled"))'
Also check disk utilization, example problematic condition:
df -h
Filesystem Size Used Avail Use% Mounted on
rootfs 2.5G 2.5G 0 100% /bin
If the root filesystem is full, the leaf can drop or fail internal functions, including moquery. As a result, Fabric Port-Track must be unable to confirm that fabric links are up and must incorrectly bring down downlink interfaces.
Recommended action:
- Check available disk space.
- Clear or remediate the filesystem issue according to Cisco guidance.
- Revalidate moquery functionality.
- Confirm that fabric uplinks are detected correctly.
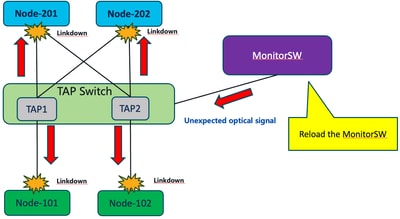
Corner Case Scenario 2: BiDi Optics and Passive TAP Interference
There is an specific issue involving BiDi QSFP optics and passive optical TAPs used for monitoring.
Passive TAP Risk
When passive TAP infrastructure is inserted between a leaf and spine, and monitoring equipment uses regular BiDi optics, the monitoring path can transmit light back into the live production link.
This can cause:
- Unexpected optical signal injection.
- Link-down events on both sides.
- Leaf and spine both reporting remote fault conditions.
- Fabric Port-Track triggering due to transient fabric uplink loss.
This is a scenario where reloading a monitoring switch caused unexpected optical signals, resulting in link-down events toward both leaf and spine.

Standard SR Optics - QSFP-40/100-SRBD
With standard SR optics, transmit and receive paths are separate:
Tx -> Rx
Rx <- Tx
Traffic is unidirectional per fiber.
Recommended Mitigation
For BiDi monitoring scenarios, use appropriate monitor-only BiDi optics that receive only and do not transmit into the production path.

BiDi Optics - QSFP-40G-BD-RX
With BiDi optics, transmit and receive are both present on each fiber:
Tx/Rx <-> Tx/Rx
This is described as a special TAP/monitor BiDi optic where the monitor path only receives signal.
vPC Considerations
For vPC-connected downlink ports, recovery behavior can be affected by both the Fabric Port-Track delay timer and the vPC delay timer.
For vPC configurations, if a leaf node loses all fabric ports and therefore loses ISIS adjacencies, it cannot communicate with its vPC peer. In this condition, downlink ports reactivate after the longer of either the vPC delay timer or the port tracking delay timer.
Operational impact:
- Non-vPC downlink ports must match the Fabric Port-Track restore delay.
- vPC downlink ports can remain down longer if the vPC delay timer is greater than the Fabric Port-Track delay.
Example:
- Fabric Port-Track delay: 300 seconds
- vPC delay timer: 600 seconds
- vPC downlink ports must recover after 600 seconds
Important Note for APIC-Connected Ports
The Cisco bug ID CSCva95547, related to APIC-connected ports and Fabric Port-Track behavior.
A key operational consideration is that APIC-facing ports must generally not be brought down by Fabric Port-Track during transient uplink failures, because this could affect management and controller connectivity.
The include ApicPorts option is used to control whether APIC-connected interfaces are included in the behavior.
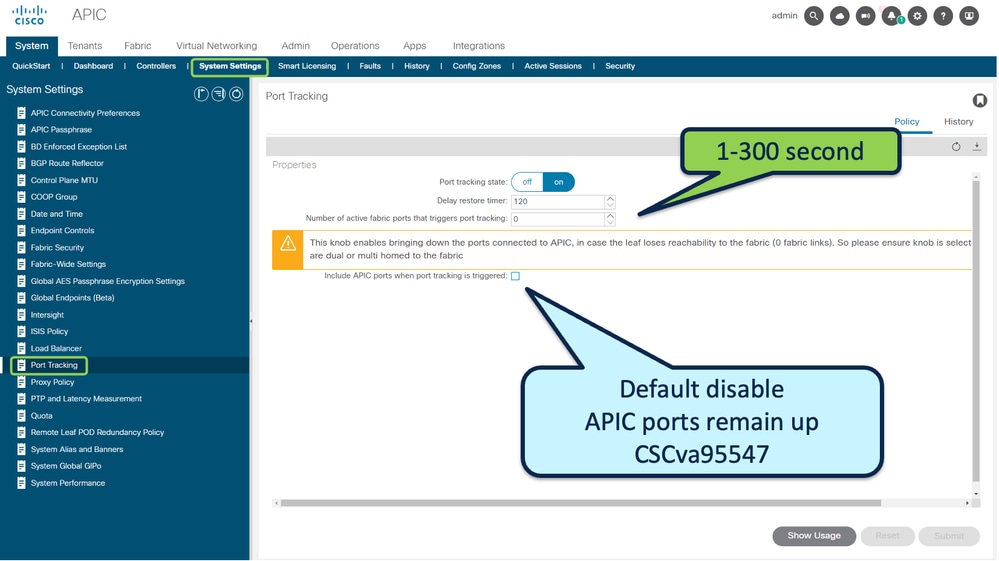
This indicates that APIC-connected ports are excluded from being disabled by Fabric Port-Track.
References
Cisco APIC Layer 2 Networking Configuration Guide > Chapter: Fabric Port Tracking
Cisco Application Centric Infrastructure (ACI) Design Guide > Port Tracking
Reference Bugs:
Revision History
| Revision | Publish Date | Comments |
|---|---|---|
1.0 |
17-Jun-2026
|
Initial Release |
 Feedback
Contact Cisco
- Open a Support Case

- (Requires a Cisco Service Contract)