How to Run Traceroute on a Switch through the Command Line Interface (CLI)
Available Languages
Objective
This article provides instructions on how to run the traceroute command on your switch through the CLI.
In a real-time scenario, a traceroute can be used if the user is having some connectivity problems and the user needs to find whether the packets are delivered to the destination or not. Traceroute can exactly point out where the packets are being dropped if such a problem exists.
Note: To learn how to activate traceroute configuration on your switch through the web-based utility, click here for instructions.
Applicable Devices
- Sx300 Series
- Sx350 Series
- SG350X Series
- Sx500 Series
- Sx550X Series
Software Version
- 1.4.7.05 — Sx300, Sx500
- 2.2.8.4 — Sx350, SG350X, Sx550X
Run Traceroute on the Switch through the CLI
Traceroute can be used to troubleshoot a problem that has occurred across a network connection. When using the Command Line Interface (CLI) of the switch, traceroute discovers and displays the routes that the packets will take when traveling to their destination, allowing the administrator to measure the transit delay of the packets which are traversing through the network. It operates by sending an IP packet to the target host and back to the switch.
Traceroute uses three User Datagram Protocol (UDP) datagrams with Time to Live (TTL) values to operate. TTL is a mechanism that limits the lifespan of data in a network. Every time a packet is sent to a router, the TTL value decrements by one. Once the TTL value reaches 0, the router responds with an Internet Control Message Protocol (ICMP) Time Exceeded Message (TEM) which indicates that the datagram has expired.
At first, traceroute sends three UDP datagrams to the first router with TTL values of one. The first router responds with an ICMP TEM message which provides information for the traceroute feature. Next, traceroute sends three more UDP datagrams with TTL values of two. The second router along the route responds with an ICMP TEM message. This process continues until either of the following are encountered:
- the destination is reached
- the configured max TTL value is reached
- the user interrupts the trace
Run Traceroute Operation
To run the traceroute operation on your switch through the CLI, follow these steps:
Step 1. Log in to the switch console. The default username and password is cisco/cisco. If you have configured a new username or password, enter the credentials instead.

Note: In this example, the switch is accessed through Telnet.
Step 2. In the Privileged EXEC mode of the switch, run the traceroute operation by entering either of the following commands:
SG350X#traceroute ip {{ipv4-address | hostname}} [size packet_size] [ttl max-ttl] [count packet_count] [timeout time_out] [source ip-address]— Use this syntax to traceroute an IPv4 address.
SG350X#traceroute ipv6 {{ipv6-address | hostname}} [size packet_size] [ttl max-ttl] [count packet_count] [timeout time_out] [source ip-address]— Use this syntax to traceroute an IPv6 address.
The description of the parameters are as follows:
- ip — Use IPv4 to discover the route.
- ipv6 — Use IPv6 to discover the route.
- ipv4-address — IPv4 address of the destination host.
- ipv6-address — IPv6 address of the destination host.
- Hostname — The hostname of the destination host. The length ranges from 1 up to 160 characters. The maximum label size for each part of the host name is 58.
- size packet_size — The number of bytes in the packet not including the Virtual Local Area Network (VLAN) tag. The default is 64 bytes. The size ranges from 64 to 1518 bytes for IPv4, and 68 up to 1518 for IPv6.
- ttl max-ttl — The largest TTL value that can be used. The default max TTL value is 30. The traceroute command terminates when the destination is reached or when this value is reached. The TTL value can range from 1 up to 225.
- count packet_count — The number of probes to be sent at each TTL level. The default count is 3 and the count ranges from 1 up to 10.
- timeout time_out — The number of seconds to wait for a response to a probe packet. The default is 3 seconds and the timeout value ranges from 1 up to 60 seconds.
- source ip-address — One of the interface addresses of the device to use as a source address for the probes. The device selects the optimal source address by default. You have to enter a valid IP address for this.
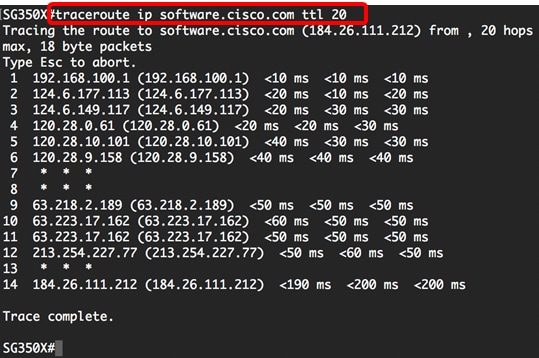
Note: In this example, traceroute ip software.cisco.com ttl 20 is used. Once the command is entered, the switch will automatically conduct the trace.

Step 3. (Optional) To abort the trace, press the escape button  on your keyboard.

Note: In this example, the trace was aborted after three hops.
You should now have successfully run a traceroute operation through the CLI of your switch.
Understand Traceroute Results

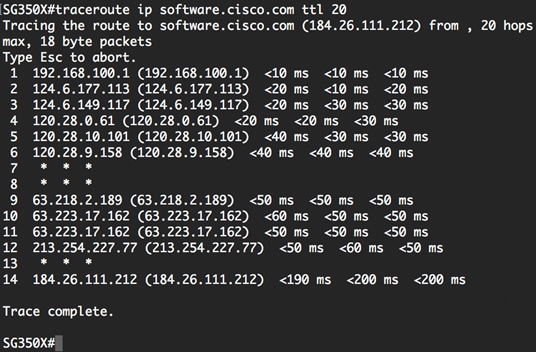
The following table describes the significant fields shown in the image above:
|
Field |
Description |
|---|---|
|
1 to 14 |
Indicates the sequence or hop number of the router in the path to the destination. |
|
192.168.100.1 |
IP address of the router where the switch is connected. |
|
184.26.111.212 |
Internet IP address of the destination server software.cisco.com |
|
<190 ms <200 ms <200 ms |
The total operation time to retrieve data from the destination server shown in the last hop. |
The following table shows the characters that can appear in the traceroute command output:
|
Field |
Description |
|---|---|
|
* |
The probe timed out. |
|
? |
Unknown packet type. |
|
A |
Administratively unreachable. Usually, this output indicates that an access list is blocking the traffic. |
|
F |
Fragmentation required and defragmentation is set. |
|
H |
Host unreachable. |
|
P |
Protocol unreachable. |
|
Q |
Source quench. |
|
R |
Fragment reassembly time exceeded. |
|
S |
Source route failed. |
|
U |
Port unreachable. |
Possible issues indicated by the traceroute hops:
- If you encounter timeouts at the beginning and the report starts showing data after a couple of hops, the router most likely is configured not to answer to traceroute requests.
- If you encounter timeouts at the end of the trace:
-
There could be a connection issue with the destination host.
-
There could be a firewall configured on the destination host to block traceroute requests.
-
There could be an issue with the return path from the target.
-
- If the traceroute report shows latency during the first couple of hops, there could possibly be issues in your local network.
You should now have understood the traceroute results shown on the CLI of your switch.
Revision History
| Revision | Publish Date | Comments |
|---|---|---|
1.0 |
12-Dec-2018
|
Initial Release |
 Feedback