Introduction
This document describes how to generate diagnostic tool output for Cisco Umbrella.
Overview
Support personnel often request diagnostic tool results when troubleshooting complex issues. Users can access the diagnostic tool in different ways depending on their Umbrella interaction.

Tip: These instructions are not for troubleshooting issues with Secure Web Gateway (SWG) Web Policies. Troubleshooting steps for SWG can be found in our article Troubleshooting Umbrella Secure Web Gateway: Policy Debug and Diagnostic Tests.
Umbrella Roaming Client
If a user has the standalone Umbrella Roaming Client, a diagnostic tool is built in. To access it:
Windows
- If using a version lower than 2.3.x, download the diagnostic client manually instead of running the built-in diagnostic.
- Select the Umbrella Roaming Client icon in the system tray.
- A status summary displays. Select the link that states Run Diagnostic Tool.
macOS
- Click the Umbrella Roaming Client icon from the Menu Bar.
- A status summary displays. Click the link at the bottom that states Run Diagnostic Tool.
Cisco AnyConnect Umbrella Roaming Module
For the Cisco AnyConnect Umbrella Roaming module, users must run two tools: the AnyConnect Diagnostics and Reporting Tool (DART) and the Roaming Client Umbrella Diagnostic tool.
Windows
- Run the DART by using the instructions in the article Gather Information for Basic Troubleshooting on Cisco AnyConnect Secure Mobility Client Errors.
- Run the diagnostic executable located here:
C:\Program Files (x86)\Cisco\Cisco AnyConnect Secure Mobility Client\UmbrellaDiagnostic.exe
macOS
- Run the DART by using the instructions in the article Gather Information for Basic Troubleshooting on Cisco AnyConnect Secure Mobility Client Errors.
- Run the diagnostic executable located here:
/opt/cisco/anyconnect/bin/UmbrellaDiagnostic.app
- Copy the files from
/opt/cisco/anyconnect/umbrella/data/beacon-logs/service/acumbrellacore*to the ticket.
Cisco Secure Client Umbrella Roaming Module
For the Cisco Secure Client Umbrella Roaming module, users must run two tools: the DART and the roaming client Umbrella Diagnostic tool.
Windows
- Run the DART by using the instructions in the article Gather Information for Basic Troubleshooting on Cisco AnyConnect Secure Mobility Client Errors.
- Run the diagnostic executable located here:
C:\Program Files (x86)\Cisco\Cisco Secure Client\UmbrellaDiagnostic.exe
macOS
- Run the DART by using the instructions in the article Gather Information for Basic Troubleshooting on Cisco AnyConnect Secure Mobility Client Errors.
- Run the diagnostic executable located here:
/opt/cisco/secureclient/bin/UmbrellaDiagnostic.app
- Copy the files from
/opt/cisco/secureclient/umbrella/data/beacon-logs/service/acumbrellacore*to the ticket.
Standalone Diagnostic Tool
If a user does not have the Roaming Client or AnyConnect, download and run the standalone diagnostic tool from the provided links. After downloading and launching the diagnostic tool, please see the next section for how to run it on your Operating System.
Microsoft Windows
Download the file, UmbrellaDiagnostic.exe.zip from here:
- If the system prompts to download .NET 3.5, users can download this config file and place it in the same location as the Umbrella diagnostic tool EXE. This action stops the .NET 3.5 prompt.
macOS
Download the file, OpenDNSDiagnostic-mac-1.6.4.zip from here:
Linux
- No tool is available. Refer to Terminal instructions in the article Umbrella Diagnostic Tool: Terminal Instructions.
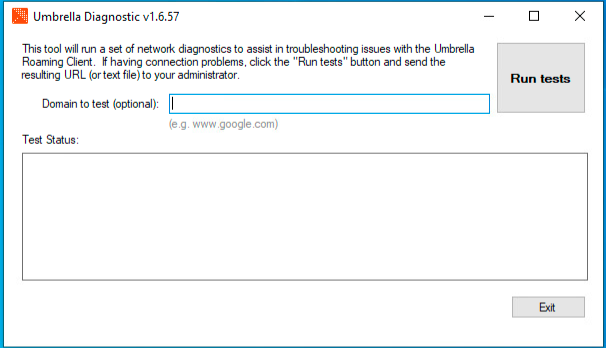
Run Diagnostic Tool on Microsoft Windows
When users first run the tool, it requests account information, ticket information, and a domain for testing. This information is optional, but if a specific domain is causing access issues, include it in the Domain to test field.
 7702129618580
- To run the tool, select Run tests.
- A file is created in
C:\Windows\tmp or C:\Users\<username>\AppData\Local\Temp\. This file can then be provided to Umbrella Support.
Note that Diagnostic tools lesser than version 1.6.5 on Windows does not support cloud upload as of March 31, 2021. Please upload the generated file to support.
Diagnostic Tool Fails to Run
If the Diagnostic does not run, provide the results of the provided command prompt commands:
tracert 208.67.222.222
tracert 208.67.220.220
tracert api.opendns.com.
tracert bpb.opendns.com.
tracert block.opendns.com.
tracert hit-adult.opendns.com.
nslookup -timeout=10 -type=txt debug.opendns.com. 208.67.222.222
nslookup -timeout=10 -type=txt -port=5353 debug.opendns.com. 208.67.222.222
nslookup -timeout=10 -type=txt -port=443 debug.opendns.com. 208.67.222.222
nslookup -timeout=10 -type=txt debug.opendns.com.
ipconfig /all
systeminfo.exe
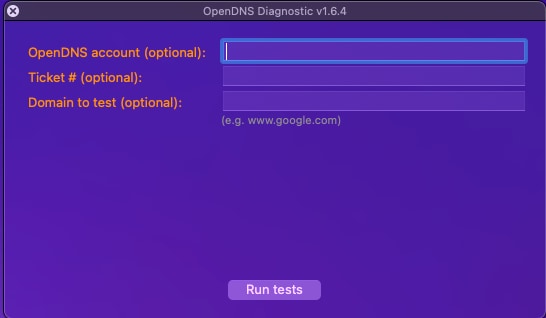
Run Diagnostic Tool on Apple macOS
When users first run the tool, it requests account information, ticket information, and a domain for testing. This information is optional, but if a specific domain is causing access issues, include it in the Domain to test field.
 7702027945236
- To run the tool, select Run tests. The tests can take a few moments to complete.
- A diagnostic_results.txt file is then generated. Please send this file to Umbrella support.
Manually Run Diagnostic Tests
If you would like to run the test manually, please issue the provided commands:
/usr/bin/dig +time=10 myip.opendns.com
/usr/sbin/traceroute -I -w 2 208.67.222.222
/usr/sbin/traceroute -I -w 2 208.67.220.220
/usr/sbin/traceroute -I -w 2 api.opendns.com
/usr/sbin/traceroute -I -w 2 bpb.opendns.com
/usr/sbin/traceroute -I -w 2 block.opendns.com
/usr/bin/dig @208.67.222.222 +time=10 debug.opendns.com txt
/usr/bin/dig @208.67.222.222 -p 5353 +time=10 debug.opendns.com txt
/usr/bin/dig +time=10 debug.opendns.com txt
/usr/bin/dig +time=10 whoami.akamai.net
/usr/bin/dig +time=10 whoami.ultradns.net
/usr/bin/dig @208.67.222.222 +time=10 myip.opendns.com
/usr/bin/dig @ns1-1.akamaitech.net +time=10 whoami.akamai.net
/usr/bin/dig @pdns1.ultradns.net +time=10 whoami.ultradns.net
/usr/bin/nslookup -timeout=10 -class=chaos -type=txt hostname.bind. 4.2.2.1
/usr/bin/nslookup -timeout=10 -class=chaos -type=txt hostname.bind. 192.33.4.12
/usr/bin/nslookup -timeout=10 -class=chaos -type=txt hostname.bind. 204.61.216.4
ping -n 5 www.opendns.com (www.opendns.com)
ping -n 5 rtr1.pao.opendns.com
ping -n 5 rtr1.sea.opendns.com
ping -n 5 rtr1.lax.opendns.com
ping -n 5 rtr1.chi.opendns.com
ping -n 5 rtr1.nyc.opendns.com
ping -n 5 rtr1.lon.opendns.com
ping -n 5 rtr1.mia.opendns.com
ping -n 5 rtr1.sin.opendns.com
ping -n 5 rtr1.fra.opendns.com
ping -n 5 rtr1.hkg.opendns.com
ping -n 5 rtr1.ams.opendns.com
ping -n 5 rtr1.ber.opendns.com
ping -n 5 rtr1.cdg.opendns.com
ping -n 5 rtr1.cph.opendns.com
ping -n 5 rtr1.dfw.opendns.com
ping -n 5 rtr1.otp.opendns.com
ping -n 5 rtr1.prg.opendns.com
ping -n 5 rtr1.ash.opendns.com
ping -n 5 rtr1.wrw.opendns.com
ping -n 5 rtr1.syd.opendns.com
ping -n 5 rtr1.jnb.opendns.com
ping -n 5 rtr1.yyz.opendns.com
ping -n 5 rtr1.yvr.opendns.com
ping -n 5 rtr1.nrt.opendns.com
/bin/ps wwaux
/sbin/ifconfig -a
/usr/sbin/scutil --dns
/usr/sbin/netstat -rn
/usr/bin/curl -Ls block.a.id.opendns.com/monitor.php
/usr/bin/curl -Ls -c /dev/null bpb.opendns.com/monitor/
Run Diagnostic Tool on Linux/Unix
To provide diagnostic information for a Linux/Unix machine, please run the provided commands and provide the results in your reply to the support ticket:
nslookup -type=txt debug.opendns.com.
nslookup -type=txt debug.opendns.com. 208.67.222.222
nslookup -type=txt debug.opendns.com. 208.67.222.222 -port=443
nslookup -type=txt debug.opendns.com. 208.67.222.222 -port=5353
traceroute 208.67.222.222
traceroute api.opendns.com.
traceroute bpb.opendns.com.
ifconfig
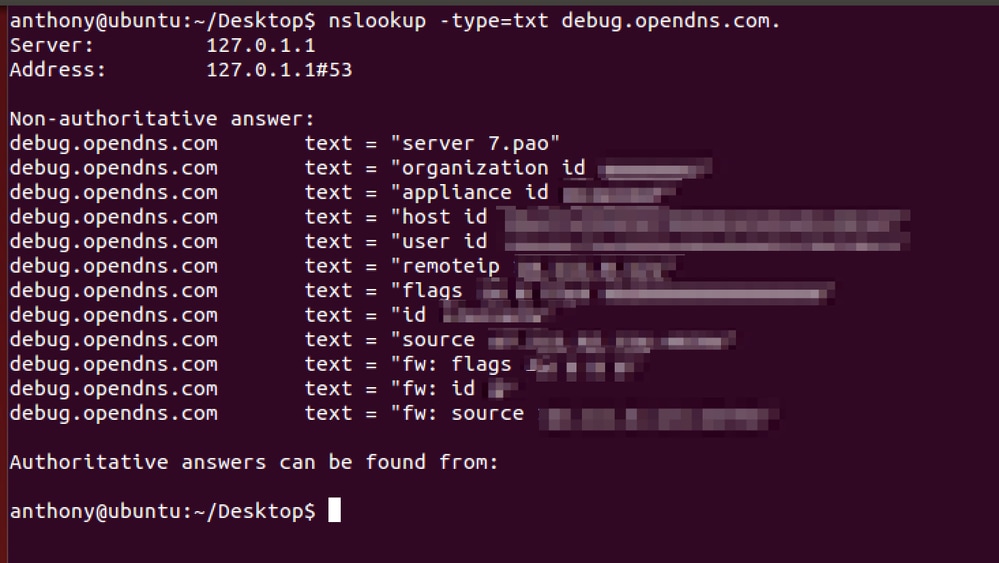
Test for a Specific Domain
If you are asked to test for a specific domain, run the provided commands:
nslookup domain.com
nslookup domain.com 208.67.222.222
nslookup domain.com 208.67.220.220
nslookup domain.com 4.2.2.1
traceroute domain.com
Provided are two example screenshots of the results of these commands. Your results can appear similar, but are unique to your Umbrella dashboard.

 Feedback