Introduction
This document describes the logging configuration for a FirePOWER Threat Defense (FTD) via Firepower Management Center (FMC).
Prerequisites
Requirements
Cisco recommends that you have knowledge of these topics:
- FirePOWER technology
- Adaptive Security Appliance (ASA)
- Syslog protocol
Components Used
The information in this document is based on these software and hardware versions:
- ASA Firepower Threat Defense Image for ASA (5506X/5506H-X/5506W-X, ASA 5508-X, ASA 5516-X ) that runs Software Version 6.0.1 and later
- ASA Firepower Threat Defense Image for ASA (5515-X, ASA 5525-X, ASA 5545-X, ASA 5555-X, ASA 5585-X) that runs Software Version 6.0.1 and later
- FMC Version 6.0.1 and later
The information in this document was created from the devices in a specific lab environment. All of the devices used in this document started with a cleared (default) configuration. If your network is live, ensure that you understand the potential impact of any command.
Background Information
The FTD system logs provide you with the information to monitor and troubleshoot the FTD appliance.
The logs are useful both in routine troubleshooting and in incident handling. The FTD appliance supports both local and external logging.
Local logging can help you troubleshoot the live issues. External logging is a method of collection of logs from the FTD appliance to an external Syslog server.
Logging to a central server helps in aggregation of logs and alerts. External logging can help in log correlation and incident handling.
For local logging, the FTD appliance supports console, internal buffer option, and the Secure Shell (SSH) session logging.
For external logging, the FTD appliance supports the external Syslog server and the Email Relay server.
Note: If a high volume of traffic passes through the appliance, pay attention to the type of logging/severity/rate limiting. Do this in order to limit the number of logs, which avoids impact on the firewall.
Configure
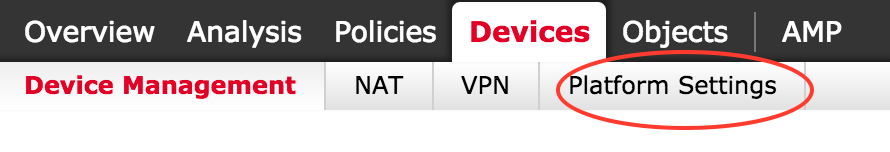
All logging related configurations can be configured when you navigate to the Platform Settings tab under the Devices tab. Choose Devices > Platform Settings as shown in this image.
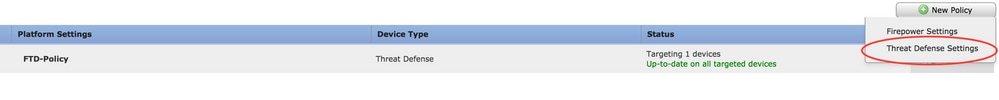
Either click the pencil icon in order to edit the policy that exists or click New Policy, and then choose Threat Defense Settingsin order to create a new FTD policy as shown in this image.
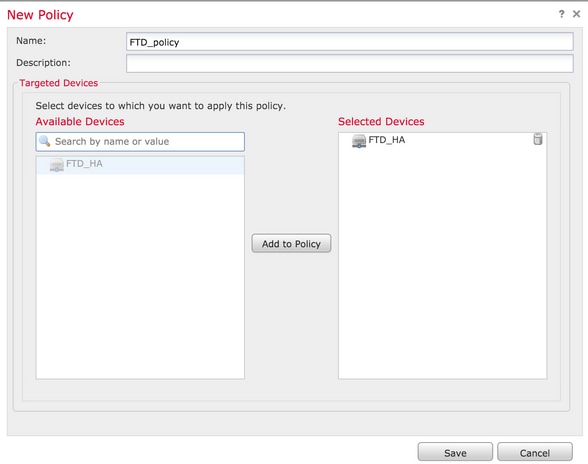
Choose the FTD appliance to apply this policy and click Save as shown in this image.
Configure Global Syslog Configuration
There are certain configurations which are applicable for both Local and External logging. This section deals with the mandatory and optional parameters which can be configured for Syslog.
Logging Setup
Logging setup options are applicable for Local and External logging. In order to configure the Logging setup, choose Devices > Platform Settings.
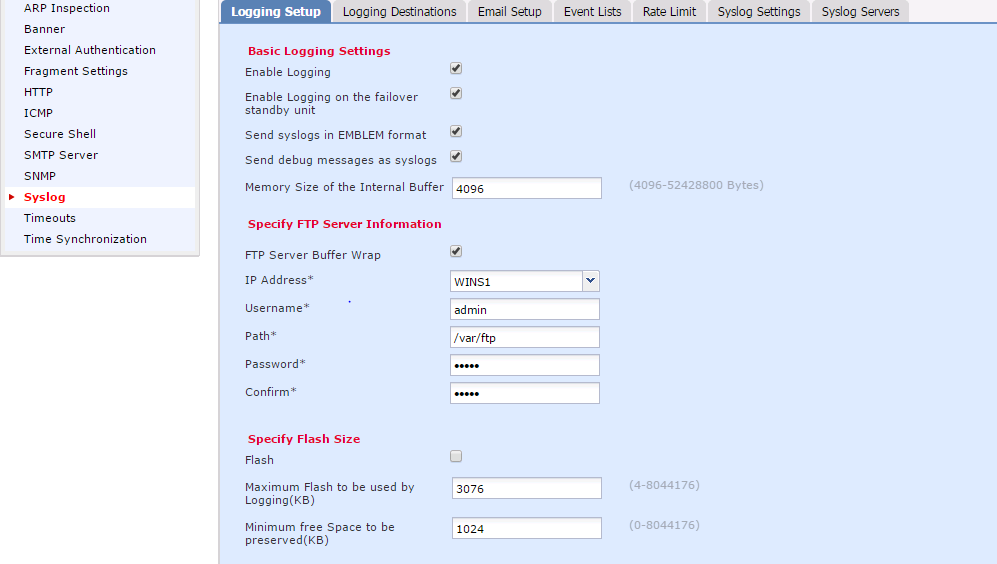
Choose Syslog > Logging Setup.
Basic Logging Setup
Enable Logging: Check the Enable Logging check box in order to enable logging. This is a mandatory option.Enable Logging on the failover standby unit: Check the Enable Logging on the failover standby unit check box in order to configure logging on the standby FTD which is a part of an FTD High availability cluster.Send syslogs in EMBLEM format: Check the Send syslogs in EMBLEM format check box in order to enable the format of Syslog as EMBLEM for every destination. The EMBLEM format is used primarily for the CiscoWorks Resource Manager Essentials (RME) Syslog analyzer. This format matches the Cisco IOS Software Syslog format produced by the routers and the switches. It is available only to UDP Syslog servers.Send debug messages as syslogs: Check the Send debug messages as syslogs check box in order to send the debug logs as Syslog messages to the Syslog server.Memory size of the Internal Buffer: Enter the internal memory buffer size where FTD can save the log data. The log data is rotated if its buffer limit is reached.
FTP Server Information (Optional)
Specify FTP server details if you want to send the log data to FTP server before it overwrites the internal buffer.
FTP Server Buffer Wrap: Check the FTP Server Buffer Wrap check box in order to send the buffer log data to the FTP server.IP Address: Enter the IP address of the FTP server.Username: Enter the username of the FTP server.Path: Enter the directory path of the FTP server.Password: Enter the password of the FTP server.Confirm: Enter the same password again.
Flash Size (Optional)
Specify the flash size if you want to save the log data to flash once the internal buffer is full.
Flash: Check the Flash check box in order to send the log data to the internal flash.Maximum Flash to be used by Logging(KB): Enter the maximum size in KB of flash memory that can be used for logging.Minimum free Space to be preserved(KB): Enter the minimum size in KB of the flash memory which needs to be preserved.
Click Save in order to save the platform setting. Choose the Deploy option, choose the FTD appliance where you want to apply the changes, and click Deploy in order to start deployment of the platform setting.
Event Lists
The Configure Event Lists option allows you to create/edit an event list and specify which log data to include in the event list filter. Event Lists can be used when you configure Logging Filters under Logging destinations.
The system allows two options to use the functionality of custom event lists.
- Class and Severity
- Message ID
In order to configure custom event lists, choose Device > Platform Setting > Threat Defense Policy > Syslog > Event List and click Add. These are the options:
Name: Enter the name of the event list.Severity/Event Class: In the Severity/Event Class section, click Add.Event Class: Choose the event class from the drop-down list for the type of log data that you want. An Event Class defines a set of Syslog rules that represent the same features.
For example, there is an Event Class for the session which includes all the Syslogs that relate to the session.
Syslog Severity: Choose the severity from the drop-down list for the chosen Event Class. The severity can range from 0 (emergency) to 7 (debugging).Message ID: If you are interested in specific log data related to a message ID, click Add in order to put a filter based upon the message ID.Message IDs: Specify the message ID as individual/ range format.
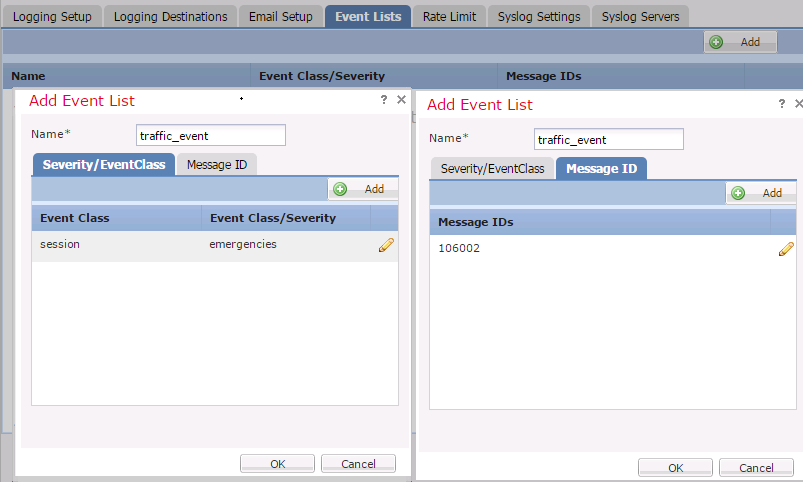
Click OK in order to save the configuration.
Click Save in order to save the platform setting. Choose to Deploy, choose the FTD appliance where you want to apply the changes, and click Deployin order to start deployment of the platform setting.
Rate Limiting Syslog
The Rate limit option defines the number of messages which can be sent to all configured destinations and defines the severity of the message to which you want to assign rate limits.
In order to configure custom event lists, choose Device > Platform Setting > Threat Defense Policy > Syslog > Rate Limit. You have two options based on which you can specify the rate limit:
- Logging level
- Syslog levels
In order to enable the logging level-based rate limit, choose Logging Level and click Add.
Logging Level: From the Logging Level drop-down list, choose the logging level for which you want to perform the rate-limiting.Number of Messages: Enter the maximum number of Syslog messages to be received within the specified interval.Interval(Second): Based on the parameter Number of Messages configured previously, enter the time interval in which a fixed set of Syslog messages can be received.
The rate of Syslog is the Number of Messages/intervals.
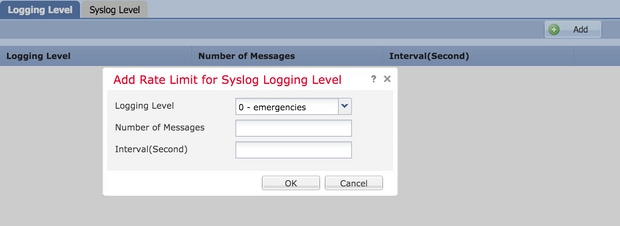
Click OK in order to save the logging level configuration.
In order to enable the logging level based rate limit, choose Logging Level and click Add.
Syslog ID: Syslog IDs are used to uniquely identify the Syslog messages. From the Syslog ID drop-down list, choose the Syslog ID.Number of Messages: Enter the maximum number of syslog messages to be received within the specified interval.Interval(Second): Based on the parameter Number of Messages configured previously, enter the time interval in which a fixed set of Syslog messages can be received.
The rate of Syslog is the Number of Messages/Interval.
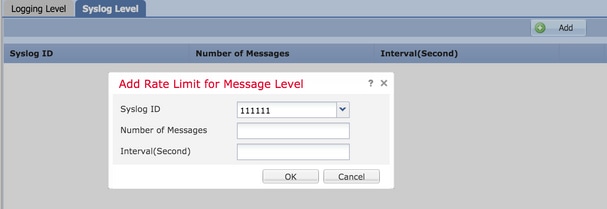
Click OK in order to save the Syslog level configuration.
Click Save in order to save the platform setting. Choose to Deploy, choose the FTD appliance where you want to apply the changes, and click Deploy in order to start deployment of the platform setting.
Syslog Settings
Syslog settings allow configuration of the Facility values to be included in the Syslog messages. You can also include the timestamp in log messages and other Syslog server-specific parameters.
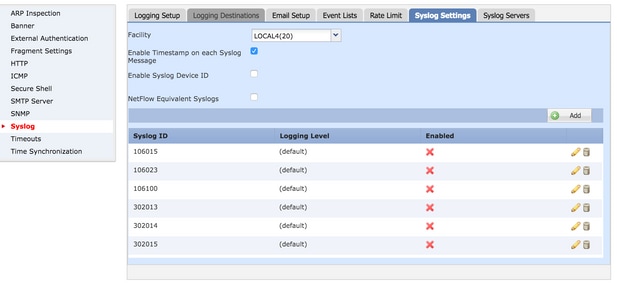
In order to configure custom event lists, choose Device > Platform Setting > Threat Defense Policy > Syslog > Syslog Settings.
Facility: A facility code is used to specify the type of program that is logging the message. Messages with different facilities can be handled differently. From the Facility drop-down list, choose the facility value.Enable Timestamp on each Syslog Message: Check the Enable Timestamp on each Syslog Message check box in order to include the time stamp in Syslog messages.Enable Syslog Device ID: Check the Enable Syslog Device ID check box in order to include a device ID in non-EMBLEM-format Syslog messages.Netflow Equivalent Syslogs: Check the Netflow Equivalent Syslogs check box in order to send NetFlow equivalent Syslogs. It can affect the performance of the appliance.- Add Specific Syslog ID: In order to specify the additional Syslog ID, click
Add and specify the Syslog ID/ Logging Level check box.
Click Save in order to save the platform setting. Choose to Deploy, choose the FTD appliance where you want to apply the changes, and click Deploy in order to start deployment of the platform setting.
Configure Local Logging
The Logging Destination section can be used in order to configure logging to specific destinations.
The available internal logging destinations are:
- Internal Buffer: Logs to the internal logging buffer (logging buffered)
- Console: Sends logs to the console (logging console)
- SSH sessions: Logs Syslog to SSH sessions (terminal monitor)
There are three steps to configure Local Logging.
Step 1. Choose Device > Platform Setting > Threat Defense Policy > Syslog > Logging Destinations.
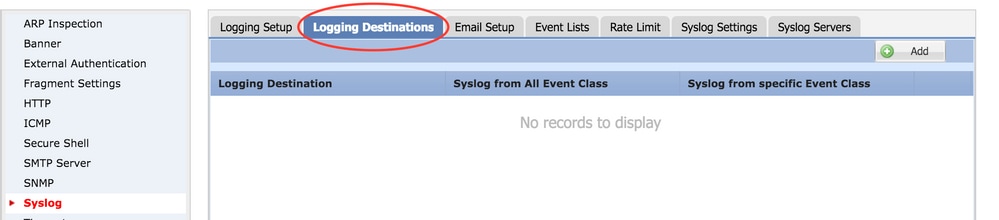
Step 2. Click Add in order to add a Logging Filter for a specific logging destination.
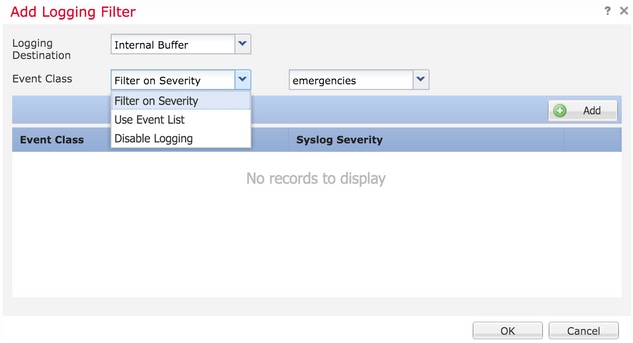
Logging Destination: Choose the required logging destination from the Logging Destination drop-down list as Internal Buffer, Console, or SSH sessions.
Event Class: From the Event Class drop-down list, choose an Event class. As described previously, Event Classes are a set of Syslogs that represent the same features. Event classes can be selected in these ways:
Filter on Severity: Event Classes filter based on the severity of the Syslogs.User Event List: Administrators can create specific Event Lists (previously described) with their own custom event classes and reference them in this section.Disable Logging: Use this option in order to disable logging for the chosen Logging Destination and Logging Level.
Logging Level: Choose the logging level from the drop-down list. The logging level range is from 0 (Emergencies) to 7 (debugging).
Step 3. In order to add a separate Event class to this Logging filter, click Add.
Event Class: Choose the Event Class from the Event Class drop-down list.
Syslog Severity: Choose the Syslog severity from the Syslog Severity drop-down list.
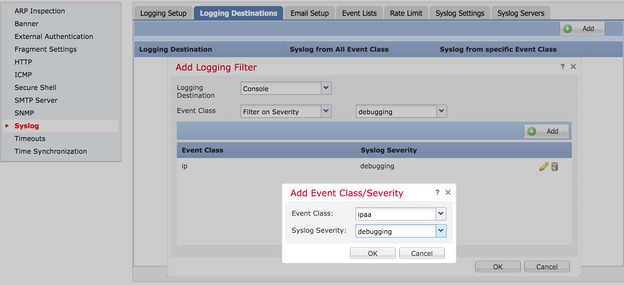
Click OK once the Filter is configured to add the Filter for a specific logging destination.
Click Save in order to save the platform setting. Choose Deploy, choose the FTD appliance where you want to apply the changes, and click Deploy in order to start deployment the platform setting.
Configure the External Logging
In order to configure external logging, choose Device > Platform Setting > Threat Defense Policy > Syslog > Logging Destinations.
FTD supports these types of external logging.
- Syslog Server: Sends logs to the remote Syslog server.
- SNMP trap: Sends the logs out as an SNMP trap.
- E-Mail: Sends the logs via email with a preconfigured mail relay server.
The configuration for the external logging and the internal logging are the same. The selection of Logging destinations decides the type of logging that is implemented. It is possible to configure Event Classes based on Custom Event lists to the remote server.
Remote Syslog Server
Syslog servers can be configured to analyze and store logs remotely from the FTD.
There are three steps to configure remote Syslog servers.
Step 1. Choose Device > Platform Setting > Threat Defense Policy > Syslog > Syslog Servers.
Step 2. Configure the Syslog server related parameter.
- Allow user traffic to pass when TCP syslog server is down: If a TCP Syslog server has been deployed in the network and it is not reachable, then the network traffic through the ASA is denied. This is applicable only when the transport protocol between the ASA and the Syslog server is TCP. Check the
Allow user traffic to pass when TCP syslog server is down check box in order to allow traffic to pass through the interface when the Syslog server is down.
- Message Queue Size: The message queue size is the number of messages that queues up in the FTD when the remote Syslog server is busy and does not accept any log messages.The default is 512 messages and the minimum is 1 message. If 0 is specified in this option, the queue size is considered to be unlimited.
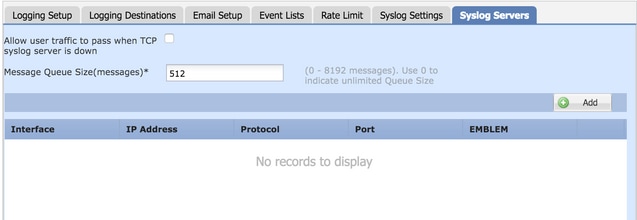
Step 3. In order to add remote Syslog servers, click Add.
IP Address: From the IP Address drop-down list, choose a network object which has the Syslog servers listed. If you have not created a network object, click the plus (+) icon in order to create a new object.
Protocol: Click either the TCP or UDP radio button for Syslog communication.
Port: Enter the Syslog server port number. By default, it is 514.
Log Messages in Cisco EMBLEM format(UDP only): Click the Log Messages in Cisco EMBLEM format (UDP only) check box in order to enable this option if it is required to log messages in the Cisco EMBLEM format. This is applicable for UDP-based Syslog only.
Available Zones: Enter the security zones over which the Syslog server is reachable and move it to the Selected Zones/ Interfaces Column.
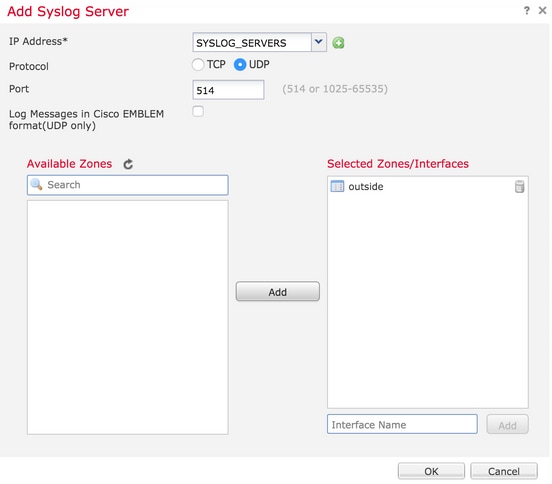
Click OK and Save in order to save the configuration.
Click Save in order to save the platform setting. Choose Deploy, choose the FTD appliance where you want to apply the changes, and click Deploy in order to start deployment of the platform setting.
Email Setup for Logging
FTD allows you to send the Syslog to a specific email address. Email can be used as a logging destination only if an email relay server has already been configured.
There are two steps to configure email settings for the Syslogs.
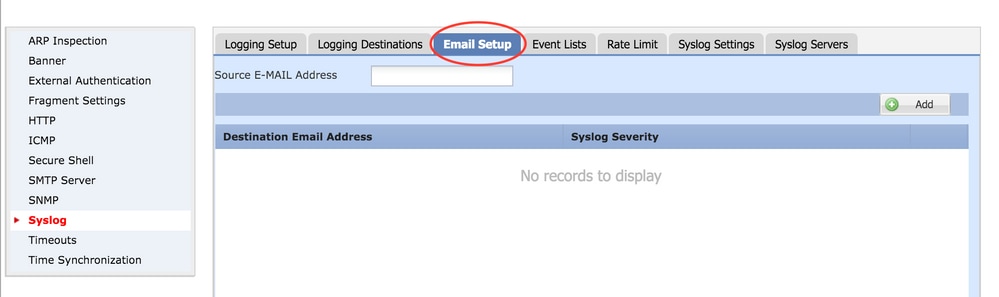
Step 1. Choose Device > Platform Setting > Threat Defense Policy > Syslog >Email Setup.
Source E-MAIL Address: Enter the source email address which appears on all the emails sent out from the FTD which contain the Syslogs.
Step 2. In order to configure the destination email address and Syslog severity, click Add.
Destination Email Address: Enter the destination email address where the Syslog messages are sent.
Syslog Severity: Choose the Syslog severity from the Syslog Severity drop-down list.
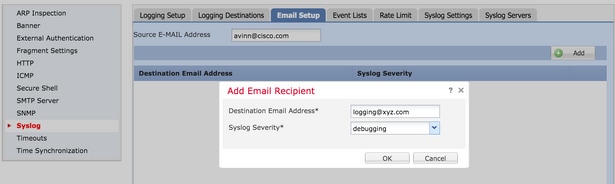
Click OK in order to save the configuration.
Click Save in order to save the platform setting. Choose Deploy, choose the FTD appliance where you want to apply the changes, and click Deploy in order to start deployment of the platform setting.
Verify
There is currently no verification procedure available for this configuration.
Troubleshoot
This section provides information you can use in order to troubleshoot your configuration.
- Verify the FTD Syslog configuration in the FTD CLI. Log in to the management interface of the FTD, and enter the
system support diagnostic-cli command in order to console into the diagnostic CLI.
> system support diagnostic-cli
Attaching to ASA console ... Press 'Ctrl+a then d' to detach.
Type help or '?' for a list of available commands.

><Press Enter>
firepower# sh run logging
logging enable
logging console emergencies
logging buffered debugging
logging host inside 192.168.0.192
logging flash-minimum-free 1024
logging flash-maximum-allocation 3076
logging permit-hostdown
- Ensure that the Syslog server is reachable from the FTD. Log in to the FTD management interface via SSH and verify the connectivity with the
ping command.
Copyright 2004-2016, Cisco and/or its affiliates. All rights reserved.
Cisco is a registered trademark of Cisco Systems, Inc.
All other trademarks are property of their respective owners.
Cisco Fire Linux OS v6.0.1 (build 37)
Cisco Firepower Threat Defense for VMWare v6.0.1 (build 1213)

> system support diagnostic-cli
Attaching to ASA console ... Press 'Ctrl+a then d' to detach.
Type help or '?' for a list of available commands.
firepower> en
Password:
firepower# ping 192.168.0.192
- You can take a packet capture in order to verify the connectivity between the FTD and the Syslog server. Log in to the FTD management interface via SSH and enter the command
system support diagnostic-cli. For the packet capture commands, refer to ASA Packet Captures with CLI and ASDM Configuration Example.
- Ensure that the policy deployment is applied successfully.
Related Information
 Feedback