Introduction
This document describes how NetFlow data from router interfaces can be exported to Catalyst Center through a port-channel interface.
Prerequisites
Requirements
Cisco recommends that you have knowledge of these topics:
- The device must be compatible with Catalyst Center.
- The device must have an active DNA Advantage license.
- The device must be managed in the Catalyst Center inventory.
Application Experience Overview
Application Experience is a functionality in Cisco platforms that provides performance visibility for applications running over the network. It leverages Cisco Performance Monitor (PerfMon) to measure key metrics such as delay, packet loss, and throughput. On IOS® XE releases earlier than 17.3, this was done by deploying an Easy Performance Monitor (ezPM) policy with the Application Performance profile on Cisco IOS XE router platforms. From IOS XE 17.3 onwards, Optimized Application Performance Monitoring (Optimized APM) is used, which improves efficiency, reduces CPU and memory usage, increases scalability for monitoring more flows and applications, and provides more accurate performance measurements.
Workflow
There are two criteria of enabling application telemetry:
-
Conventional tagging-based algorithm: Add the lan keyword to the interfaces whose data you want to export. Then, enable application telemetry from Catalyst Center. Ensure that the interface on which you enable application telemetry is not the management interface and has an IP address assigned.
-
Automatic Selection Algorithm: There is no need to add the interfaces with any keyword. Simply ensure that the interface on which you enable application telemetry has an IP address and is not a WAN interface, loopback interface, or management interface (such as GIGABITETHERNET0, GIGABITETHERNET0/0, MGMT0, FASTETHERNET0, or FASTETHERNET1).
The conventional tagging-based algorithm takes precedence over the newer automatic selection algorithm.
Steps to Enable Application Telemetry
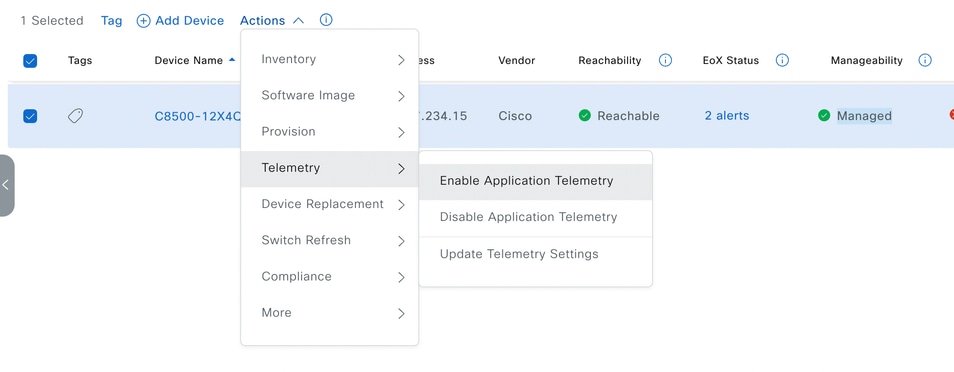
Navigate to Inventory > Change the focus to Inventory > Select the device > Click Actions > Telemetry > Enable Application Telemetry.
Sample Configuration that Catalyst Center Deploys
performance monitor context tesseract profile application-assurance
exporter destination <DNAC_IP> source <EXPORT_INTERFACE_IP> transport udp port 6007
traffic-monitor assurance-dns-monitor
traffic-monitor assurance-monitor
traffic-monitor assurance-rtp-monitor
exit
interface <INTERFACE_NAME>
performance monitor context tesseract
exit
Processing of Netflow Data
-
The network device sends NetFlow data to UDP port 6007.
-
Collector-netflow listens on this UDP port.
-
Collector-netflow writes the data to the netflow-generic Kafka topic.
-
The netflow-generic pipeline writes the data to the netflow-essential Kafka topic.
-
Graphwriter consumes the Kafka topic and writes the data to the graph database.
-
Elasticsearch stores the data.
Verify Telemetry Status
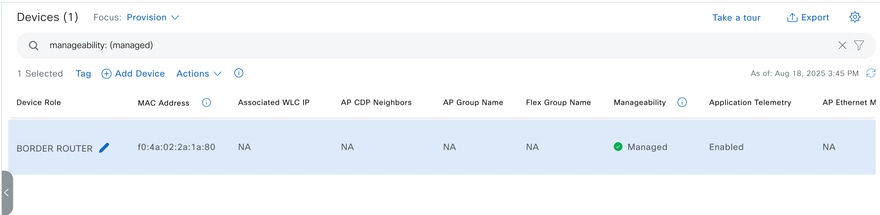
Navigate to Inventory > Change the focus to Provision > Check the Application Telemetry column > It should show Enabled.
Problem Statement
The device has been discovered in Catalyst Center through the management interface, and the requirement is to export NetFlow data through a port-channel configured on the router instead of a physical interface.
Solution
-
Configure the Netflow-Source description for the interface through which you want to export the data.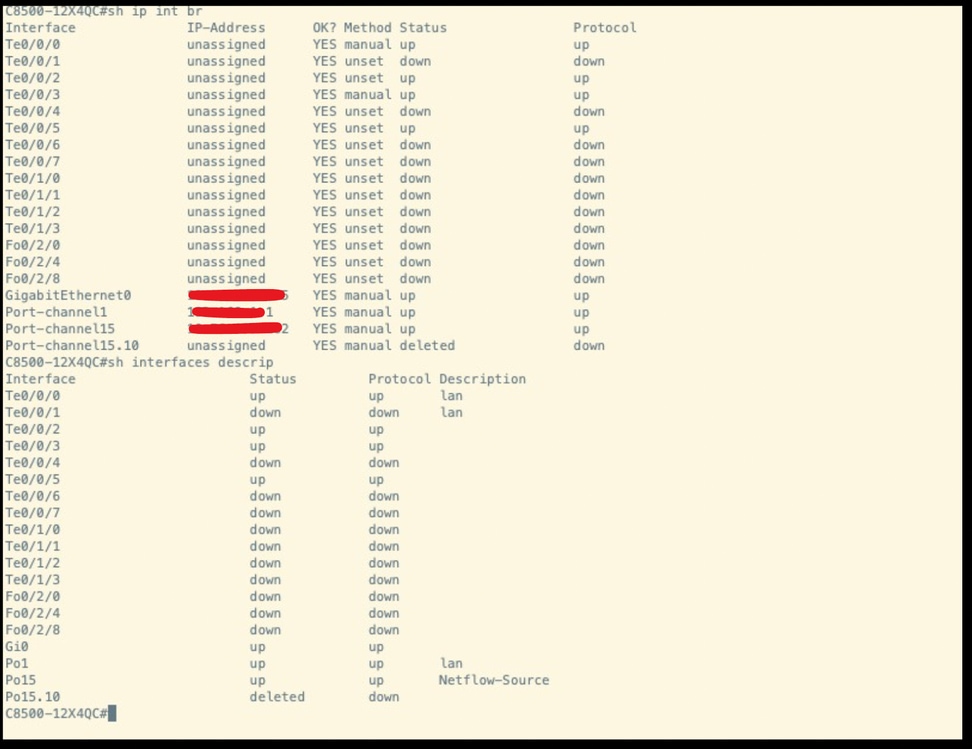
-
Resync the device from the Catalyst Center.
-
Disable and then enable the application telemetry.
Validations
-
Verify that port 6007 is allowed from the router to the Catalyst Center.
-
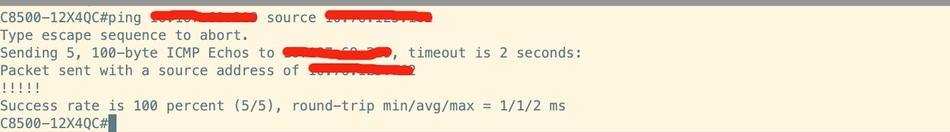
Confirm that the Catalyst Center is reachable from the router's interface where the Netflow-Source description is added.
-
ping <dnac_ip> source <Netflow-Source Configured _interface _ip>
-
-
Ensure that the device clock is synchronized with Catalyst Center.
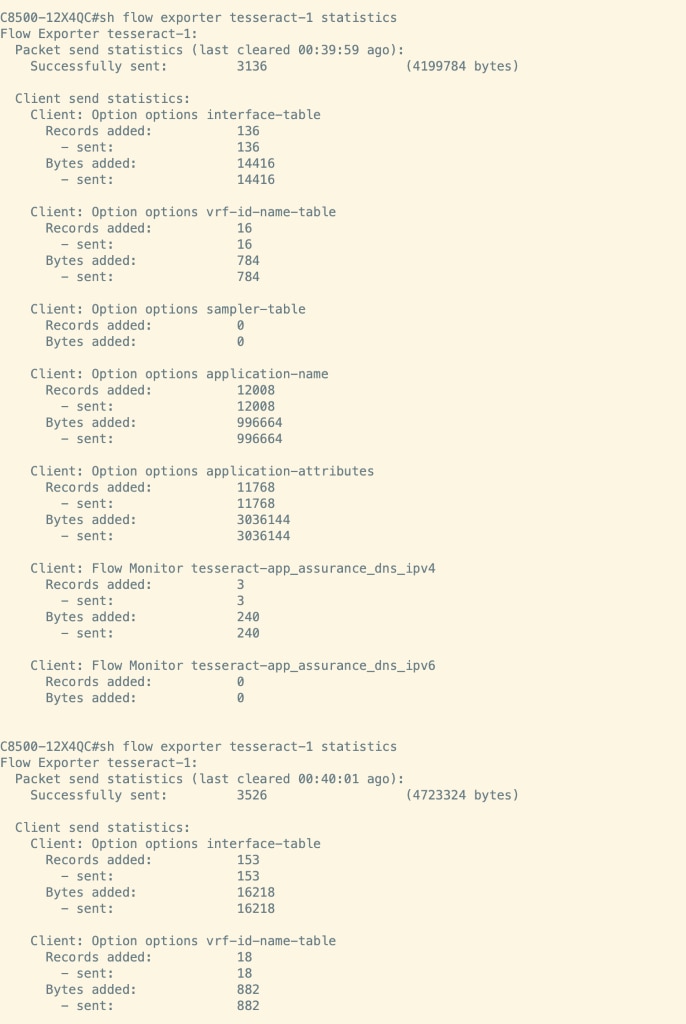
show flow exporter <exporter_name> statistics
-
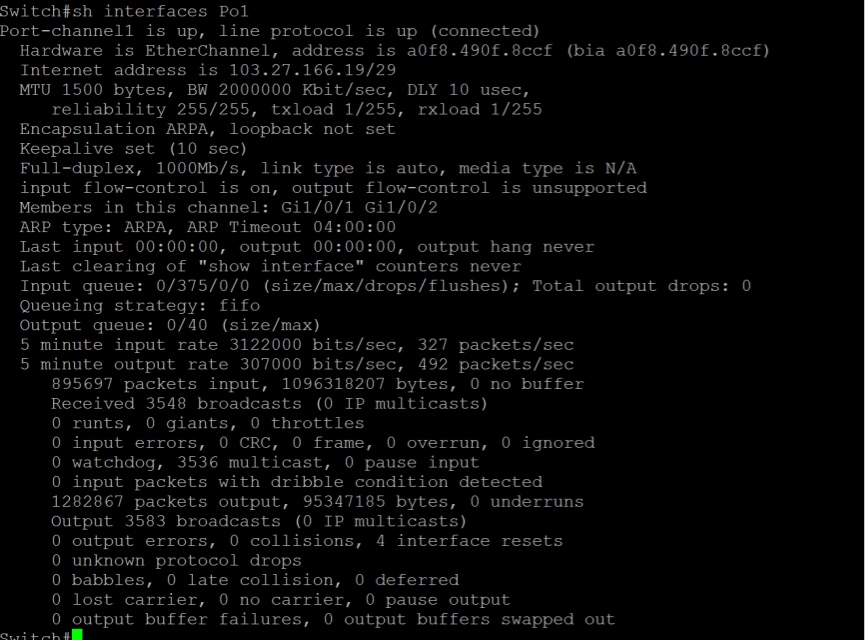
Monitor if output packets on the Netflow-Source configured interface are increasing.
-
show interfaces <interface_name>
-
-
Verify that Catalyst Center is receiving the netflow packets.
$ sudo tcpdump -i any -n "host <Netflow-Source_configure_interface IP> and udp port 6007"
-
Confirm that the collector-netflow service is accepting the traffic.
$ magctl service attach collector-netflow
# tcpdump –n udp port 6007 and src <Netflow-Source_configured_interface IP>
-
Ensure the collector is processing the data.
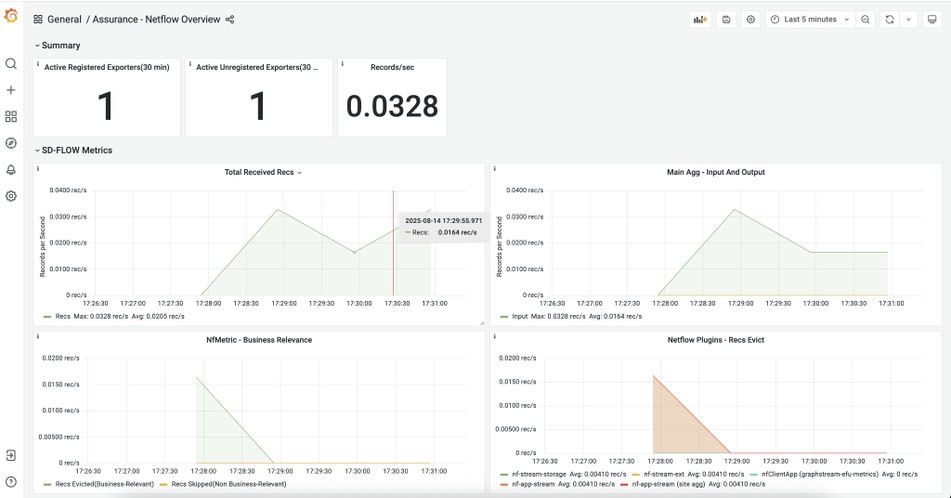
Navigate to GUI > Menu > System > Data Platform > Pipelines.
Check last 10 records for a specific exporter by IP (Replace the exporter IP in the command).
curl 'elasticsearch.ndp:9200/*flowmetrics*/_search?q=\~label:nfMetricAggregation_5_min+AND+exporterIpAddress: IP_ADDRESS&sort=~modificationtime:desc&size=10&pretty'
Key Points
-
NETCONF is not mandatory for the application telemetry.
-
The exporter interface does not need to be a physical interface.
-
Traffic associated with the exporter interface is not part of Application Experience.
-
Catalyst Center must be reachable from the source interface.
 Feedback