How to monitor the health and status of Splunk services using REST API commands
Available Languages
Applicability
Splunk EnterpriseDescription
Within Splunk Web, monitor the health and status of Splunk services using REST API commands. By executing specific REST queries, it can retrieve detailed information about various components, such as the splunkd process, system resource usage, and overall health indicators.
Investigation
[1] Monitoring the Health of the splunkd Process:
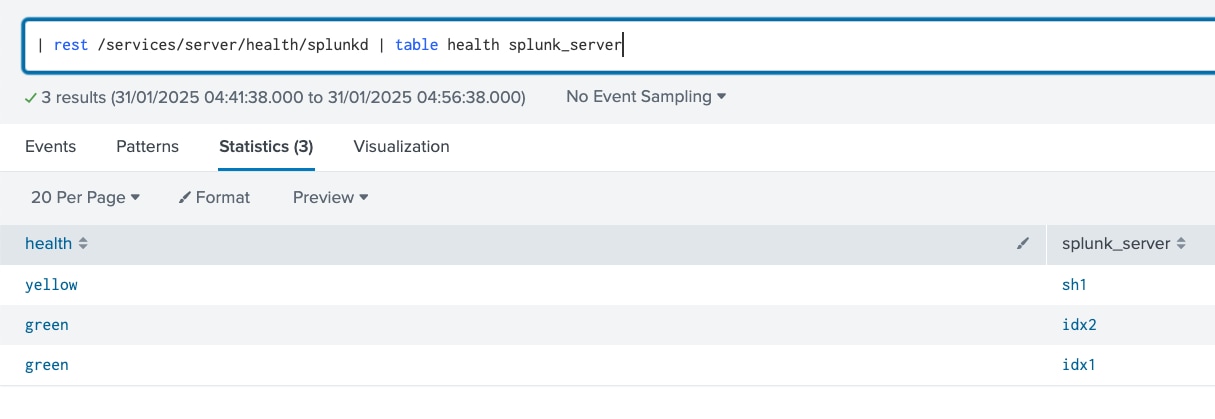
To assess the health status of the splunkd process, and use the following search command:
| rest /services/server/health/splunkd | table health splunk_serverThis command returns the current health status of the splunkd process, indicating whether it’s operating optimally or experiencing issues
[2] Retrieving System Resource Usage:
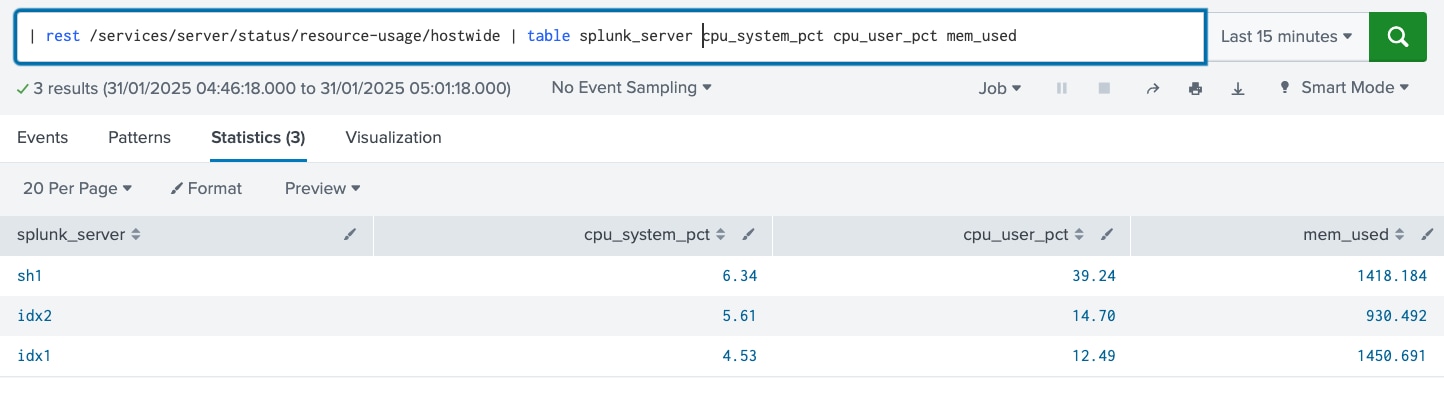
For insights into system resource utilization, such as CPU and memory usage, execute:
| rest /services/server/status/resource-usage/hostwide | table splunk_server cpu_system_pct cpu_user_pct mem_usedThis command provides a table displaying system CPU and memory usage percentages, helping monitor resource consumption.
[3] Checking the Status of the splunk Process
To verify the status of the splunk process, run:
| rest /services/server/status/resource-usage/splunk-processes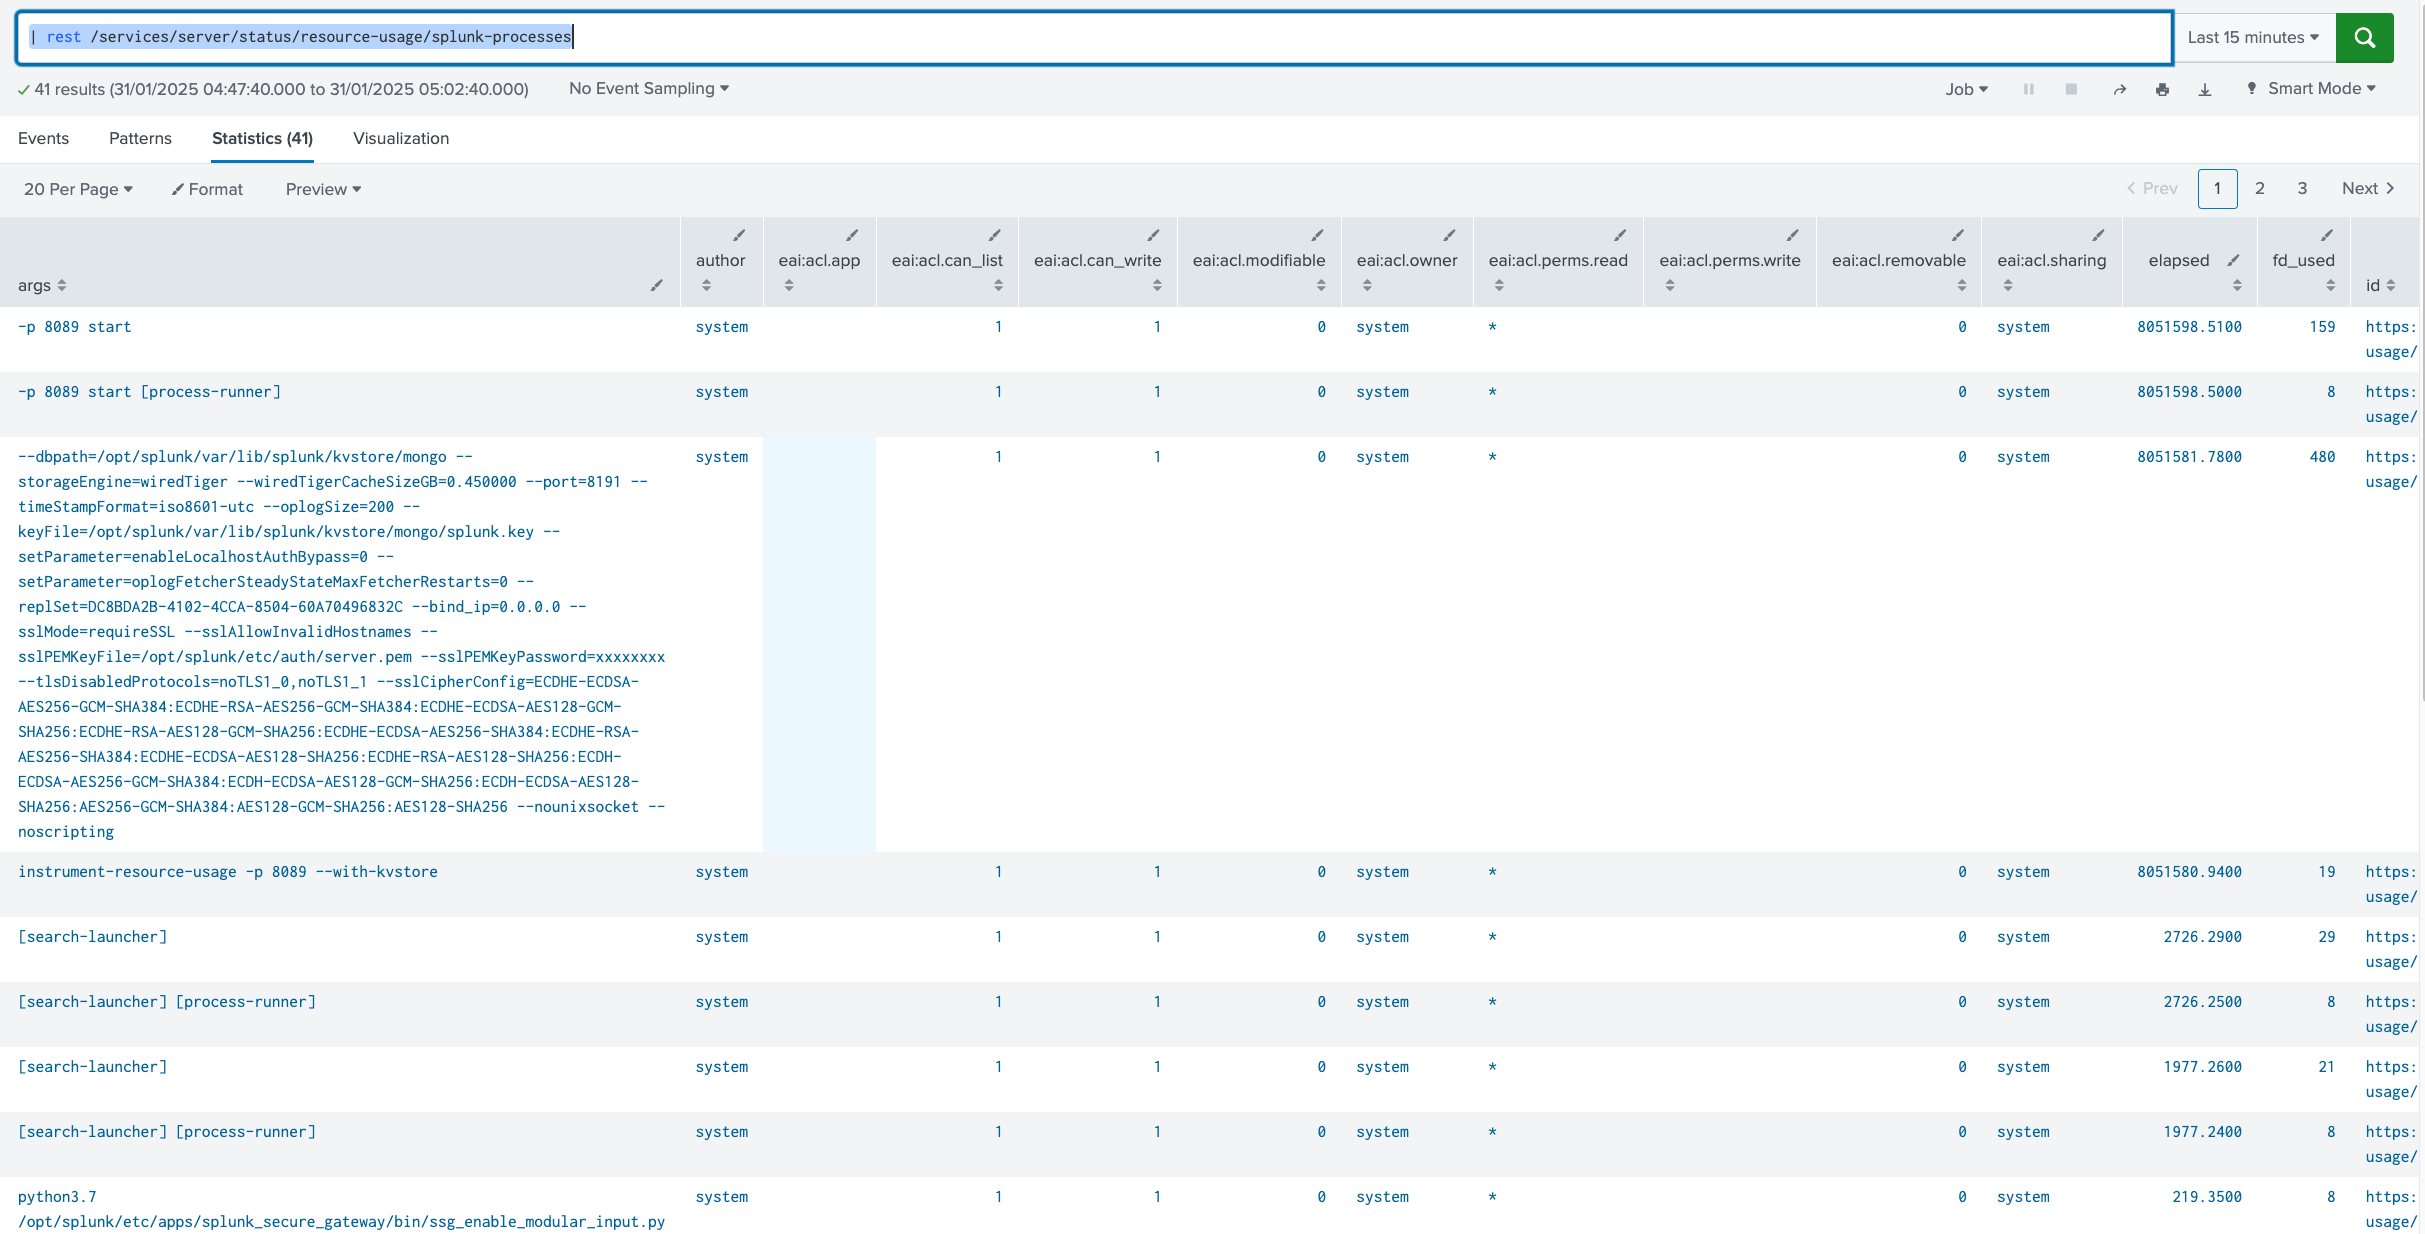
Resolution
Revision History
| Revision | Publish Date | Comments |
|---|---|---|
1.0 |
29-Sep-2026
|
Initial Release |
 Feedback
Contact Cisco
- Open a Support Case

- (Requires a Cisco Service Contract)