How to Simulate Data Flow and Pulling Logs From AWS to Splunk
Available Languages
Applicability
Splunk EnterpriseDescription
This article provides a comprehensive guide to simulating the data flow for log ingestion from AWS into Splunk using the Splunk Add-on for AWS. It covers key components such as AWS CloudWatch and AWS Kinesis, along with detailed steps to configure and utilize the Splunk Add-on for AWS to seamlessly ingest and analyze your AWS log data
Investigation
Push vs. Pull
There are two common approaches to ingesting data from AWS: push and pull. For the purposes of this document, unless otherwise noted, push refers to streaming data from Kinesis Data Firehose to a Splunk HEC endpoint. Likewise, pull refers to the Splunk Add-On for AWS fetching data from AWS services.
Further details are outlined in the dedicated push and pull sections of this document, but these are the high level benefits and limitations of each approach.
-
Push benefits
-
Higher scalability.
-
Utilizes managed services, requiring less management and maintenance overhead.
-
-
Push limitations.
-
Requires a publicly available endpoint.
-
Cost is typically notably higher for lower volume (less than approximately 1 TB per day).
-
-
Pull benefits
-
Simple configuration.
-
Doesn't require a public network to ingest data.
-
-
Pull limitations.
-
At higher volumes, scaling requires additional hosts and can become more complicated.
-
Requires management of AWS security keys on a Splunk Cloud Platform hosted IDM or search head.
-
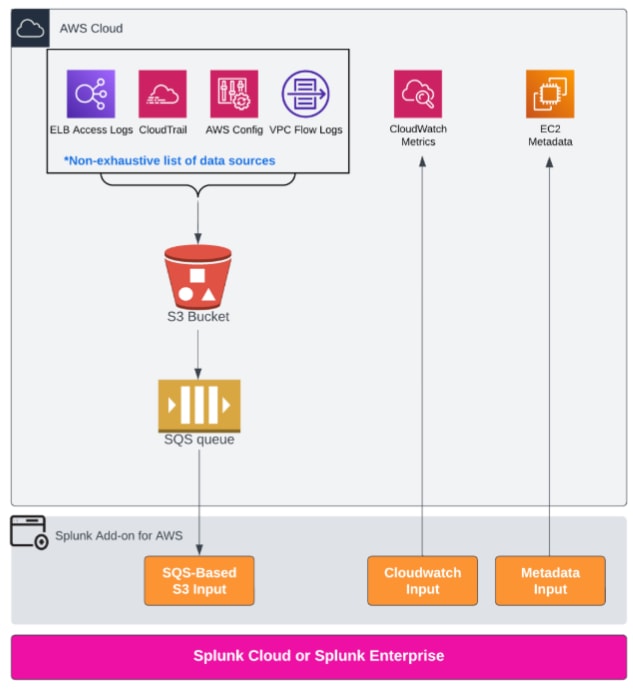
Let’s try pull method through “Splunk Add-on for AWS“
Benefits
Since the original release in 2014, the Splunk Add-on for AWS has been an essential tool for Splunk Administrators seeking to collect AWS data. In addition to the data collection itself, the Splunk Add-on for AWS also contains a host of pre-built sourcetype definitions for many AWS services.
In addition to pulling data from AWS S3 buckets, there are two additional commonly gathered source types that require a separate input on the Splunk Add-on for AWS: metadata and cloudwatch metrics. The metadata input gathers information about many commonly deployed infrastructure types like EC2, RDS, Lambda, IDM, and so on. The cloudwatch metrics input gathers metric information for similar commonly deployed infrastructure such as EC2, Lambda, SQS, SNS, and so on.
In Splunk Cloud Platform these inputs are configured on either their IDM (Classic Experience) or on their search head (Victoria Experience). If your environment has an IDM, installation of the Splunk Add-on for AWS requires a support request to Splunk Cloud Platform Support. For Splunk Enterprise, the Splunk Add-on for AWS is typically installed and configured on a heavy forwarder.
-
Straightforward configuration that requires a S3 bucket and SQS queue.
-
Ingestion failures are typically much easier to recover from due to SQS queues and checkpointing.
-
Capable of utilizing private networks or VPC endpoints to retrieve data.
-
Daily ingest of less than 1 TB per day is almost always considerably more cost effective compared to the push method.
-
The Splunk Add-on for AWS provides an API for automating account and input creation. See API reference for the Splunk Add-on for AWS in the Splunk Add-on for AWS manual.
Limitations
-
Can be CPU/SVC intensive when using many inputs.
-
Not recommended for ingesting more than 1 TB per day per node.
-
Scaling on Splunk Enterprise for higher volumes requires additional resources (nodes/VM) and management overhead.
-
For Splunk Cloud Platform, the limits described in the Experience designations section of the Splunk Cloud Platform Service Details apply.
-
Instructions
Set up a testing pipeline with synthetic log data to mimic real-world behavior. Here’s a step-by-step guide for simulating this data flow:
Prerequisites
-
AWS Account: Access to AWS services (CloudWatch, Lambda, and Kinesis, if applicable).
-
Splunk Environment: Splunk Add-on for AWS installed to pull logs from AWS services.
Steps to Simulate Data Flow
-
Generate Synthetic JFrog Logs
-
Create synthetic JFrog log entries in a format similar to your production JFrog logs. For example:
{ "timestamp": "2024-11-10T12:34:56Z", "log_level": "INFO", "message": "Artifact downloaded", "artifact_id": "123456", "user": "jdoe", "action": "download", "status": "success" }-
Store these sample logs in a file or generate them programmatically.
[root@ip-172-31-37-143 ec2-user]# echo '{"echo '{"timestamp": "2024-11-10T12:34:56Z", "log_level": "INFO", "message": "Artifact downloaded", "artifact_id": "123456", "user": "jdoe", "action": "download", "status": "success"}' > synthetic_jfrog_log.json [root@ip-172-31-37-143 ec2-user]# [root@ip-172-31-37-143 ec2-user]# cat synthetic_jfrog_log.json {"timestamp": "2024-11-10T12:34:56Z", "log_level": "INFO", "message": "Artifact downloaded", "artifact_id": "123456", "user": "jdoe", "action": "download", "status": "success"}-
Send Synthetic Logs to AWS CloudWatch
-
Use the AWS CLI to push logs to CloudWatch.
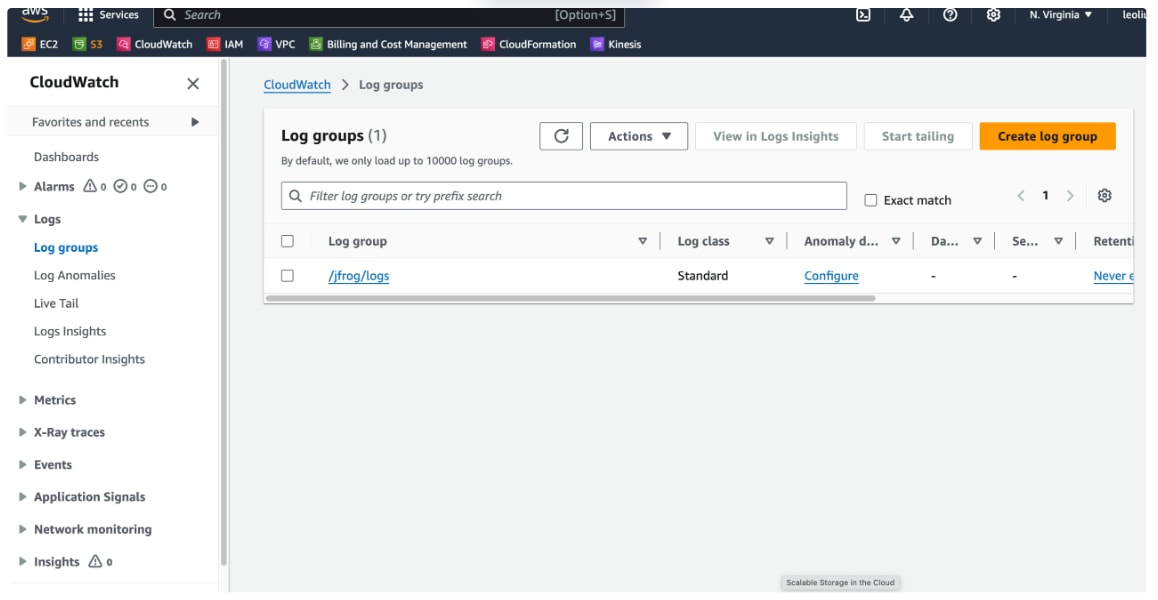
a. Ensure that the log group (/jfrog/logs) and log stream (test-stream) already exist in CloudWatch Logs. If they don’t, create them before running the command:
[root@ip-172-31-37-143 ec2-user]# aws logs create-log-group --log-group-name "/jfrog/logs"
[root@ip-172-31-37-143 ec2-user]# aws logs create-log-stream --log-group-name "/jfrog/logs" --log-stream-name "test-stream"
b. Now, try running the aws logs put-log-events command again. Use $(date +%s000) for the timestamp, and confirm the path to the file:
[root@ip-172-31-37-143 ec2-user]# aws logs put-log-events --log-group-name "/jfrog/logs" --log-stream-name "test-stream" \ --log-events "[{\"timestamp\":$(date +%s000),\"message\":$(jq -Rs . < synthetic_jfrog_log.json)}]" { "nextSequenceToken": "49656729064360051074503226588147810220806296473603932306" }
[root@ip-172-31-37-143 ec2-user]#-
Set Up CloudWatch Subscription Filter to Kinesis (Optional)
Setting up a CloudWatch Subscription Filter to forward logs to a Kinesis Data Stream is a great way to allow downstream services (like Splunk) to process logs in real-time. Here’s a step-by-step guide to creating this setup.
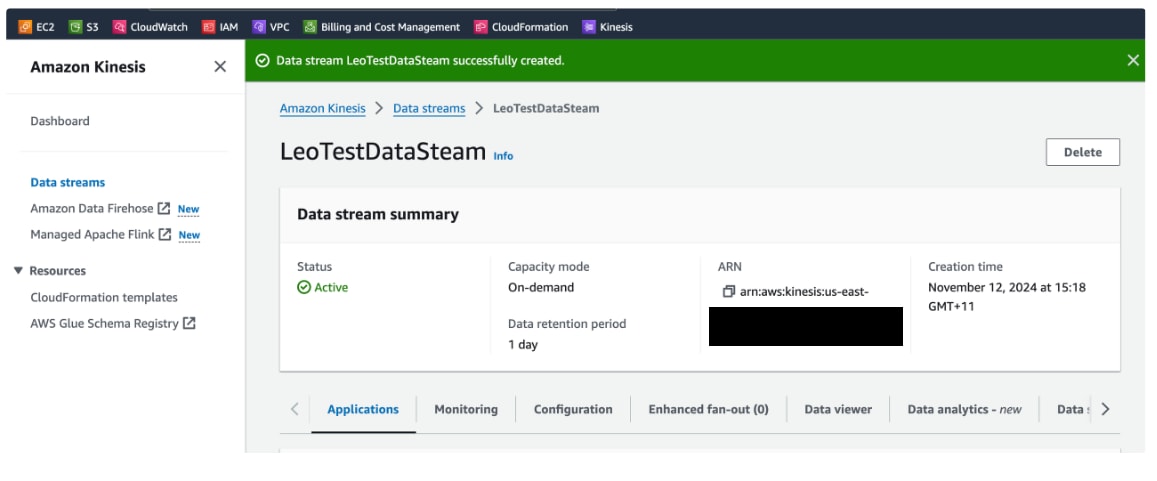
Step 1: Create a Kinesis Data Stream
-
Go to the Kinesis Console:
-
In the AWS Management Console, go to Kinesis and select Data Streams.
-
Create a New Data Stream:
-
Click Create data stream.
-
Provide a name for your stream, e.g., jfrog-log-stream.
-
Specify the number of shards (the default is 1, but this depends on your expected data volume and throughput requirements).
-
Click Create data stream to complete the setup.
Step 2: Create an IAM Role with Permissions for CloudWatch Logs
-
Go to IAM Console:
-
Navigate to the IAM service in the AWS Management Console.
-
Create a New IAM Role:
-
In the IAM dashboard, click on Roles in the left-hand menu.
-
Click Create role.
-
Select Custom Trusted Entity
Configuring this role for CloudWatch Logs to send data to a Kinesis Data Stream, you will need to make some adjustments.
Replace the existing trust policy to allow CloudWatch Logs to assume the role. The updated trust policy should look like this:
{
    "Version": "2012-10-17",
    "Statement": [
        {
            "Effect": "Allow",
            "Action": "sts:AssumeRole",
            "Principal": {
                "Service": "logs.<region>.amazonaws.com"
            }
        }
    ]
}-
Replace <region> with your AWS region (e.g., us-east-1, ap-southeast-2).
-
This change ensures that the CloudWatch Logs service can assume the role.
Add Permissions Policy
Attach a permissions policy that allows CloudWatch Logs to write to the specified Kinesis Data Stream. Here’s an example:
{
    "Version": "2012-10-17",
    "Statement": [
        {
            "Effect": "Allow",
            "Action": [
                "kinesis:PutRecord",
                "kinesis:PutRecords"
            ],
            "Resource": "arn:aws:kinesis:<region>:<account-id>:stream/<stream-name>"
        }
    ]
}-
Replace:
-
<region> with your AWS region.
-
<account-id> with your AWS account ID.
-
<stream-name> with the name of your Kinesis Data Stream.
This policy allows CloudWatch Logs to send records to your Kinesis stream.
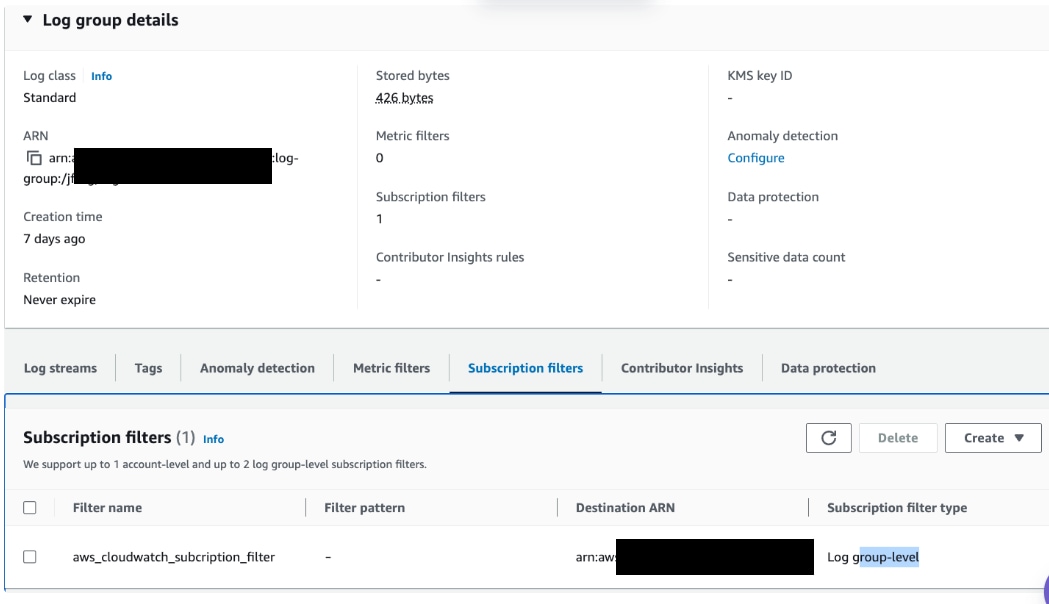
Set Up CloudWatch Subscription Filter to Kinesis
-
If your production setup includes Kinesis, set up a CloudWatch subscription filter to forward these synthetic logs to a Kinesis Data Stream.
-
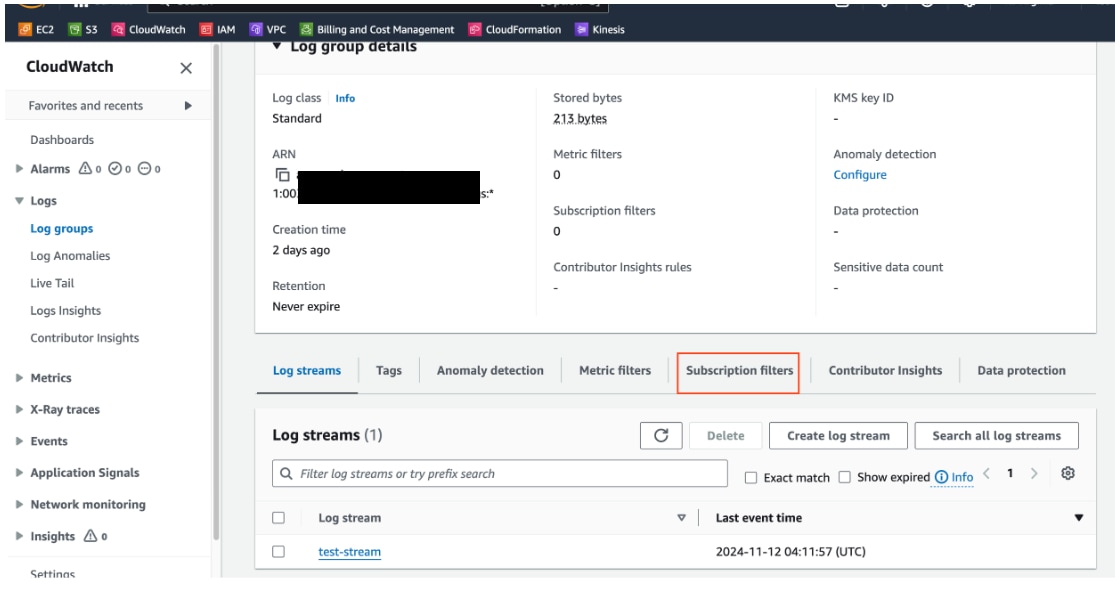
Go to the CloudWatch Log Group for JFrog logs, create a Subscription Filter, and select Kinesis Data Stream as the destination.
Configure Splunk to Receive Logs
-
Option 1: Direct Integration via Splunk Add-on for AWS
-
Install the Splunk Add-on for AWS in your Splunk instance.
-
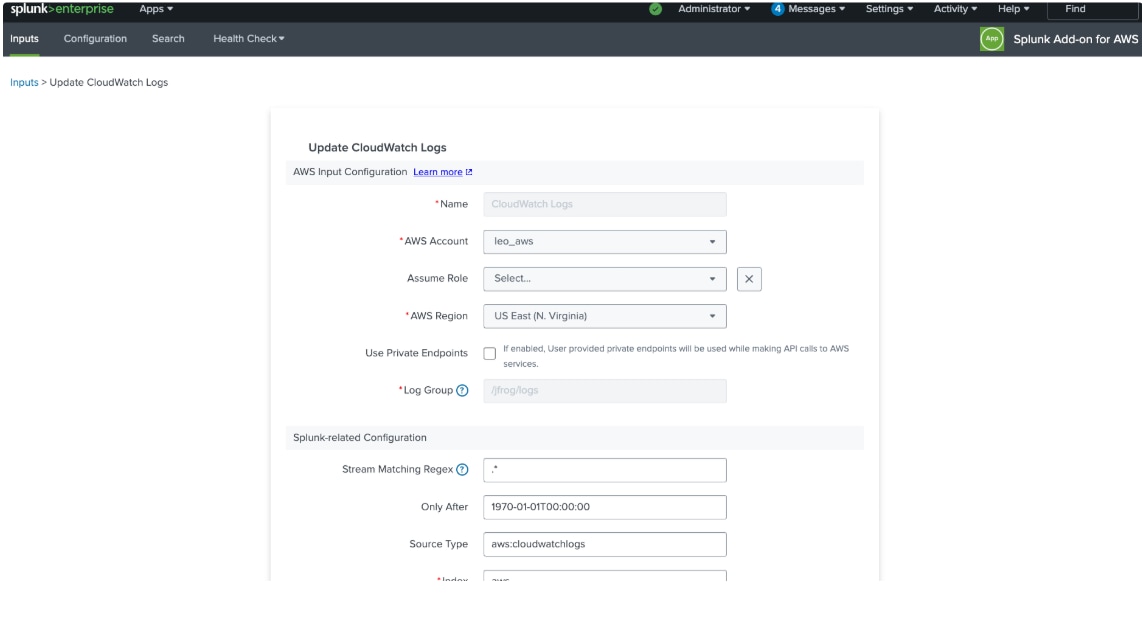
Configure a CloudWatch input to pull logs from the /jfrog/logs log group in CloudWatch.
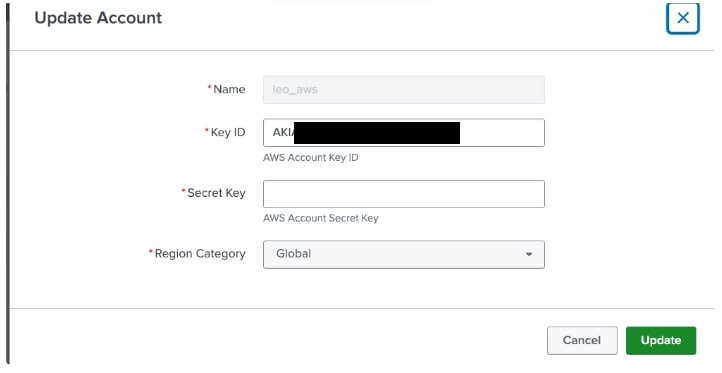
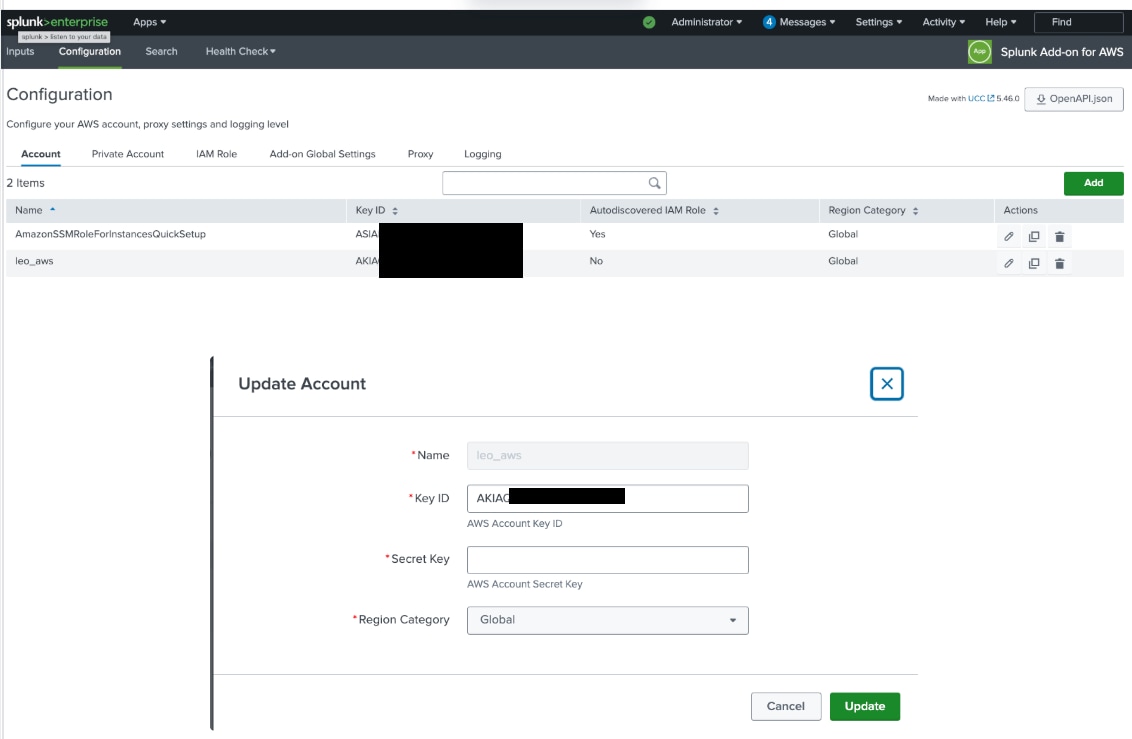
a. Get your aws account set up with permissions
Manage accounts for the Splunk Add-on for AWS
b. Configure a CloudWatch input
Resolution
Validate Data in Splunk
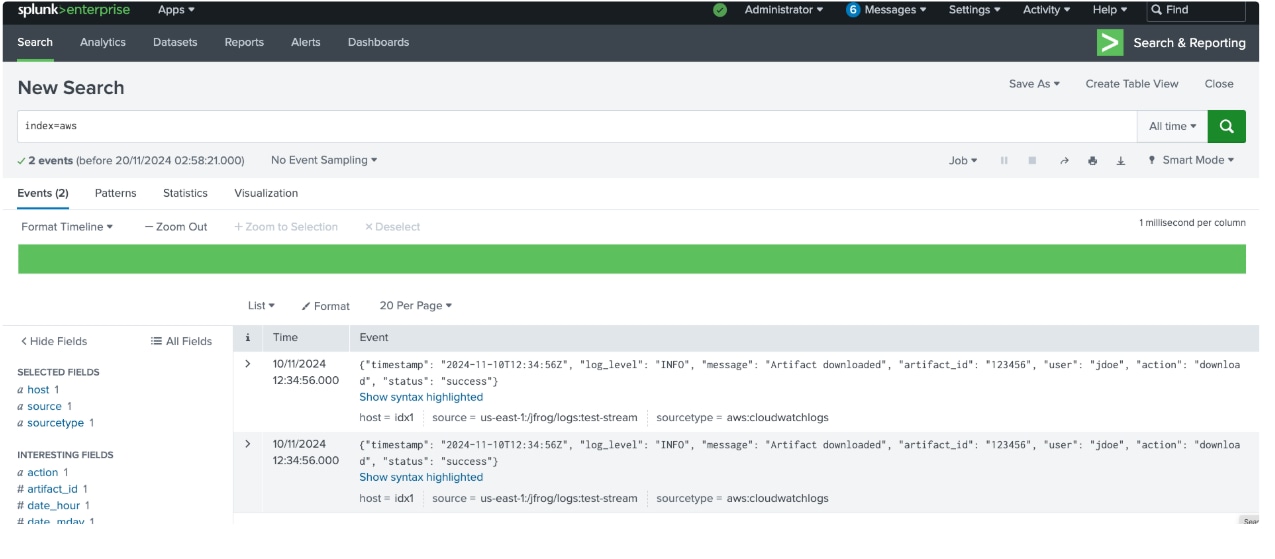
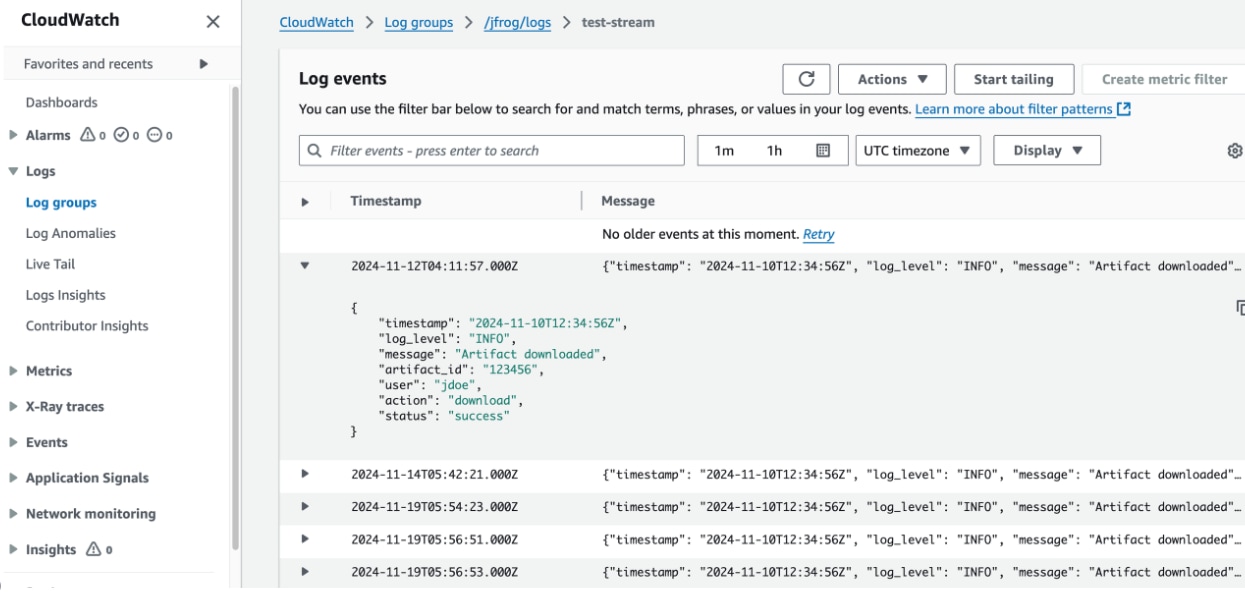
Logs has been pulled from AWS to Splunk
In Splunk:
From AWS:
Revision History
| Revision | Publish Date | Comments |
|---|---|---|
1.0 |
29-Sep-2026
|
Initial Release |
 Feedback
Contact Cisco
- Open a Support Case

- (Requires a Cisco Service Contract)
This Document Applies to These Products
Related Articles
- DB Connect not pulling logs
- AWS Inspector v2 input not pulling IAM user account details logs from some account in Splunk addon for AWS.
- Splunk Add-on for AWS: Configuring an AWS IAM Policy to bring logs from Amazon Web Services more securely. (Splunk Cloud)
- Data duplication while collecting logs from S3 bucket via incremental S3 input in Splunk Addon for AWS.