Set Traces and Collect Logs in CCE
Available Languages
Download Options
Bias-Free Language
The documentation set for this product strives to use bias-free language. For the purposes of this documentation set, bias-free is defined as language that does not imply discrimination based on age, disability, gender, racial identity, ethnic identity, sexual orientation, socioeconomic status, and intersectionality. Exceptions may be present in the documentation due to language that is hardcoded in the user interfaces of the product software, language used based on RFP documentation, or language that is used by a referenced third-party product. Learn more about how Cisco is using Inclusive Language.
Contents
Introduction
This document describes how to set and collect traces in Cisco Unified Contact Center Enterprise (CCE).
Prerequisites
Requirements
Cisco recommends that you have knowledge of these topics:
- Cisco Unified Contact Center Enterprise (UCCE)
- Package Contact Center Enterprise (PCCE)
- Cisco Finesse
- Cisco Customer Voice Portal (CVP)
- Cisco Virtualized Voice Browser (VVB)
- Cisco Unified Border Element (CUBE)
- Cisco Unified Intelligence Center (CUIC)
- Cisco Unified Session Initiation Protocol (SIP) Proxy (CUSP)
Components Used
The information in this document is based on these software versions:
- Cisco Finesse Release 12.5
- CVP Server Release 12.5
- UCCE/PCCE Release 12.5
- Cisco VVB Release 12.5
- CUIC Release 12.5
The information in this document was created from the devices in a specific lab environment. All of the devices used in this document started with a cleared (default) configuration. If your network is live, ensure that you understand the potential impact of any command.
Set Traces and Collect Finesse Logs
Finesse Client
There are several options to collect Finesse client logs.
Option 1: Collect Client Logs Through the Send Error Report
- Log an agent in.
- If an agent experiences any problem during a call or media event, instruct the agent to click the Send Error Report link on the top right-hand corner of the finesse desktop.
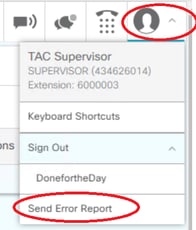
- The agent sees the Logs Successfully Sent! message.
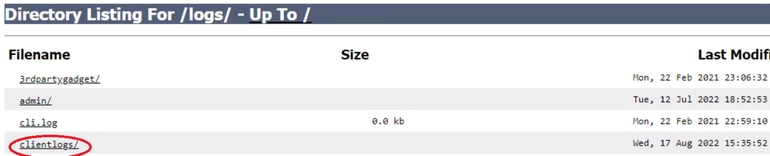
- The client logs are sent to the Finesse server. Navigate to Finesse Logs and log in with an administration account.
- Collect the logs under the clientlogs/ directory.
Option 2: Set Persistent Logging
- Navigate to Desktop Local Log.
- Click Sign In With Persistent Logging.
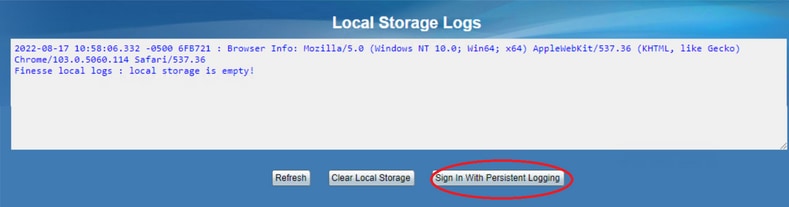
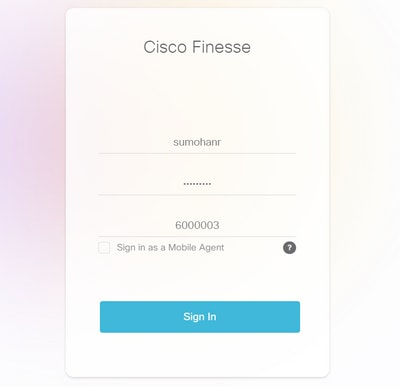
- The Cisco Finesse agent desktop log in page opens. Log the agent in.
- All the agent desktop interaction is registered and sent to the local storage logs. To collect the logs, navigate to Desktop Local Log and copy the content into a text file. Save the file for further analysis.
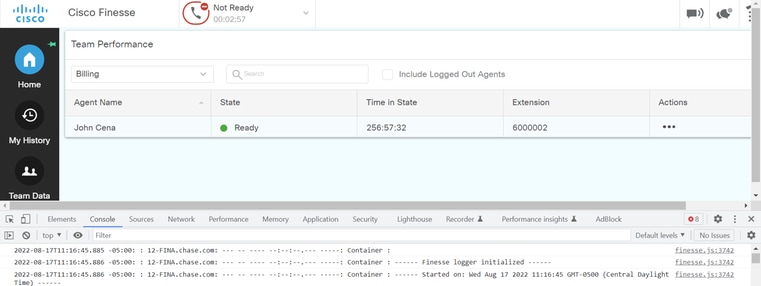
Option 3: Web Browser Console
- After an agent logs in, press F12 to open the browser console.
- Select the Console tab.
- Check the browser console for the errors. Copy the content into a text file and Save it.
- Select the Network tab, and check the Preserve log option.
- Right-click any of the network name events and select
Saveas HAR with content.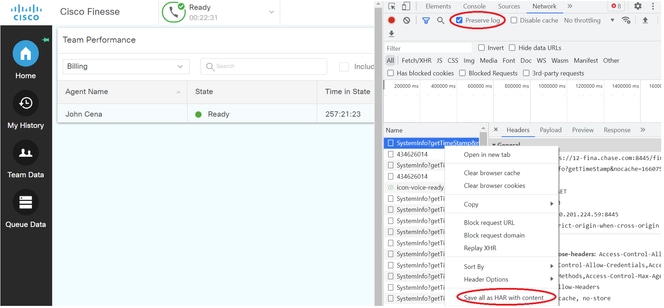
Finesse Server
Option 1: Via the User Interface (UI) - Web Services (Required) and Additional Logs
- Navigate to Finesse Logs and log in with the administration account.
- Expand the directory webservices/.
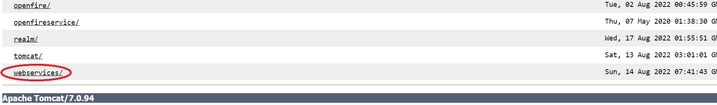
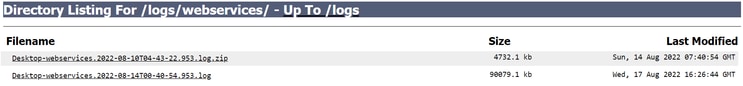
- Collect the last web service logs. Select the last unzip file. For Instance, Desktop-Webservices.201X-..log.zip. Click the file link and you see the option to Save the file.
- Collect the other required logs (depends on the scenario). For instance, openfire for notification service issues, realm logs for authentication issue, and tomcatlogs for APIs issues.
Note: The recommended method to collect the Cisco Finesse server logs is via Secure Shell (SSH) and Secure File Transfer Protocol (SFTP). This method does not only allow you to collect the webservices logs but all additional logs like, Fippa, openfire, Realm, and Clientlogs.
Option 2: Via SSH and Secure File Transfer Protocol (SFTP) - Recommended Option
- Log in to the Finesse server with the SSH.
- Enter this command in order to collect the logs you need. The command collects the logs for 2 hours. You are prompted to identify SFTP server where the logs are uploaded.
file get activelog desktop recurs compress reltime hours 2
- These logs are stored on the SFTP server path: <IP address>\<date time stamp>\active_nnn.tgz , where nnn is timestamp in long format.
- To collect additional logs like tomcat, Context service, Servm and install logs, look at the Log Collection section of the Cisco Finesse Administration Guide Release 12.5(1).
Set Traces and Collect CVP and CVVB Logs
CVP Call Server
- The CVP CallServer default level of traces is enough to troubleshoot most of the cases. However, when you need to get more detail on the Session Initiation Protocol (SIP) messages, you need to set the SIP strack traces to the DEBUG level.
- Navigate to the CVP CallServer Diag webpage URL Local Host 8000.
Note: This page provides good information about the CVP CallServer and it is very useful to troubleshoot certain scenarios.
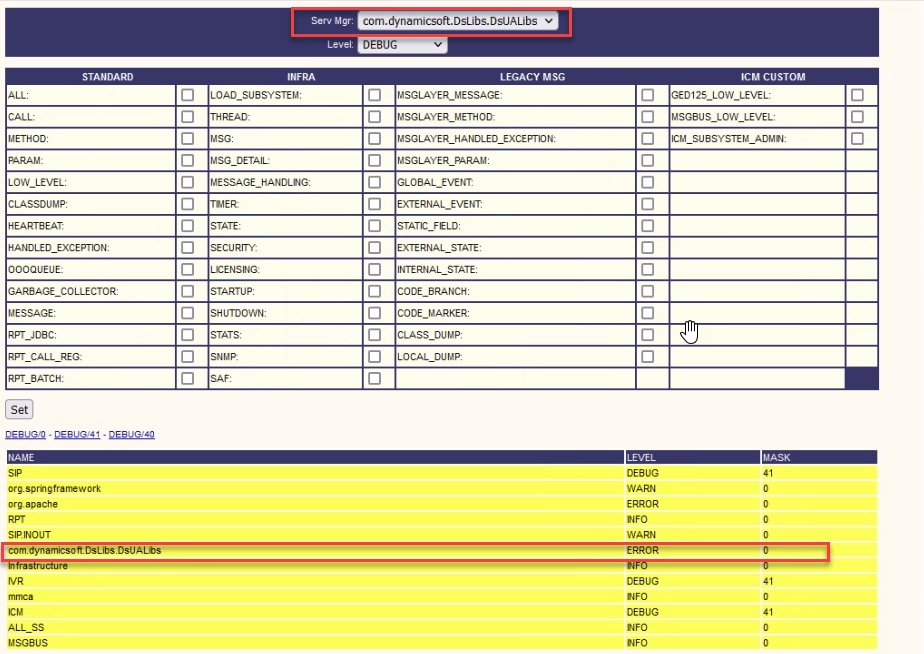
- Select com.dynamicsoft.DsLibs.DsUALibs from the Serv. Mgr dropdown menu at the top left-hand corner.
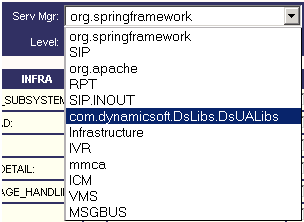
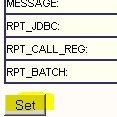
- Click the Set button.
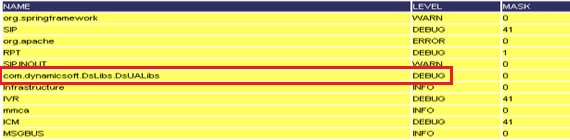
- Scroll down in the trace window in order to ensure that the level of traces has been set correctly. These are your debug settings.
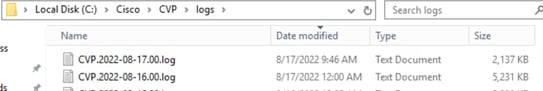
- When you reproduce the problem, collect the logs from C:\Cisco\CVP\logs and select the CVP log file based on the time the problem occurred.
7. After you reproduce the problem, ensure to restore the traces to the default level. Select com.dynamicsoft.DsLibs.DsUALibs from the Serv. Mgr dropdown menu at the top left-hand corner and set it to error.
CVP Voice XML (VXML) Application
In very rare circumstances, you need to increase the level of traces of the VXML server applications. On the other hand, it is not recommended to increase it unless a Cisco Engineer requests it.
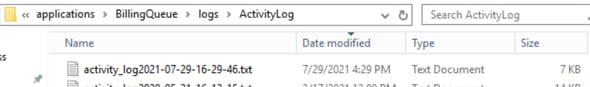
To collect the VXML server application logs, navigate to the specific application directory under the VXML server, for example: C:\Cisco\CVP\VXMLServer\applications\{name of application}\logs\ActivityLog\ and collect the activity logs.
CVP Operations and Administration Management Portal (OAMP)
In most of the cases, the default level of traces of OAMP and ORM are enough to determine the root cause of the problem. However, if the level of traces is required to be increased, here are the steps to execute this action:
- Backup %CVP_HOME%\conf\oamp.properties.
- Edit %CVP_HOME%\conf\oamp.properties.
omgr.traceMask=-1
omgr.logLevel=DEBUG
org.hibernate.logLevel=DEBUG
org.apache.logLevel=ERROR
net.sf.ehcache.logLevel=ERROR
- Restart OPSConsoleServer after the modification as shown.
Trace Level Information
|
Trace Level |
Description |
Log Level |
Trace Mask |
|
0 |
Product install default. No or minimal performance impact expected. |
INFO |
None |
|
1 |
Less detailed trace messages with a small performance impact. |
DEBUG |
DEVICE_CONFIGURATION + |
|
2 |
Detailed trace messages with a medium performance impact. |
DEBUG |
DEVICE_CONFIGURATION + |
|
3 |
Detailed trace message with a high performance impact. |
DEBUG |
DEVICE_CONFIGURATION + |
|
4 |
Detailed trace message with a very high performance impact. |
DEBUG |
MISC + |
|
5 |
Highest detailed trace message. |
DEBUG |
MISC + |
Cisco Virtualized Voice Browser (CVVB)
In CVVB, a trace file is a log file that records activity from the Cisco VVB component subsystems and steps.
Cisco VVB has two main components:
- Cisco VVB Administration traces termed as MADM logs
- Cisco VVB Engine traces termed as MIVR logs
You can specify the components for which you want to collect information and the level of information that you want to collect.
Log Levels extend from:
- Debugging – Basic flow details to
- XDebugging 5 – Detailed level with Stack Trace
Warning: Xdebugging5 must not be enabled on production loaded system.
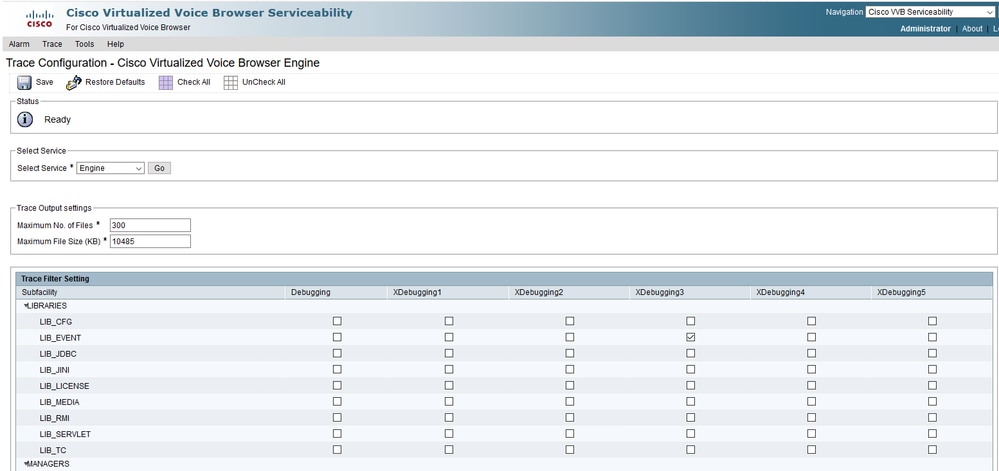
The most common logs that you need to collect are the Engine. The default level of traces for the CVVB Engine traces is enough to troubleshoot most issues. However, if you need to change the level of traces for a specific scenario, Cisco recommends that you use the pre-defined System Log Profiles.
System Log Profiles
|
Name |
Scenario in which this Profile must be Activated |
|
DefaultVVB |
Generic logs are enabled. |
|
AppAdminVVB |
For issues with web administration through AppAdmin, Cisco VVB Serviceability, and other web pages. |
|
MediaVVB |
For issues with media setup or media transmission. |
|
VoiceBrowserVVB |
For issues with calls handle. |
|
MRCPVVB |
For issues with ASR/TTS with Cisco VVB interaction. |
|
CallControlVVB |
For issues with SIP signal related are published in the log. |
Option 1: Via Administration Account
- Open the CVVB main page, UCCX Service Main, and navigate to the Cisco VVB Serviceability page. Log in with the administration account.

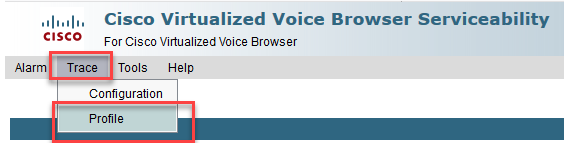
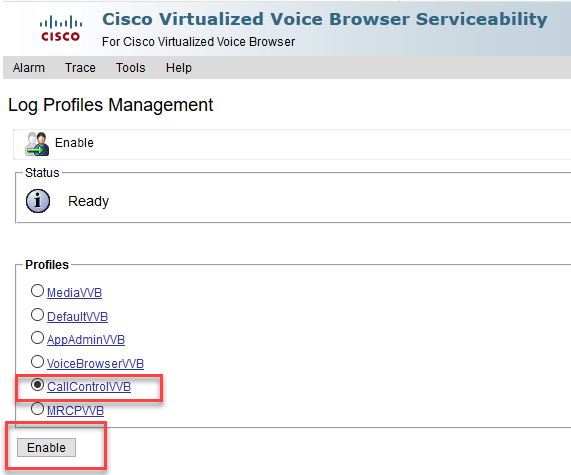
- Select Trace > Profile.
- Check the profile that you want to enable for the specific scenario and click the Enable button. For example, enable the profile CallControlVVB for SIP related issues or MRCPVVB for issues related to Automatic Speech Recognition and Text to Speech (ASR/TTS) interaction.
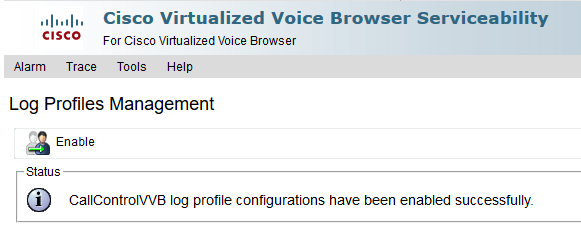
- You see the successful message after you click the enable button.
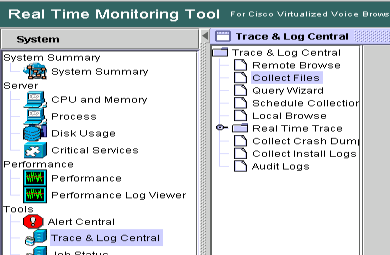
- After the problem is reproduced, collect the logs. Use the Real Time Monitor Tool (RTMT) that comes with the CVVB to collect the logs.
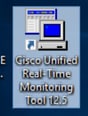
- Click the Cisco Unified Real-Time Monitoring Tool icon on your Desktop (if needed, download this tool from the CVVB).
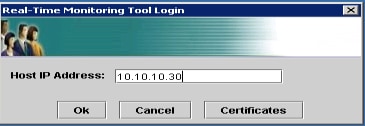
- Provide the IP address of the VVB and click OK.
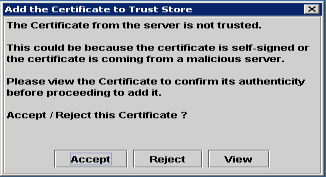
- Accept the Certificate information, if displayed
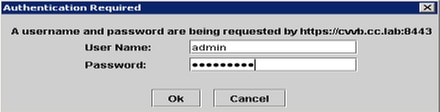
- Provide the credential and click OK.
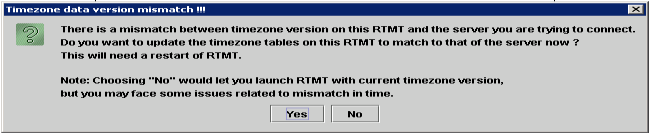
- If you received the TimeZone error, RTMT can close after you click the Yes button. Relaunch the RTMT tool.
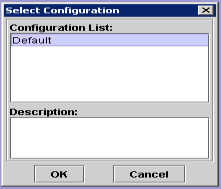
- Leave the Default configuration selected and click OK.
.
- Select Trace & Log Central and then double click Collect Files.
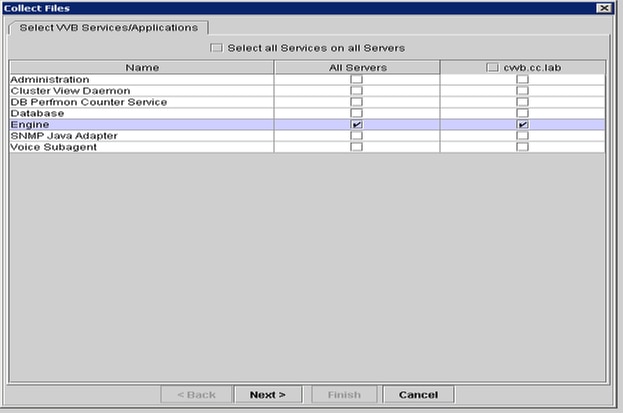
- In the new open window, select the Engine and click Next.
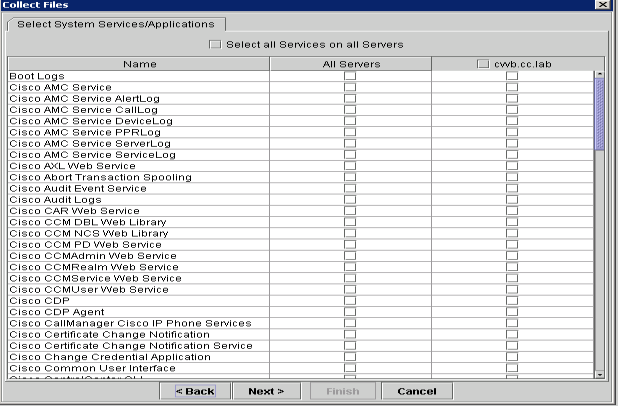
- Click Next again in the next window.
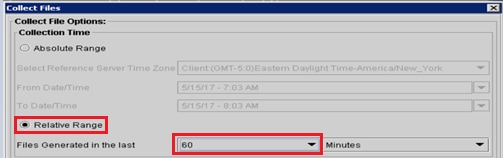
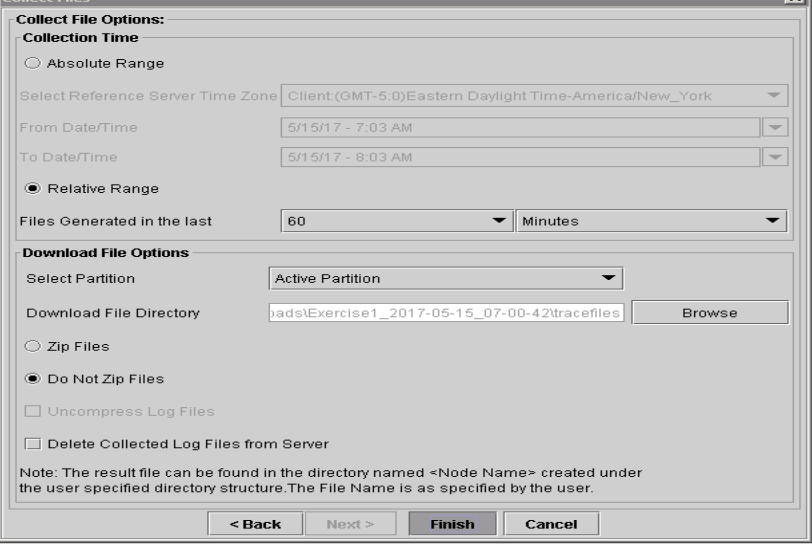
- Select Relative Range and ensure you select time to cover the time of your bad call.
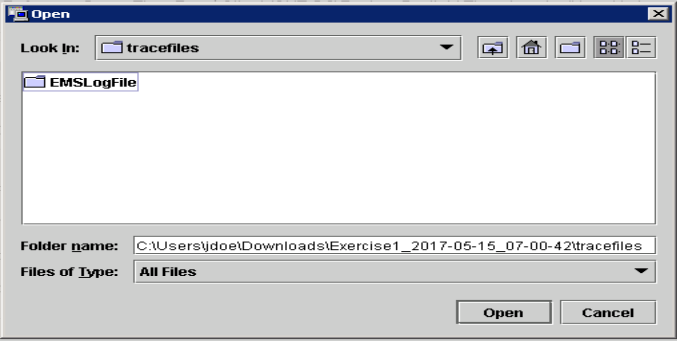
- On the Download File Options, click Browse and select the directory where you want to save the file, then click Open.
- Once all is selected, click Finish button.
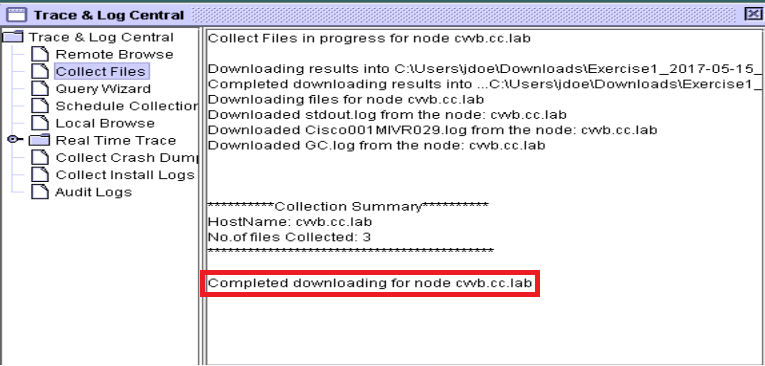
- This collects the log files. Wait until you see the confirmation message on RTMT.
- Navigate to the folder where the traces are saved.
- The Engine logs are all that you need. To find them, navigate to \<time stamp>\uccx\log\MIVR folder.
Option 2: Via SSH and SFTP - Recommended Option
- Log in to the VVB server with the Secure Shell (SSH).
- Enter this command in order to collect the logs you need. The logs are compressed and you are prompted to identify SFTP server where the logs are uploaded.
file get activelog /uccx/log/MIVR/*
- These logs are stored on the SFTP server path: <IP address>\<date time stamp>\active_nnn.tgz, where nnn is timestamp in long format.
Set Trace and Collect Logs for CUBE and CUSP
CUBE (SIP)
- Set the logs timestamp and enable the logging buffer.
#conf  t
service timestamps debug datetime msec
service timestamps log datetime msec
service sequence-numbers
no logging console
no logging monitor
logging buffered 5000000 7
end
clear loggingWarning: Any change on a production Cisco IOS® software GW can cause an outage.
- This is a very robust platform that can handle the suggested debugs at the provided call volume without issue. However, Cisco recommends that you:
- Send all logs to a syslog server instead of to the logging buffer.
logging <syslog server ip>
logging trap debugs - Apply the debug commands one at a time, and check the CPU utilization after each one.
show proc cpu hist
Warning: If the CPU gets up to 70-80% CPU utilization, the risk of a performance-related service impact is greatly increased. Thus, do not enable additional debugs if the GW hits 60%.
- Send all logs to a syslog server instead of to the logging buffer.
- Enable these debugs:
debug voip ccapi inout
debug ccsip mess
After you make the call and simulate the issue, stop the debugging: - Reproduce the problem.
- Disable the traces.
#undebug all
- Collect the logs.
term len 0
show ver
show run
show log
CUSP
- Turn on SIP traces on CUSP.
(cusp)> config
(cusp-config)> sip logging
(cusp)> trace enable
(cusp)> trace level debug component sip-wire - Reproduce the problem.
- Turn logging off once you are done.
Collect the Logs
- Configure a user on the CUSP (for example, test).
- Add this configuration at the CUSP prompt.
username <userid> create
username <userid> password <password>
username <userid> group pfs-privusers - FTP to the CUSP IP address. Use the username (test) and password as defined in the previous step.
- Change directories to /cusp/log/trace.
- Get the log_<filename>.
Set Trace and Collect UCCE Logs
Cisco recommends to set trace levels and collect traces via Diagnostic Framework Portico or System CLI tools.
Note: For more information about Diagnostic Framework Portico and System CLI, visit the chapter Diagnostic tools in the Serviceability Guide for Cisco Unified ICM/Contact Center Enterprise, Release 12.5(1).
When you troubleshoot most of the UCCE scenarios, if the default level of traces does not provide enough information, set the level of traces to 3 in the required components (with some exceptions).
Note: Visit the Trace Level section on the Serviceability Guide for Cisco Unified ICM/Contact Center Enterprise, Release 12.5(1) for more information.
For instance, if you troubleshoot Outbound Dialer issues, the level of traces must be set to level 2 if the Dialer is busy.
For CTISVR (CTISVR), level 2 and level 3 do not set the exact registry level recommended by Cisco. The recommended trace registry for CTISVR is 0XF8.
- On the UCCE Agent PG, open the Registry Editor (Regedit).
- Navigate to HKLM\software\Cisco Systems, Inc\icm\<cust_inst>\CG1(a and b)\EMS\CurrentVersion\library\Processes\ctisvr.
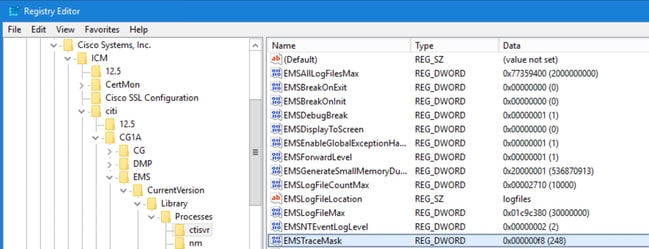
- Double click the EMSTraceMask and set the value to f8.
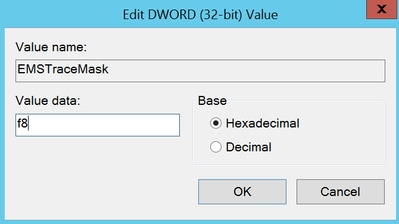
- Click Ok and close the Registry Editor. These are the steps to set any of the UCCE component traces (the RTR process is used as an example).
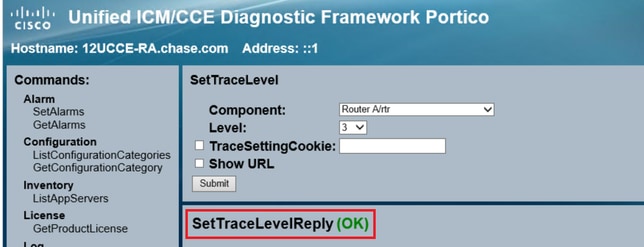
SetTrace Level
- Open the Diagnostic Framework Portico from the server you need to set the traces, and log in as the Administrator user.
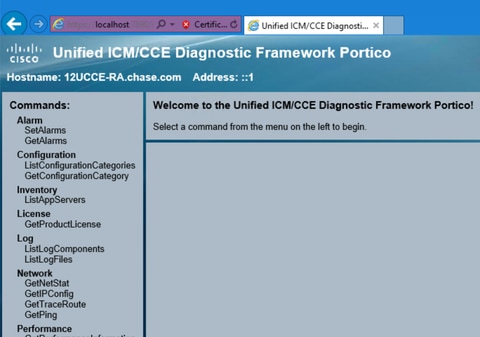
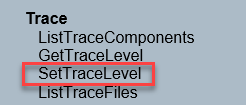
- On the Commands section, navigate to Trace and select SetTraceLevel.
- On the SetTraceLevel window, select the component and the level.
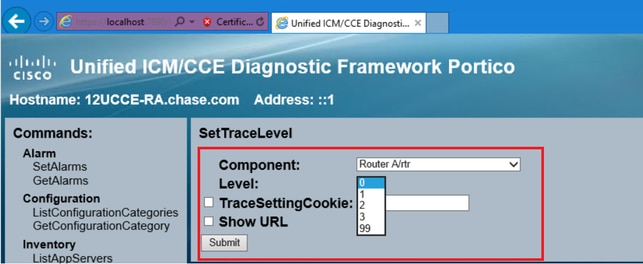
- Click Submit. When finished, you see the Ok message.
Warning: Set the level of traces to level 3 while you attempt to reproduce the problem. After the problem is reproduced, set the trace level to default. Use special caution when you set the JTAPIGW traces, since level 2 and level 3 set the Low level traces and this can cause a performance impact. Set level 2 or level 3 in the JTAPIGW during non-production time or in a lab environment.
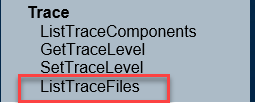
Log Collection
- From the Diagnostic Framework Portico, in the Commands section, navigate to Trace and select ListTraceFile.
- On the ListTraceFile window, select the Component, FromDate, and ToDate. Check the Show URL box, and then, click Submit.
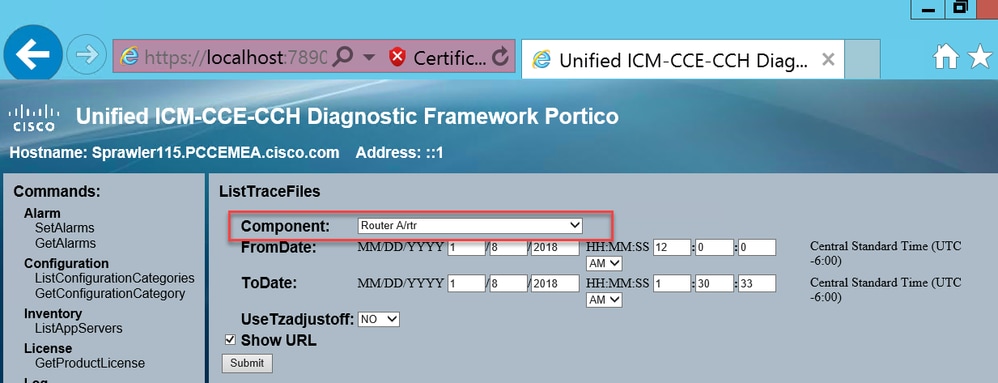
- When the request finishes, you see the OK message with the link of the ZIP log file.
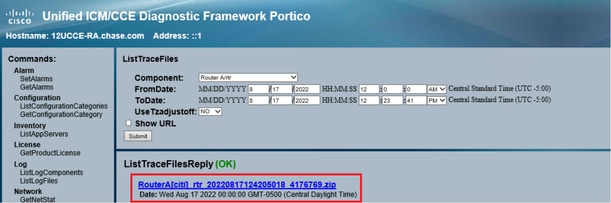
- Click the ZIP file link and Save the file in the location you choose.
Set Trace and Collect PCCE Logs
PCCE has its own tool to setup trace levels. It is not applicable to UCCE environment where Diagnostic Framework Portico or system CLI are the preferred ways to enable and collect logs.
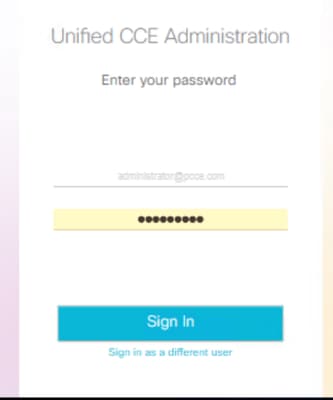
- From the PCCE AW server, open the Unified CCE Web Administration tool and log in to the Administrator account.
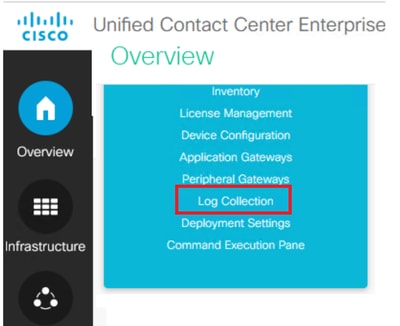
- Navigate to Overview > Infrastructure Settings > Log Collection in order to open the Log Collection page.
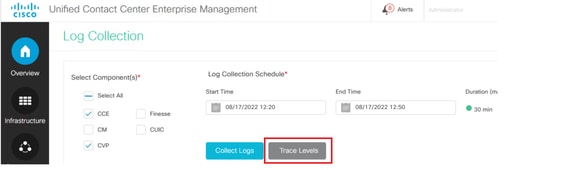
- On the Log Collection page, click Trace Levels which opens the Trace Levels dialog box.
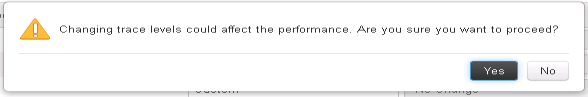
- Set the Trace Level to Detailed on CCE and leave it as No Change for CM and CVP, then click Update Trace Levels.
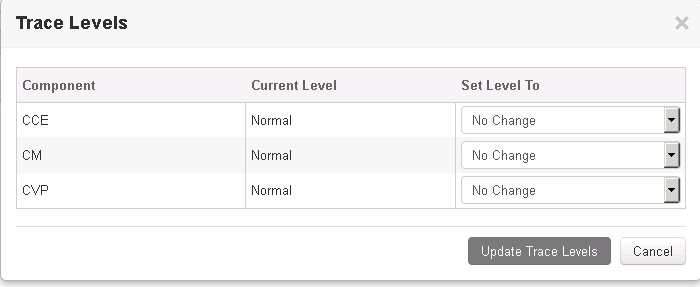
- Click Yes to acknowledge the Warning.
- After the problem is reproduced, open Unified CCE Administration and navigate back to System >Log Collection.
- Select CCE and CVP in the Components pane.
- Select the appropriate Log Collection Time (the default is the last 30 min).
- Click Collect Logs and Yes to the dialog warning. The log collection starts. Wait a few minutes before it finishes.

- Once finished, click Download button in the Actions column to download a zipped file with all logs in it. Save the zip file in any location you find appropriate.
Set Trace and Collect CUIC/Live Data/IDS Logs
Download logs with SSH
- Log in to the SSH Command Line (CLI) of CUIC, LD, and IDS.
- Run the command in order to collect CUIC related logs.
file get activelog /cuic/logs/cuic/*.* recurs compress reltime hours 1file get activelog /cuic/logs/cuicsrvr/*.* recurs compress reltime hours 1file get activelog tomcat/logs/*.* recurs compress - Run the command in order to collect LD related logs.
file get activelog livedata/logs/*.* - Run the command in order to collect IdS related logs.
file get activelog ids/log/*.* recurs compress reltime days 1 - These logs are stored on the SFTP server path: <IP address>\<date time stamp>\active_nnn.tgz , where nnn is timestamp in long format.
Download Logs with RTMT
- Download RTMT from OAMP page. Log in to https://<HOST ADDRESS>/oamp where HOST ADDRESS is the IP address of the server.
- Navigate to Tools > RTMT plugin download. Download and install the plugin.
- Launch RTMT and log in to the server with admin credentials.
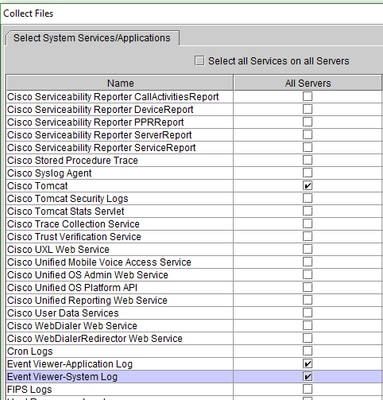
- Double click Trace and Log Central and then double click Collect Files.
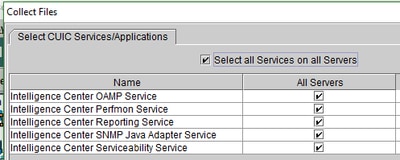
- You can see these tabs for the specific services. You must select all services/servers for CUIC, LD, and IDS.
For CUIC:
For LD: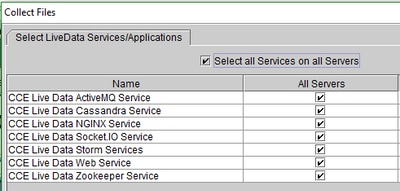
For IDS: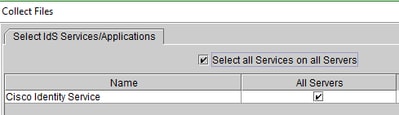
For Platform services, it is generally a good idea to select Tomcat and Event viewer logs:
- Select the Date and Time along with the destination folder in order to Save the logs.
Packet Capture on VoS (Finesse, CUIC, VVB)
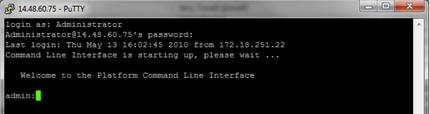
- Start the Capture
To start the capture, establish a SSH session to the VOS server authenticate with the Platform Administrator account.
1a. Command Syntax
The command isutils network captureand the syntax is as follows:Syntax:
utils network capture [options]
options optional
page,numeric,file fname,count num,size bytes,src addr,dest addr,port
num,host protocol addr
options are:
page
- pause output
numeric - show hosts as dotted IP
addresses
file fname - output the information to a file
Note: The file is saved in platform/cli/fname.cap
fname should not contain the "." character
count num - a
count of the number of packets to capture
Note: The maximum count
for the screen is 1000, for a file is 100000
size bytes -
the number of bytes of the packet to capture
Note: The maximum
number of bytes for the screen is 128
For a file it can be
any number or ALL
src addr - the source address of the
packet as a host name or IPV4 address
dest addr - the
destination address of the packet as a host name or IPV4 address
port
num - the port number of the packet (either src or dest)
host
protocol addr - the protocol should be one of the following:
ip/arp/rarp/all. The host address of the packet as a host name or IPV4
address. This option will display all packets to and from that address.
Note: If "host" is provided, do not provide "src" or "dest"1b. Capture All Traffics
For a typical capture, one can collect ALL packets of ALL sizes from and to ALL address into a capture file called packets.cap. To do this simply execute on the admin CLIutils network capture eth0 file packets count 100000 size all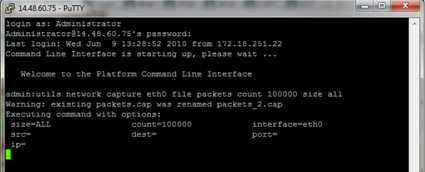
1c. Capture based on Port number
In order to troubleshoot a communications issue with the Cluster Manager, it can be desireable to use the port option to capture based on a specific port (8500).
For more information about which services require communications on each port, refer to theTCP and UDP Port Usage Guidefor the applicable version of the respective component.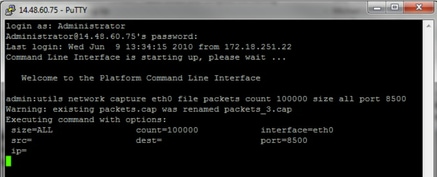
1d. Capture based on host
To Troubleshoot an issue with VOS and a particular host, it can be necessary to use the 'host' option to filter for traffic to and from a particular host.
It can also be necessary to exclude a particular host, in this case use a "!" in front of the IP. An example of this would beutils network capture eth0 file packets count 100000 size all host ip !10.1.1.1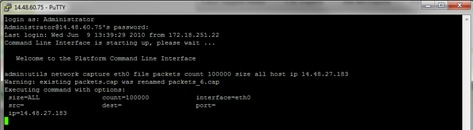
- Reproduce the problem symptom
While the capture has started to reproduce the problem symptom or condition so that the necessary packets are included in the capture. If the problem is intermittent, it can be necessary to run the capture for an extended period. If the capture ends, it is because the buffer is filled. Restart the capture and the previous capture is automatically renamed so the previous capture is not lost. If a capture is needed for an extended period of time, use a monitor session on a switch to capture at the network level.
- Stop the capture
To stop the capture, hold the Control key and press C on the keyboard. This causes the capture process to end and no new packets are added to the capture dump.
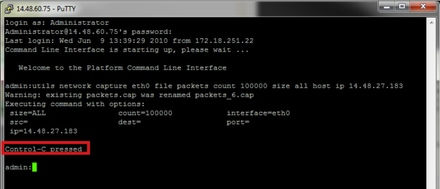
Once this is complete, a capture file is stored on the server in the location 'activelog platform/cli/'- Collect the capture from the server
The capture files are stored in activelog platform/cli/ location on the server. You can transfer the files through CLI to an SFTP server or to the local PC with the RTMT.4a. Transfer capture file through the CLI to an SFTP server
Use the commandfile get activelog platform/cli/packets.capto collect the packets.cap file to the SFTP server.
Alternatively, collect all .cap files stored on the server, use file get activelog platform/cli/*.cap.
Finally, fill in the SFTP server IP/FQDN, port, username, password, and directory information: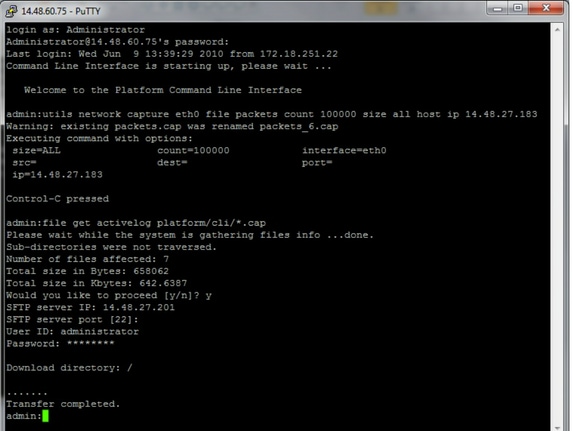
The CLI indicates success or failure of the file transfer to the SFTP server.
4b. Use RTMT to transfer a capture file to a local PC.
Launch the RTMT. If it is not installed on the local PC, install the appropriate version from the VOS Administration page and then navigate to the Applications > Plugins menu. Click System, then Trace & Log Central, then double click Collect Files. Click Next through the first menu.
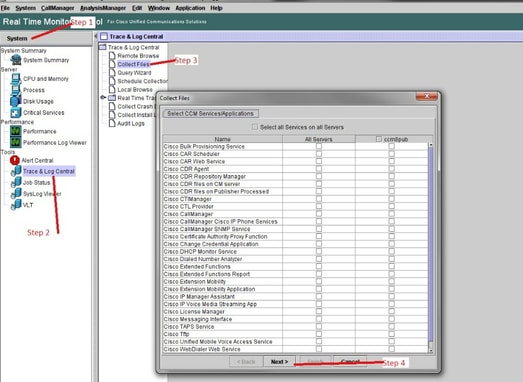
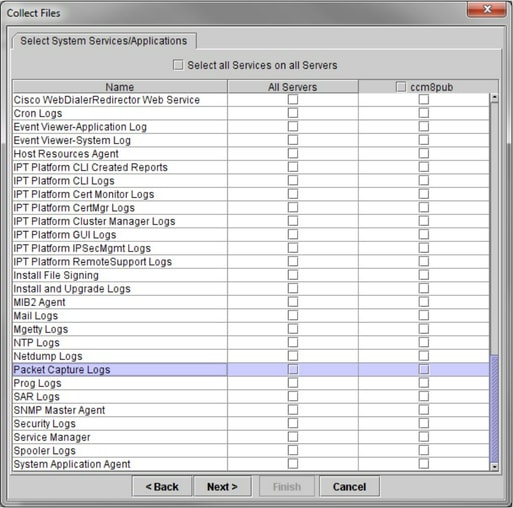
In the second menu, choose the checkbox for Packet Capture Logs on the server which the capture was performed, then click Next.
On the final screen, choose a time range when the capture was performed, and a download directory on the local PC.
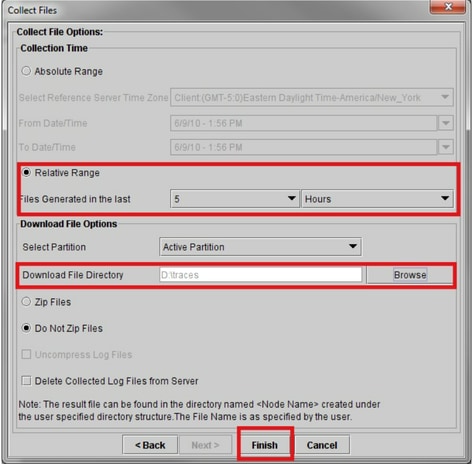
RTMT closes this window and proceeds to collect the file and store it on the local PC in the specified location.
Revision History
| Revision | Publish Date | Comments |
|---|---|---|
3.0 |
28-May-2025
|
Recertification |
2.0 |
25-Apr-2024
|
Updated Introduction, Alt Text, SEO, Machine Translation, and Formatting. |
1.0 |
31-Aug-2022
|
Initial Release |
Contributed by Cisco Engineers
- Sureshkumar MohanrajTechnical Consulting Engineer
 Feedback
Contact Cisco
- Open a Support Case

- (Requires a Cisco Service Contract)