Collect ACI Tech Supports and TAC Requested Outputs Guide
Available Languages
Contents
Introduction
This document describes the various logs and outputs that are required for troubleshooting when working with TAC for ACI.
Background Information
For a quick reference on what data to gather before opening a TAC case, refer to Table 1.
Table 1: Logs/Show tech collection matrix:
| Issues | What to Collect | Notes |
| Upgrade issues |
|
|
| Random Connectivity Issue |
|
|
| Complete Loss of Connectivity |
|
|
| Clustering Issues |
|
|
| Routing Issues |
|
|
| Node Crash/Unexpected Reload |
|
|
| APIC APP Issue |
|
ACI APIC and Switch
On-Demand TechSupport

Note: If your ACI Fabric is connected and claimed in Intersight, take your Tech Support file generation and upload it to the TAC SR, which is automated for the devices serial number provided during your case opening. The TAC Engineer can also manually trigger the Tech Support collection for other connected devices via Intersight to facilitate faster troubleshooting.
Trigger and Upload to Intersight via APIC - Nexus Insights Cloud Connector App
To use this method, refer to ACI Fabric must be connected and claimed on Intersight via the the APIC: Nexus Insights Cloud Connector app.
- Navigate to: APIC > Apps > Installed Apps > Open the NICC App > TAC Assist > Click Begin
- Select the node(s), then click Collect Logs.
- Once the Job Status is COMPLETE, click View Details.
- In the Job Details Page, under the Logs table, under File, find the Cloud Column.
- Click Upload for each devices TechSupport Bundle.
Trigger and Upload to Intersight via ND - Nexus Dashboard Insights
To use this method, refer to ACI Fabric must be connected and claimed on Intersight via Nexus Dashboard: Nexus Dashboard Insights.
- Navigate to: Nexus Dashboard > Admin Console > Services > Open Nexus Dashboard Insights > Troubleshoot > Log Collector.
- Click New Log Collection.
- Add a name to the log collection.
- Select a site.
- Enable the checkbox for Auto Upload Log Files.
- Click Select Nodes, and chose the node/s.
- Click Start Collection.
- TechSupport files are uploaded to intersight.com
- Once the upload completes, notify TAC the files are uploaded on Intersight.
- The TAC Engineer can move the files from Intersight to the TAC case for analysis.
Trigger via APIC UI
Create an On-Demand TechSupport Policy
- In the Menu Bar, click Admin > Import/Export > Export Policies > Right-click On-demand TechSupport > Create On-demand TechSupport.
- Enter the appropriate values in the fields of the Create On-Demand TechSupport dialog box.
- If a remote location is not available, check Export to Controller. Generated TechSupports are downloaded via the Operational Tab of the GUI once they have been generated.
- Check Include All Controllers in TechSupport to generate APIC TechSupports.
- The Source Nodes field allows you to specify switch nodes that generate a TechSupport.
- Click Submit to create the On-Demand TechSupport Policy.


Generate an On-Demand TechSupport.
- Navigate to an existing On-Demand TechSupport Policy. Created policies can be found at: Admin > Import/Export > Export Policies > On-Demand TechSupport > Expand On-Demand TechSupport Folder > Right-click the Policy to be used > Collect Tech Supports.
- Or Left-click the On-Demand TechSupport Policy to bring it up in the Main pane; then click the Wrench/Hammer icon and choose Collect Tech Supports.
- Choose Yes to begin collecting tech support information.

Collect the generated TechSupport.
- If Export to Controller was not enabled during TechSupport generation, the Export Destination (Remote Location) can be checked for all TechSupport files.
- If Export to Controller was enabled, navigate to the On-Demand TechSupport Policy that the TechSupports were generated against. Created policies can be found at Admin > Import/Export > Export Policies > On-Demand TechSupport.
- The generated TechSupports can be found within the Operational Tab of the On-Demand TechSupport Policy. Each file has a link to download via http/https. Each node has three links, one link tied to each file.

On-Demand TechSupport Files Explained
If the TechSupports files were generated with the Export to Controller option, the GUI shows three URLs per ACI node (APIC node or Switch node). Each URL is a different log file type and contains unique information. TAC typically requires all three files to be uploaded per node to receive all logging for a complete analysis.
Each URL maps to one of the three file types:
| Category | Typical Suffix | Useful for: | File Size |
| Export | _1of3.tgz | Audit/Fault Logs | Small-Med |
| Logs | _logs_3of3.tgz | Process Logs | Largest |
| DB | _db_2of3.tgz | MO Dump | Small |
If there is an issue downloading tech-support using the browser link, directly download the files from the APIC storage using an scp or sftp client such as WinSCP or FileZilla.
1. Connect (sftp) to each APIC. The collected tech-support files are stored across all available APICs, so, it is important to check each APIC for the collected tech-support files.

2. Navigate to /data/techsupport folder in the connected APIC (repeat this step in all APIC controllers).

3. Look for the files with a name that contains the On-Demand TechSupport Policy Name (in this example, it is ABCTECH) and download those files to your computer.
TechSupport Local
On-Demand TechSupport is always preferred to a techsupport local because an On-Demand TechSupport provides a more complete picture. However, it relies on a fully-fit APIC cluster as the collection is triggered via policy.
Note: A Techsupport local must be triggered on each individual node, so, if you plan to collect techsupport local for all APICs, the cmd must be run on each APIC in the cluster separately.
TechSupport Local Scenarios:
- APIC is not fully-fit.
- ACI switch is not yet discovered by the APIC.
- ACI switch has lost communication with the APIC.
- The Internal process is malfunctioning, which is preventing the On-Demand TechSupport to fully operate (rare).
Trigger via APIC CLI
- Open an SSH session with the APIC with admin credentials.
- If you cannot use admin credentials to log in, use the username rescue-user. The password can be the same as the admin local user.
- Run the command bash -c "techsupport local".
Using username "admin". Application Policy Infrastructure Controller
apic1# bash -c "techsupport local" This command is being deprecated on APIC controller, please use NXOS-style equivalent command Running bash commands Completed 1 of 10 commands ... Completed 10 of 10 commands Starting data compression Techsupport collected at /data/techsupport/local_apic1_2018-05-29T08-17.tgz . Please remove the file once done. - Download the local techsupport.
- Option A: Download the techsupport file using SCP:
- WinSCP or pscp.exe (Windows Users).
- Native SCP client (MAC Users).
- Option B: Download the techsupport file using HTTPS:
- Open a browser, such as Chrome or Firefox.
- Navigate to: https://<aci.apic.ip.addr>/files/<apic#>/techsupport/<ts_filename>
- Example: https://a.p.i.c/files/1/techsupport/local_apic1_2018-05-29T08-17.tgz
- Log in with admin credentials.
- If prompted, select Save File on the browser download prompt.
- Option A: Download the techsupport file using SCP:
Trigger via Switch CLI
- Open an SSH session with the ACI switch with admin credentials.
- If the switch is not yet discovered by the APIC, use the username admin.
- Run the command: "techsupport local".
fab5-leaf1# techsupport local
Running bash commands
Completed 1 of 9 commands
...
Completed 9 of 9 commands
Starting data compression
Techsupport collected at /data/techsupport/local_fab5-leaf1_2018-05-29T08-16.tgz . Please remove the file once done
3. Download the local techsupport.
- Option A: Download the techsupport file from the ACI switch using SCP:
- WinSCP or pscp.exe (Windows Users).
- Native SCP client (MAC Users).
- Option B: Download the techsupport file using HTTPS via the APIC:
- Log in to an APIC CLI (note which APIC is used for step 4).
- Transfer the techsupport file from the ACI switch to the APIC using this command:
- scp <node-name>:/data/techsupport/<ts_filename> /data/techsupport
- Example: apic1# scp fab5-leaf1:/data/techsupport/local_fab5-leaf1_2018-05-29T08-16.tgz /data/techsupport
- Open a browser, such as Chrome or Firefox.
- Navigate to: https://<aci.apic.ip.addr>/files/<apic#>/techsupport/<ts_filename>
- Example: https://a.p.i.c/files/1/techsupport/local_fab5-leaf1_2018-05-29T08-16.tgz
- Log in with admin credentials.
- If prompted, select Save File on the browser download prompt.
CIMC TechSupport
Trigger via CIMC UI
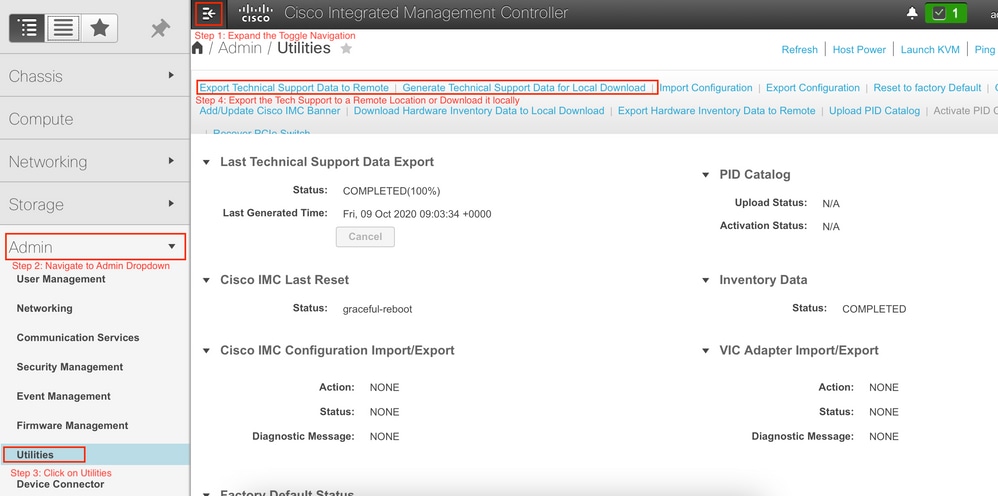
A TechSupport from APIC CIMC can be collected to review logs related to the APICs Chassis. A CIMC show tech can be captured locally or sent to a remote location from the Utilities section of CIMC Admin tab.
Trigger via CIMC CLI
On the APIC CIMC CLI enter:
~ # scope cimc
~ /cimc # scope tech-support
~ /cimc/tech-support # set tftp-ip 192.168.1.1
~ /cimc/tech-support *# set path \techsupport\showtech
~ /cimc/tech-support *# commit
~ /cimc/tech-support *# start
Parsing CIMC TechSupports
Refer to some of the key fields from the show tech commands:
| TechSupport File/Location |
Description |
| var/ |
Contains detailed logs and a status of all monitored services. It has service information files such as the configurations of SOL and IPMI sensor alarms. |
| var/log |
Contains the rolling volatile log messages. |
| obfl/ |
Contains the rolling non-volatile log messages. |
| met/ |
Non-volatile configurations and SEL. |
| mp/ |
The show tech-support text files, along with BIOS tech-support text files. The text files contain all process, network, system, mezzanine, and BIOS state information. |
| mctool |
Get basic information on the state of the CIMC. |
| network |
Receive current network configuration and socket information. |
| obfl |
Obtain live obfl (On-Board Failure Logs). |
| messages |
Receive live /var/log/messages file. |
| alarms |
Lists sensors in alarm states. |
| sensors |
Current sensor readings from IPMI. |
| power |
Current power state of the x86. |
Extended Audits, Events, Faults and More (TacOutput)
TAC can request additional basic outputs such as faults, events, and audits, which are generally required for RCA.
As of today, the show techs already include a subset of these objects, however, only the last 10,000 records. In some cases, TAC requires full set of records, which goes beyond 10,000 records.
Trigger via Trigger TACOutput - 5.2/5.3/6.0(3d) and Later Releases
For ACI Fabrics running version 5.2/5.3/6.0(3d) and later releases, trigger tacoutput provides a simplified collection interface for events, faults, audits, and other troubleshooting outputs):
apic1# trigger tacoutput
Select corresponding numbers of objects to collect. Separate numbers with commas. *Note, topSystem, fabricNode, and firmwareARunning are automatically included.
Ex: 1,2,3,4,5
1. faultInfo *collected unfiltered
2. faultRecord
3. eventRecord
4. aaaModLR *collected unfiltered
5. polDeploymentRecord
6. epRecord
7. healthRecord
8. healthInst *collected unfiltered
Enter selections: 1,2,3,4,5,6,7,8
Enter record start date (format: 2019-12-15T00:00:00) *default is one month prior to current date:
Enter record end date (format: 2019-12-15T00:00:00) *default is current date:

... collection runs...

2021-12-17T08:19:59 TacOutput collection completed.
2021-12-17T08:19:59 Verify files and file sizes at /tmp/TacOutput2021-12-17T08-16-19
2021-12-17T08:19:59 Compressing files...
2021-12-17T08:20:01 Compression completed
Logs available for SCP or SFTP download from /data/techsupport/TacOutput-2021-11-17T08:18:06-to-2021-12-17T08:18:06.tgz
To download through your web browser go to https://<apic address>/files/1/techsupport/TacOutput-2021-11-17T08:18:06-to-2021-12-17T08:18:06.tgz
Note: in the URL previous 1 denotes the APIC ID 1, if script was run on APIC-n, then n must be specified in the URL (n = APIC-ID).

To remove files when done run
rm -rf /tmp/TacOutput2021-12-17T08-16-19
rm -f /data/techsupport/TacOutput-2021-11-17T08:18:06-to-2021-12-17T08:18:06.tgz
Trigger via Collect TACOutputs Script
For ACI Fabrics running pre 5.2/5.3/6.0(3d), there is a Collect TacOutput Script available within the aci-tac-scripts repository, which serves a similar interface as the trigger tacoutput command:
apic# /tmp/collectTacOutputs.sh
Select corresponding numbers of objects to collect. Separate numbers with commas. *Note, topSystem, fabricNode, and firmwareARunning are automatically included.
Ex: 1,2,3,4,5
1. faultInfo *collected unfiltered
2. faultRecord
3. eventRecord
4. aaaModLR
5. polDeploymentRecord
6. epRecord
7. healthRecord
8. healthInst *collected unfiltered
Enter selections: 1,2,3,4,5,6,7,8
Enter record start date (format: 2019-12-15T00:00:00) *default is one month prior to current date: 2019-12-25T00:00:00
Enter record end date (format: 2019-12-15T00:00:00) *default is current date: 2020-01-05T00:00:00

...script collection runs...

Compression completed
Logs available for SCP or SFTP download from /data/techsupport/TacOutput-2019-12-25T00:00:00-to-2020-01-05T00:00:00.tgz
To download through your web browser go to https:///files/1/techsupport/TacOutput-2019-12-25T00:00:00-to-2020-01-05T00:00:00.tgz
Crash/Core Files
Collect via APIC UI
The ACI switch node and APIC have numerous processes that controls various functional aspects on the system. If the system has a software failure in a particular process, a core file is generated and the process is reloaded. When a process crashes and a core file is generated, a fault and an event is generated. When the process on the switch/APIC crashes, the core file is compressed and copied to the APIC.
The APIC GUI provides a central location to collect the core files for the fabric nodes. A new export policy can be created from Admin > IMPORT/EXPORT in Export Policies > Core.
There is a default core policy where files can be downloaded directly. All generated core files attempt a transfer to the APIC controller when generated. If successful, they can be found under the default core policy.

You can view the generated (and exported) core files by reviewing the Operational tab. In this tab, you can review the node which generated the core files (service crashed), collection time, and so on.

You can download these files to your desktop by clicking the Export Location link; use your APIC credentials when prompted.

Alternatively, you can access the core files via SSH/SCP through the APIC at /data/techsupport folder on the APIC where the core file is located.
Note: The core file is available at /data/techsupport on one APIC in the cluster; the exact APIC where the core file resides can be found by the Export Location path as shown in the GUI. For example, if the Export Location begins with files/3/, the file is located on node 3 (APIC3).
Collect via Switch CLI
In some exceptions, the cores from the Leafs or Spines cannot be copied to the APIC and they can be found in /logflash/core of the switches. They can be retrieved by SCP to the switch directly or by moving the file to the APIC and then SCP out of APIC.
The collection script attempts to collect the core files in /logflash/core as well as additional crash related information:
#Run on an ACI Leaf Node, Copy from here
bash -c '
# set this to correct leaf name
leaf="$(hostname)""_data"

# collect data
mkdir /data/techsupport/$leaf
cd /data/techsupport/$leaf
show system reset-reason > show_sys_rr.log
vsh -c "show logging onboard internal reset-reason" > show_logg_onb_internal_rr.log
vsh -c "show logging onboard stack-trace" > show_logg_onb_stack-trace.log
vsh -c "show logging onboard card-boot-history" > show_logg_onb_card-boot-history.log
vsh -c "show processes log details" > show_process_log_detail.log
df -h > df.log
ls -liah /logflash/core > logflash_core.log
dmesg -T > ./dmesg
cp -rf /mnt/ifc/log/last_run/ ./
mkdir bootflash; cp /bootflash/mem_log* ./bootflash/
mkdir mnt_pss; cp -rf /mnt/pss/* ./mnt_pss/
mkdir mnt_pstore; cp -rf /mnt/pstore/* ./mnt_pstore/
mkdir logflash_core; cp -rf /logflash/core ./logflash_core

# compress and combine files
cd /data/techsupport
zipfile="$leaf"".tgz"
tar -zcvf ./$zipfile ./$leaf/*
rm -rf ./$leaf/*
rmdir ./$leaf

echo ""
echo " ///// Please collect /data/techsupport/"$zipfile" and upload to SR ///////"
'
#copy to here
APIC App TechSupport
Trigger via APIC UI
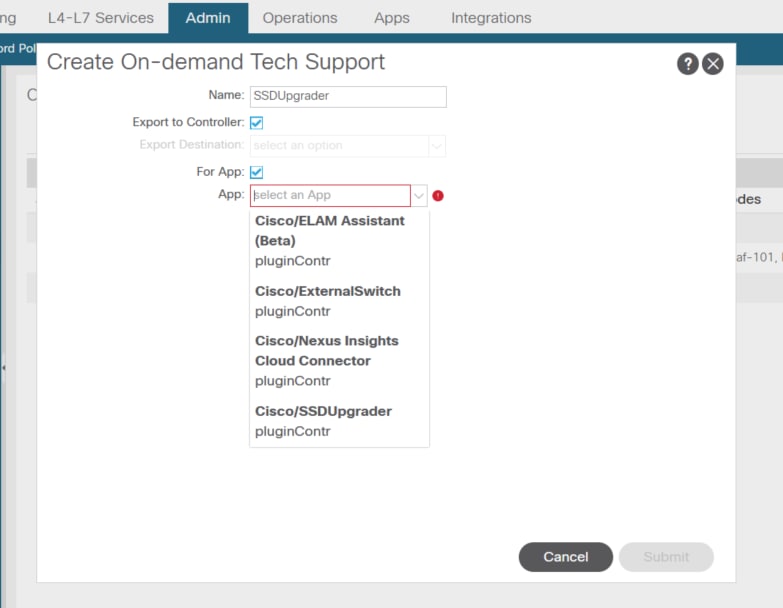
If an APIC App is in use and is found to be having issues, a specific On-Demand TechSupport Policy can be created against the App to collect its logs for analysis. The Policy can be created at Admin > Import/Export > Export Policies > Create On-Demand Tech Support. There is a specific option For App which allows the user to select an APIC App to collect logs against:
Once the policy is created, the collection can be triggered against that policy to collect the techsupport and make it available for download from the operational tab if Export to Controller was selected.
Application Virtual Edge (AVE)
Vem-Support
Trigger via AVE Node CLI
Log in to the AVE CLI and run this command. The show tech is collected in the /tmp directory and you can use SCP to export it:
cisco-ave:~$ vem-support all
This can take some time. Please wait.
Copying dpa logs
...
Generated  /tmp/dbgexp_ave_sw-dvs-60_10.48.16.46_2019-0226-1408_logs.tgz

cisco-ave:tmp$ tar -tf dbgexp_ave_sw-dvs-60_10.48.16.46_2019-0226-1408_logs.tgz
dbgexp_ave_sw-dvs-60_10.48.16.46_2019-0226-1408_logs/
dbgexp_ave_sw-dvs-60_10.48.16.46_2019-0226-1408_logs/cisco-vemlog.txt
dbgexp_ave_sw-dvs-60_10.48.16.46_2019-0226-1408_logs/cisco-vem-support.txt
dbgexp_ave_sw-dvs-60_10.48.16.46_2019-0226-1408_logs/cisco-vemdpa.txt
...
dbgexp_ave_sw-dvs-60_10.48.16.46_2019-0226-1408_logs/log/redis/
dbgexp_ave_sw-dvs-60_10.48.16.46_2019-0226-1408_logs/log/supervisor/
vCenter/ESXI Host Logs
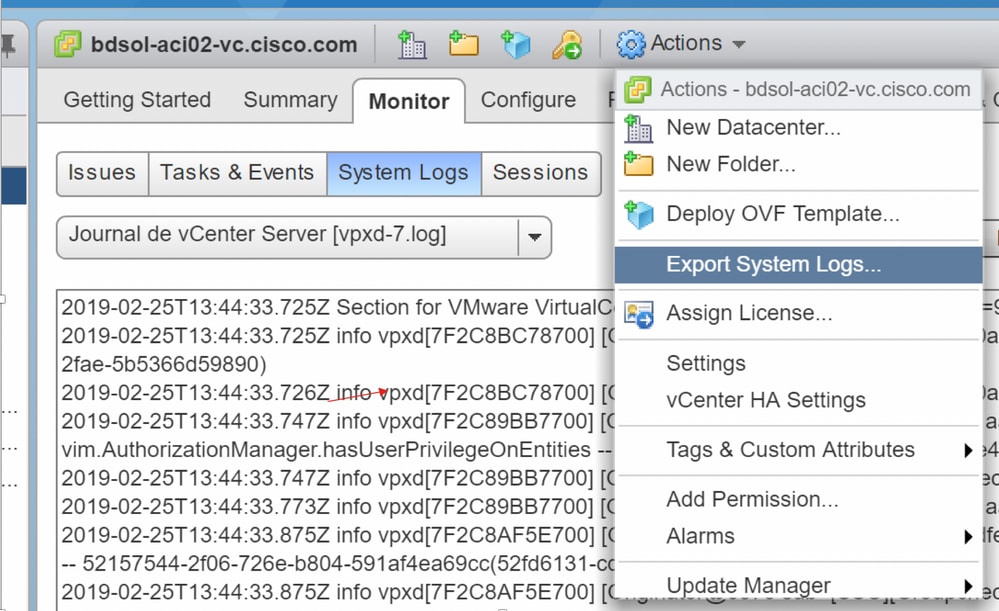
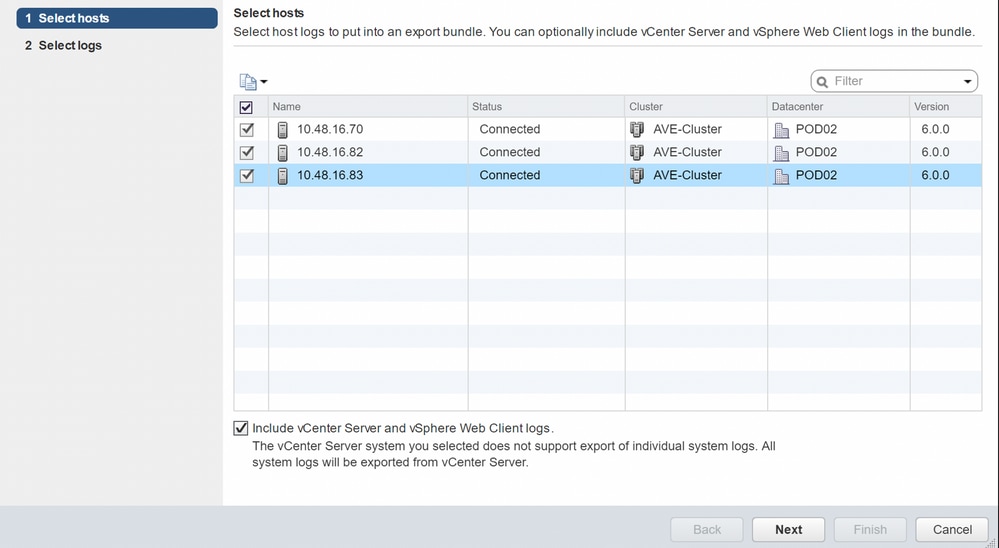
Trigger via vCenter/ESXi UI
Vcenter and ESX host logs can be exported:
Nexus Dashboard Orchestrator (NDO), Previously MSO
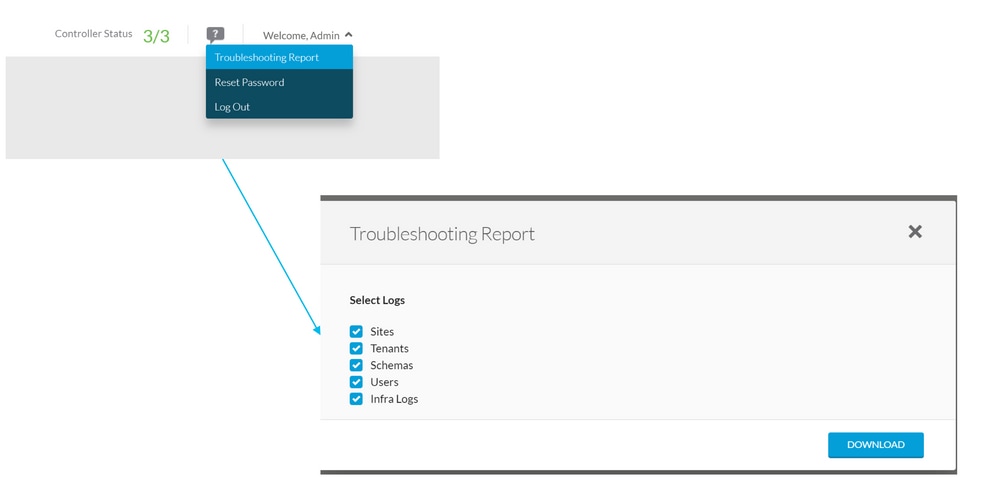
Troubleshooting Report
Trigger via NDO/MSO UI - MSO Pre-2.x
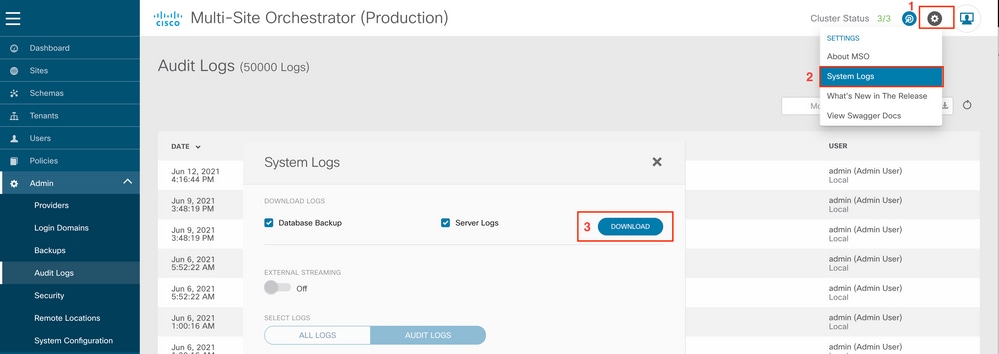
Trigger via NDO/MSO UI - MSO Version 2.x
1. From MSO GUI, click the Settings icon.
2. Select System Logs from the drop-down menu.
3. Click the Download button from the pop-up window.
Trigger via NDO/MSO UI - MSO Version 3.x and Higher
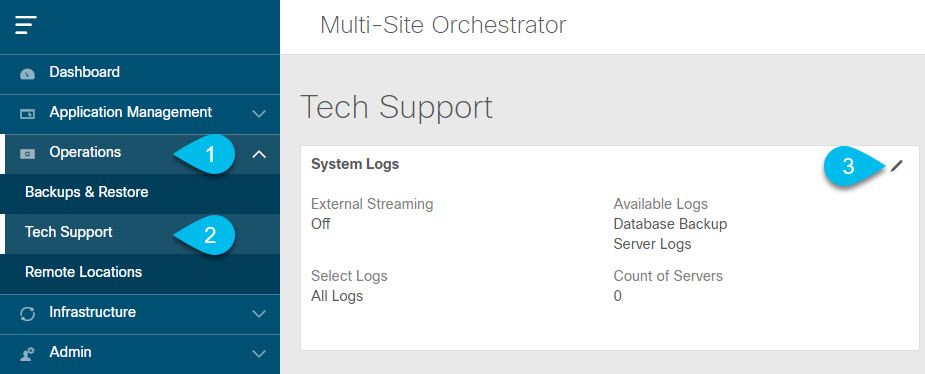 System Logs
1. From the MSO GUI, in the Main Menu > Open the System Logs screen > Select Operations > Tech Support.
2. In the top right corner of the System Logs frame > Click the Edit button.
 Upload
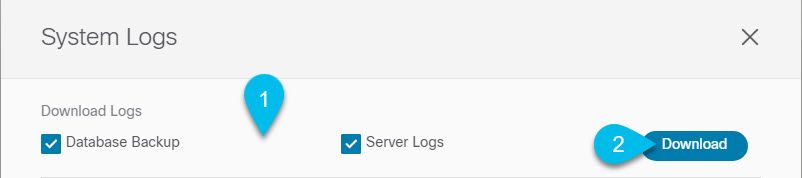
3. Select which logs you want to download.
4. Click the Download button.
An archive of the selected items is downloaded to your system. The report contains this information:
- All schemas
- Site definitions
- Tenant definitions
- User definitions in JSON format
- All logs of containers in the infra_logs.txt file
Stream via NDO/MSO UI - MSO Version 3.x and Higher
The System Logs can be streamed to an External Analyzer. For more details on how to send the logs to an external log analyzer tool in real time, refer to the:
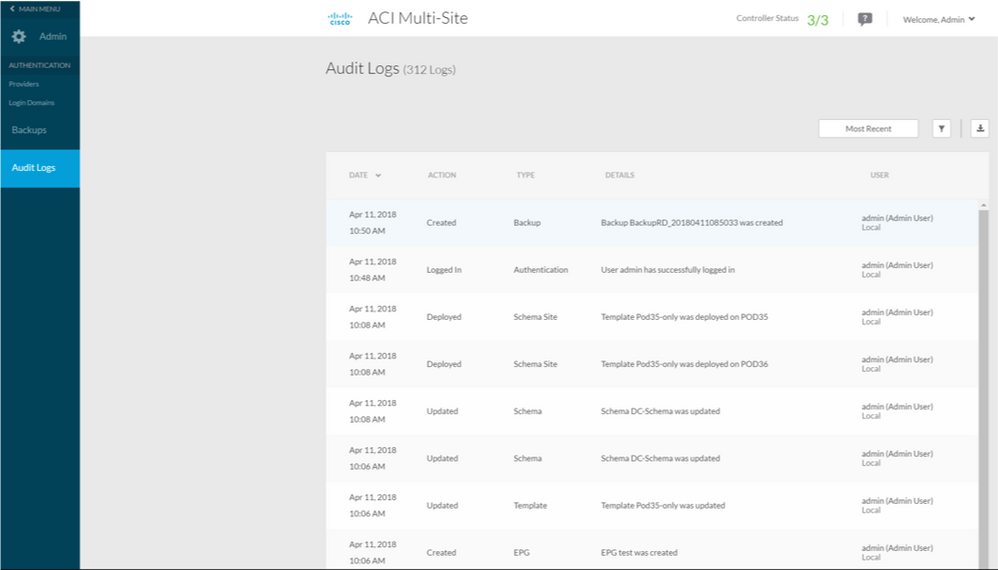
Standalone Audit Logs
Collection via NDO/MSO UI
MSC Audit Logs can be downloaded in JSON on CSV Format:
Revision History
| Revision | Publish Date | Comments |
|---|---|---|
9.0 |
08-Jun-2026
|
Updated spelling, grammar, sentence structure, edited alt text, and spacing. |
8.0 |
06-May-2024
|
Updated PII, Title, Machine Translation, Note Containers, and Formatting. |
7.0 |
23-Apr-2024
|
Format update and links to Device Connector guide for APIC and ND |
5.0 |
27-May-2022
|
TechSupport Generation and Upload to Intersight via APIC/ND was updated. |
4.0 |
16-Mar-2022
|
Added path to TacOutput script on GIT. |
3.0 |
22-Feb-2022
|
Minor Update. |
2.0 |
17-Dec-2021
|
Added "trigger tacoutput" APIC CLI to Document. |
1.0 |
06-Sep-2021
|
Initial Release |
 Feedback
Contact Cisco
- Open a Support Case

- (Requires a Cisco Service Contract)