The Power of Data Science in Product Management: An IoT Use Case White Paper
Available Languages
Bias-Free Language
The documentation set for this product strives to use bias-free language. For the purposes of this documentation set, bias-free is defined as language that does not imply discrimination based on age, disability, gender, racial identity, ethnic identity, sexual orientation, socioeconomic status, and intersectionality. Exceptions may be present in the documentation due to language that is hardcoded in the user interfaces of the product software, language used based on RFP documentation, or language that is used by a referenced third-party product. Learn more about how Cisco is using Inclusive Language.
Hyper-awareness, informed decision-making, and rapid execution are at the heart of how I run my business as an executive. And when I think about it, I realize that the emphasis on these three components of what is now conceptualized as digital agility started when I was in college. One chapter of our Strategic Marketing course was about the balanced scorecard—a concept developed by Dr. Robert Kaplan of Harvard University and Dr. David Norton.
I have been amazed by the power of this framework developed “for guiding and evaluating the journey that information age companies must make to create future value through investment in customers, suppliers, employees, processes, technology, and innovation.” (Kaplan and Norton)
Years spent in business consulting, business development, solution development, and product management have confirmed the simple intuition I had at that time:
Having the right Information, with the right level of granularity, at the right time, has a direct impact on our ability to execute a strategy. This in turn can impact our performance, and ultimately our leadership capabilities.
Today, as a services product management executive, I continually use input from various sources to monitor and assemble a fast but comprehensive picture of the business I lead. I focus on both the financial and operational measures that are in line with the strategy that I define and agree upon with my team at the beginning of each fiscal year. This important step takes place as part of the definition of our Vision, Values, Method, Obstacles, and Measurements (V2MOM).
On a yearly and quarterly basis, I undertake a planning and forecasting exercise with my senior leadership team, operations, and finance. This exercise helps in predicting the yearly and quarterly performance of my organization.
This means having a deep understanding of historical performance, current trends, anticipated future product and services booking trends, foreseen special events, product roadmap events, services roadmap events, geo specifics, service pipeline, renewals pipeline, consumption patterns, industry vertical patterns, etc.
Based on this nonexhaustive list of information sources, I can then identify or anticipate potential changes in our business environment that we will take into account when making final performance assumptions to be included in our predictive model. This model helps us make informed decisions based on a solid level of business intelligence and has also a positive impact on our operational efficiency.
Once the target in terms of annual bookings, total bookings, roadmap items, revenue, gross margin, attach rate, penetration rate, and renewal rate has been defined for the period at stake, I monitor and track the successful execution of the strategic plan, thanks to daily, weekly, monthly, and quarterly reports. And each of them has a specific scope and outcome, with the potential to lead to a specific action.
A variation identified or anticipated may lead to adjustments of priorities, focus areas, resource allocation, leadership interlocks, communication plan, or sales enablement plan, or to the adjustment of any relevant variable that can keep us on track to meet or exceed our planned performance for the quarter and ultimately for the fiscal year. This happens with the full consciousness that beyond making the decision, putting it into effect is paramount.
As part of our quarterly activities, my team created the concept of “Feed Our Brain” (FOB) sessions two years ago, in which anyone can identify a topic they are expert in and share it with the rest of the team during a knowledge transfer session. Recently, one of these sessions was given by Richard Spoor and Vassilis Tzavaras on the power of data insights in product management. I found the session interesting and challenged them to write a white paper on the topic. As you will see here, the work done by the team to discover, interpret, and communicate meaningful data patterns and insights is absolutely critical to business product management, and can represent best practices.
—Willy Fotso Guifo, Global Director, CX – IBN IoT Services Business Product Management
Cisco customers and partners are trying to find ways to respond appropriately in social and competitive ways to address and counter negative impacts on their business. This results in shifting priorities that affect spending and buying behavior.
Cisco’s rich data set helps identify such behavioral patterns where Cisco can, or even must, realign its service offers to enable customers and partners to achieve their business and socioeconomic goals.
Different audiences have different asks, requiring a unique approach. To accommodate this, specific data-driven approaches are applied for each use case to capture valuable insights from large amounts of data to arrive at a practical solution.
We live in interesting times, where pandemics and macro-environmental and geopolitical challenges impact customers and partners enormously. How do Cisco customers react, respond, and reprioritize their private life, their work, and ultimately their investments and budgets?
Like Cisco, companies around the world are highly dependent on how customers and partners adjust their spending and buying behavior to adapt to these changing circumstances, with limited budgets and uncertain prospects. It offers an opportunity for us to help customers in their responses by exploring, analyzing, and aggregating large data sets to provide actionable information and create intuitive visualization to convey those results to a broad audience.
Cisco® Internet of Things (IoT) accelerates digital transformation, delivering insight and action from data. We support customers around the globe, across all industries, with their IoT deployments and help them securely and automatically connect their IoT devices to the network to extract, compute, and move their IoT data and drive better business outcomes.
As CX IoT Services, we are the product lifecycle owner. We are accountable for defining, validating, creating, mapping, forecasting, and managing the Services Success Portfolio related to Cisco’s IoT Products and Solutions Portfolio. With the breadth of industries, customers, and data available, we are offered a unique opportunity to develop and test reports that provide insights into the aforementioned dynamics. Such reports allow us to be more proactively aware of changes in business metrics, to quickly respond to any reverse trends observed, and to measure the effectiveness of the actions taken. These rather internal-sounding objectives also identify market trends and behavior that allow Cisco to reassess and realign the appropriate service offers to help its customers and partners respond more successfully and make Cisco more relevant as a business partner supporting their digital transformation, rather than just as a vendor.
The desire to become and remain such internal and external added-value partners sparked a need to innovate and apply data science techniques to create automated reports that perform quantitative analysis, algorithms, and processes that provide comprehensive insights and answers to our business. Data science is an interdisciplinary field that uses scientific methods, processes, algorithms, and systems to extract knowledge and insights from data and apply knowledge and actionable insights from data across a broad range of application domains. With the application of data science principles of automation, the CX IoT Services team has developed a high-quality, consistent data mining approach to each use case that executes operational tasks and monitors, analyzes, and tracks our business while identifying, driving, and measuring performance improvements.
This automation has reduced operational manual work and human errors, has improved reporting, and has resulted in a consistent quality of the information shared, focused on strategic and tactical market and industry trend analyses. The reports allow us to identify areas at risk and areas that need improvement. This consistent stream of information creates a baseline against we measure the improvement and, therefore, the effectiveness of the actions taken in response to the new reality. Tactical management data helps us drive conversations to improve performance or any other key performance indicators (KPIs) that may need attention.
This paper describes the methodology applied, the reports generated per use case, and how each report triggered the development of new detailed reports, zooming into other drivers and getting closure to understand customer and partner buying behaviors and how Cisco IoT Support Services align to these.
There are four types, or stages, of business analytics. Each brings us closer to achieving real-time and predictive insight. The four types (discussed below) answer everything we need to know, from what is going on in the business to what services and solutions are being adopted and need potential optimization. The more conclusions we reach through this process, the more the tactical and strategic questions bring us closer to the core of what we want to achieve and influence.
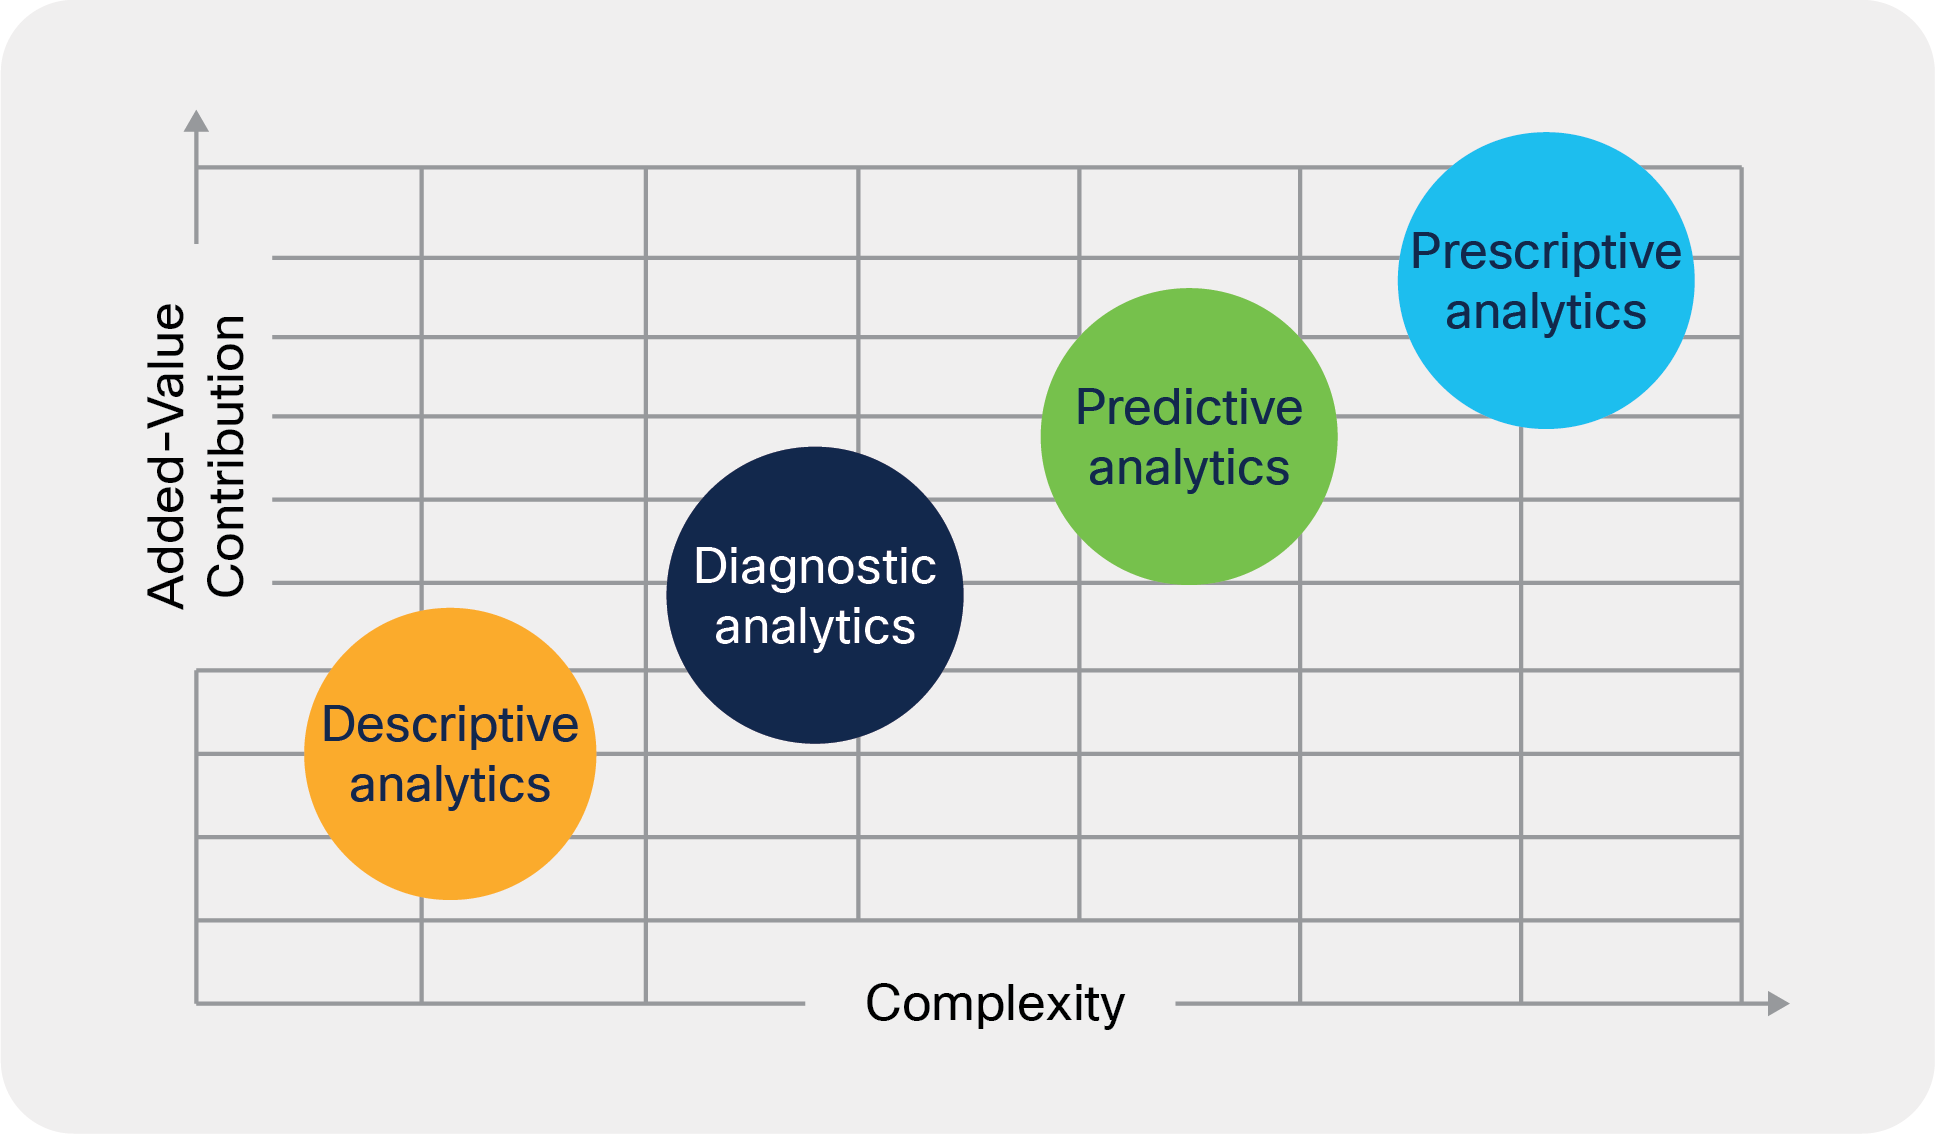
The four stages of business analytics
Descriptive analytics – “what happened?”
Descriptive analytics involves summarizing existing data to better understand what has happened or what is currently happening. This stage is the simplest form of data analytics, as it uses simple data mining and aggregation techniques. Descriptive analytics can help identify strengths and weaknesses and provide insight into behavior patterns.
Diagnostic analytics – “why did it happen?”
Diagnostic analytics focuses on historical performance to understand why something is happening. In this stage, we take a deeper look at the data to determine the root cause of a problem. Diagnostic analytics helps explain why our KPIs have increased or decreased over time.
Predictive analytics – “what is likely to happen?”
Predictive analytics predicts future trends and potential scenarios by developing forecast models using statistical models and machine learning (ML) techniques (further discussed in the “Artificial Intelligence: The Art of the Possible” section). Using the findings of the previous two stages, we develop models with higher accuracy due to an increased understanding of key drivers and parameters. We use quantitative analysis to forecast trends, correlations, and best-case and worst-case scenarios. In predictive analytics, we forecast how the business will evolve to prioritize focus areas to reach our business goals.
Prescriptive analytics – “what should be done?”
Prescriptive analytics provides recommendations for the next best action to mitigate a future problem or benefit from a promising trend based on the forecast.
Using this framework, the continuous stream of data brings more information that captures more data insights that ultimately trigger new questions. This creates a sustainable data cycle of constantly discovering and capturing value from a consistent stream of information.
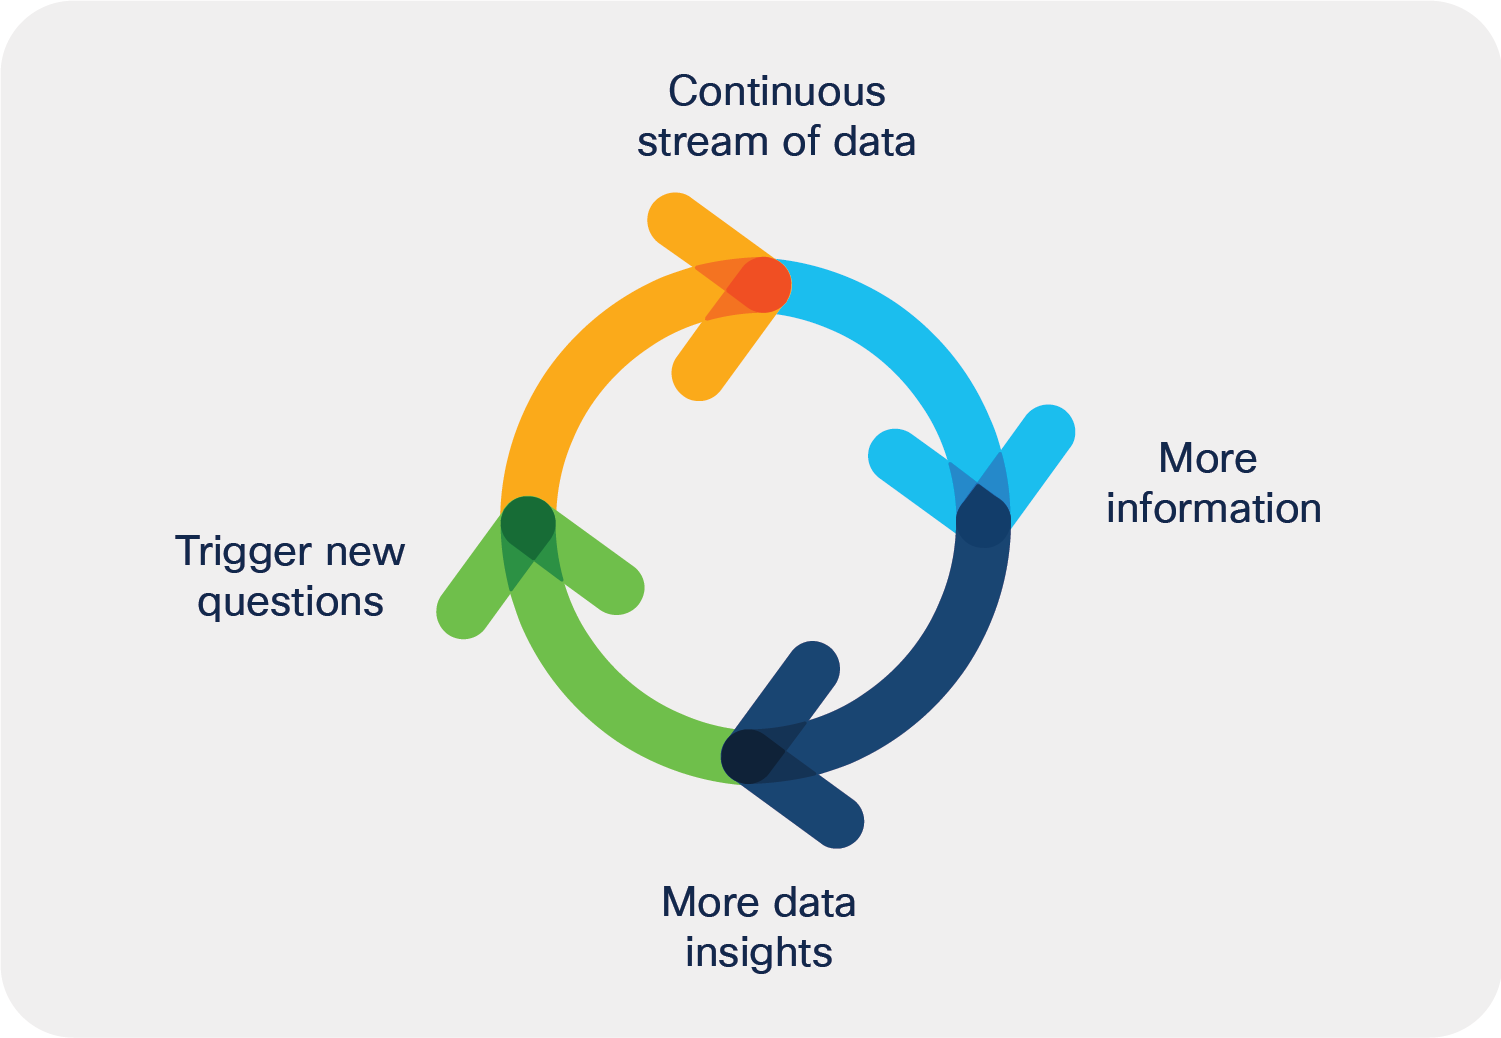
Sustainable data cycle of information
When receiving an ask, we solicit input and parameters to translate the problem statement into a data query. This query is created and run in the Business Intelligence (BI) application to retrieve relevant data. Having a deep understanding of the ask's problem statement and defining the output is crucial for developing the appropriate query to execute our framework. In order to gain deeper insights, optimize business processes, and make data-driven decisions, we harness data beyond the basic BI application. While gathering the information from the BI application, we apply the four business analytics types to interpret all the available data, with the goal of delivering advanced analytics with valuable insights for tactical and operational decisions.
Challenge
● Raw data not being used to its full potential.
● Remaining Digitally Agile through Hyper awareness and rapid execution for an improved customer experie.
Solution
● Leveraging the four types of business analytics we equip ourselves to understand and explain trends, discover patterns, predict future outcomes and provide recommendations per scenario.
Outcome
● Turning raw data into useful, useable information that can inform business decisions.
● The four types of business analytics help us become more aware of the business performance while providing valuable insights that result in informed recommendations.
● Helps form strategies that can be developed in the area of targeted marketing.
We have selected four use cases below to illustrate how we provide insights and data-driven capabilities to run our business:
Use case 1: Measuring business performance
Tracking the business against the plan and monitoring how business areas are performing to manage our performance proactively and efficiently.
Use case 2: Industry and market trends
Comparing industry data over a set time period, designed to identify trends or results that could be used to map business strategy.
Use case 3: Renewals product lifecycle management
Tracking and monitoring renewal opportunities and ensuring the highest conversion rate.
Use case 4: Effectiveness of launches
Monitoring the progress of KPIs for various launches to decide if a specific pilot is worth pursuing on a global scale.
1. Measuring business performance
Awareness of business performance and progress toward achieving goals is crucial. Gathering relevant KPIs to monitor our business rigorously helps us present the performance for each metric. We have developed tools that give us insight into how we are trending and that highlight areas of optimization to help us respond in time to ensure that we meet our goals. With this tool, we rigorously monitor our KPIs for IoT Services. Doing so provides a unique opportunity to have the latest information regarding trends and insights into our activities.
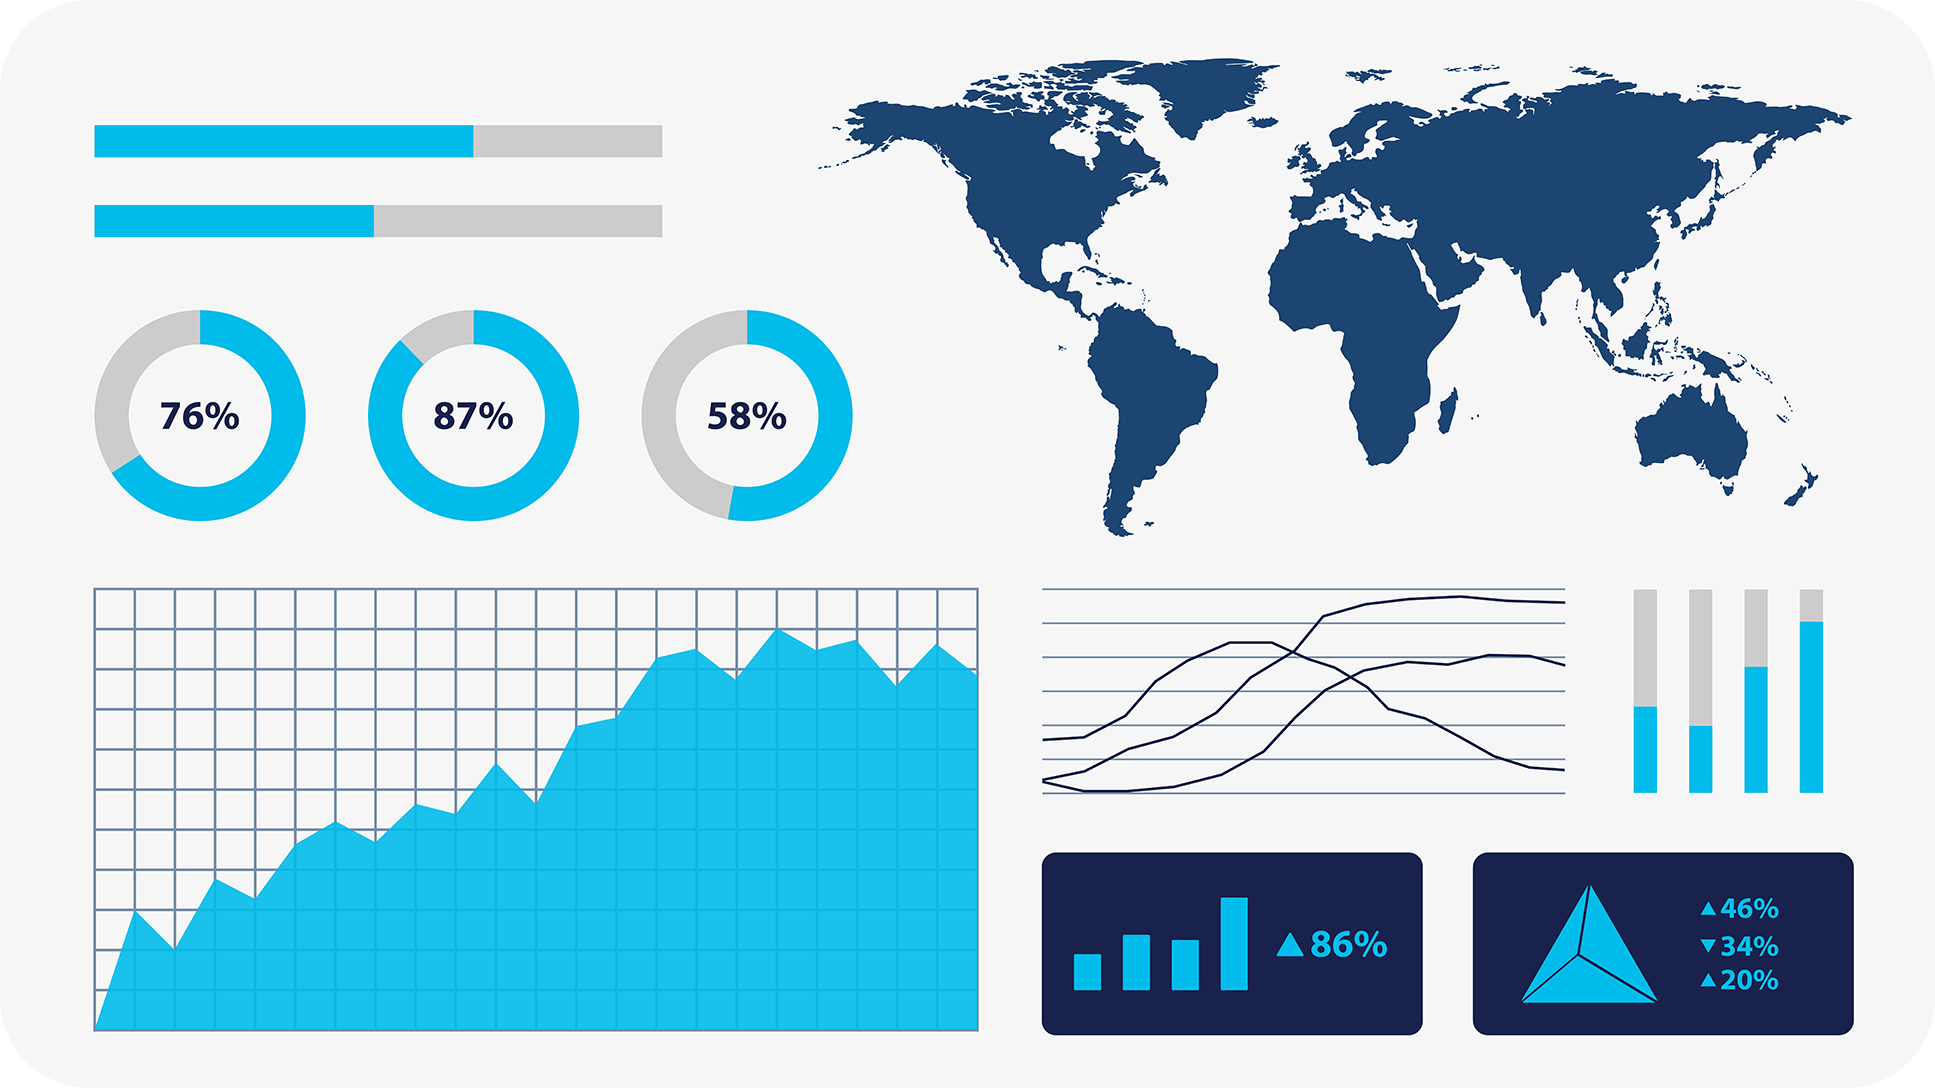
Example of business performance dashboards
It is essential to track the current performance of our business against the plan. The frequency of the report is daily, weekly, or monthly, depending on the audience. Our constant checking of growth and progress helps prioritize areas of impact and adjust strategic actions.
The challenges presented by the COVID-19 pandemic, together with environmental, economic, and geopolitical challenges, are changing the world tremendously, impacting customers and partners. How industries relate with one another and focus on market trends helps us understand how businesses are adjusting and aligning with the global economy. Responses within each industry on macro and geo economic terms influence our strategy, such as changing messaging per industry or focusing on and prioritizing markets based on their behavior and consumption patterns.
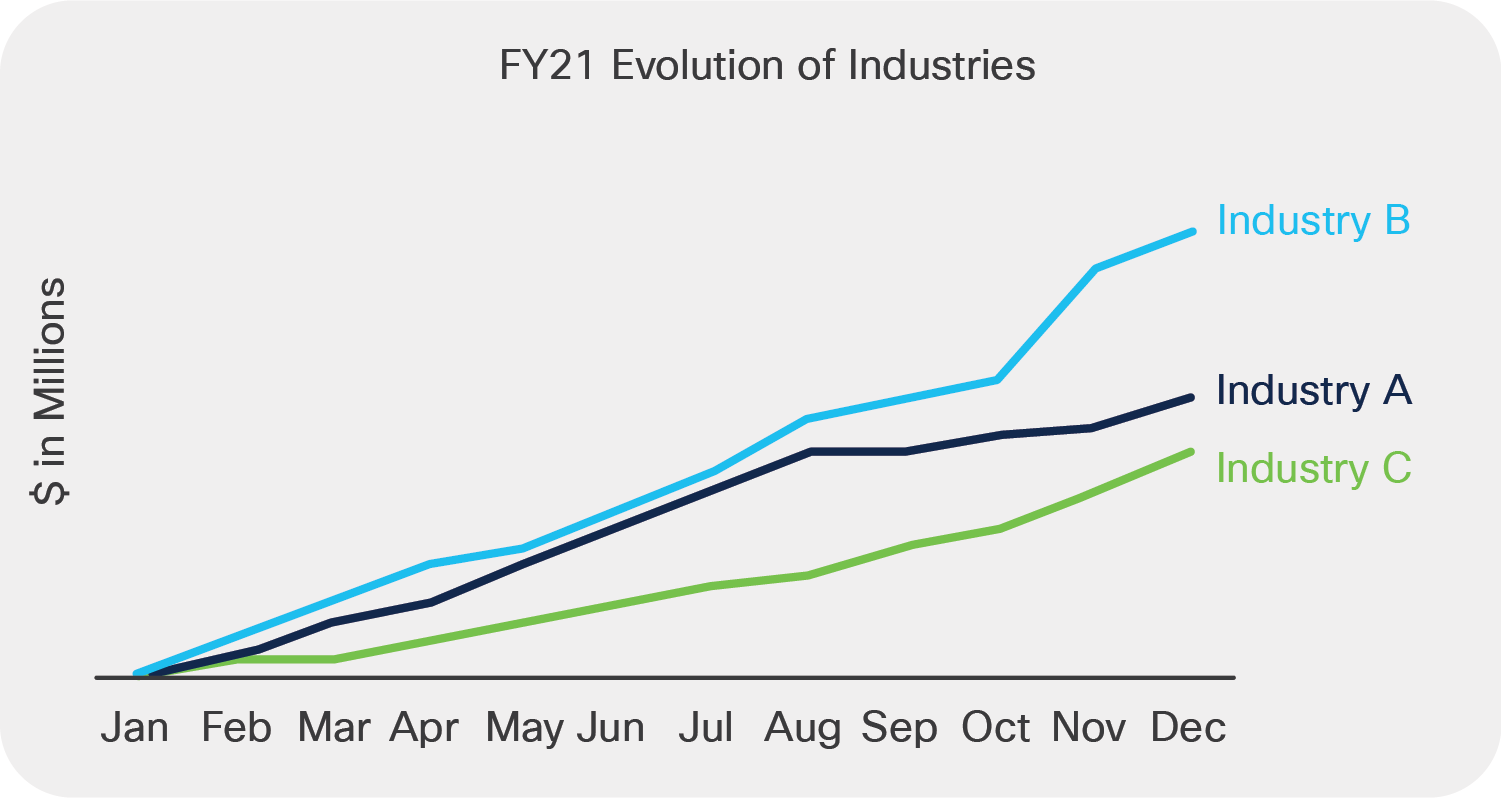
A comparison of industry specific trends
Our data-driven, automated industry report is designed to address and inform us of consumption and adoption patterns. It offers actionable insights, comprehensive data, and in-depth analysis per industry. Specifically, our deep-dive analysis shows us how customers reconfigure their operations and consume our service offers, ultimately providing us better insights into market trends and making us even more aware of our business.
3. Renewals product lifecycle management
Ensuring that a customer is satisfied and renewing is cheaper than losing a customer and having to secure a new one.
Therefore, we have placed a heavy focus on renewals, along with reports that rigorously monitor the business to understand renewal behavior, to align with our strategy of having the highest renewal conversion rate.
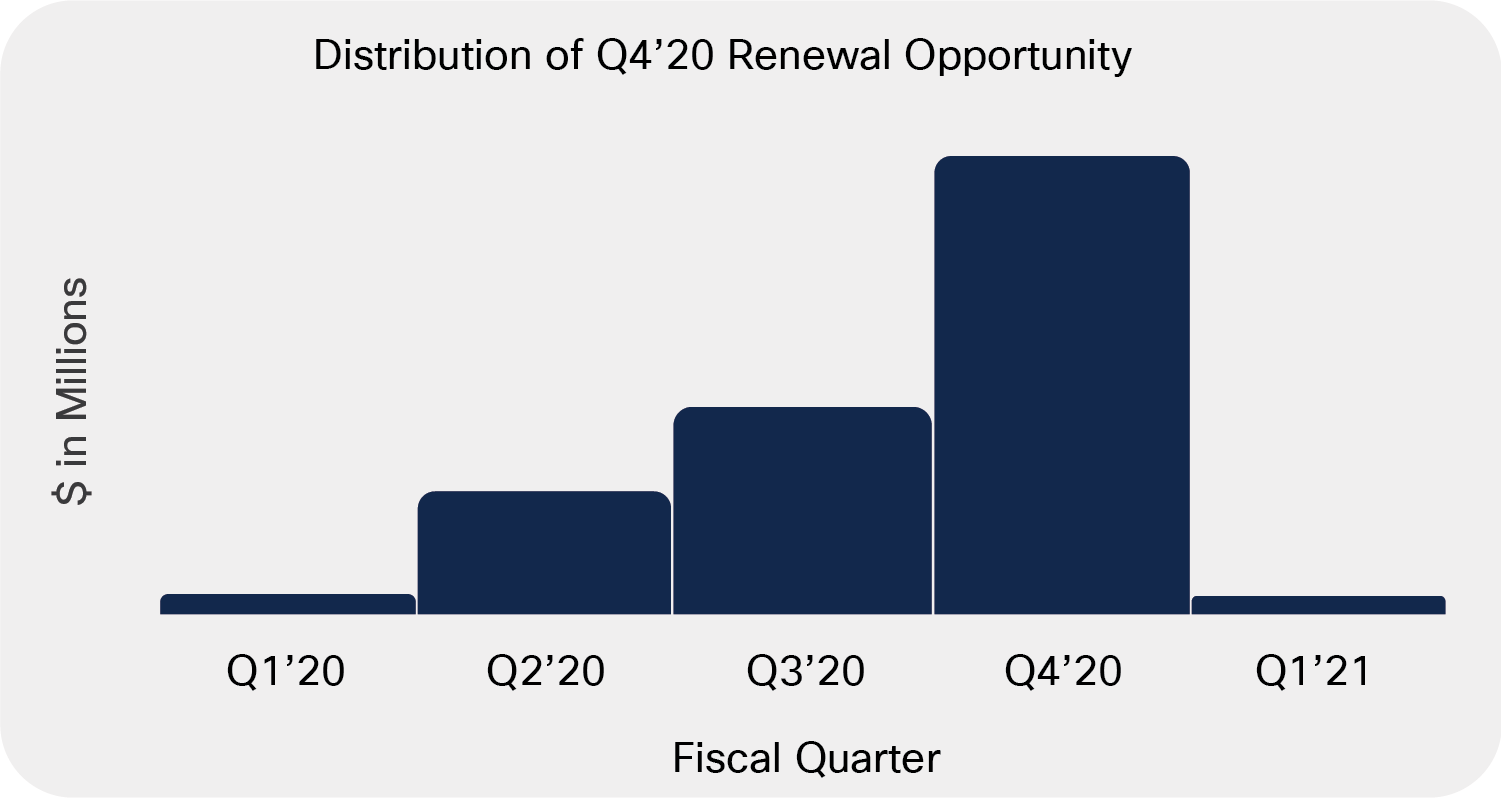
Insights in quarterly renewal opportunities
We execute statistical methods such as correlation analysis to establish a relationship between two or more renewal variables to better understand what drives renewals. Similarly, with a histogram we organize renewal data points into certain groups to observe the distribution of early, ontime, and late renewals. The figure on the right (arbitrary numbers used) is an example of how we can explore when a renewal opportunity with a contract end date in Q420 was pulled in.
Additionally, we leverage external teams such Cisco Lifecycle Advantage (LCA), a digital engagement program for partners that promotes adoption, simplifies renewals, and upsells to higher-value solutions. The job to be done by this report is to track the renewal performance against our finance plan, monitor LCA performance, provide opportunity insights to a wide range of accounts, and have key information to assess partner-branded vs. Cisco branded products, which provides information needed by renewal managers.
Before finalizing managerial decisions, we want to ensure that our decisions are well-informed and backed with data-driven models and insights. Therefore, before rolling out proposals globally, we launch a pilot for pricing or discount proposals for IoT services to put our assumptions, theories, and claims to the test. For instance, when we introduce new service offers to our customers and partners, we closely monitor the progress of KPIs to measure them against the plan and observe how they align to the set expectations. Rigorously tracking our marketing launches will help us decide whether a specific pilot is worth pursuing on a large scale and if the models we develop based on our theories, experience, and claims are accurate.
Artificial intelligence: The art of the possible
In the past several decades, it has become evident that companies that deploy data as a competitive business asset are leaders within their industry. As their business evolves, companies face multiple challenges that they need to overcome. With the growing amount of data volumes, new Artificial Intelligence (AI) and Machine Learning (ML), and big data capabilities, companies need to adapt and grow to remain relevant and continue to be leaders in their industry.
It is important to understand the differences between AI, ML, and deep learning.
● AI simulates human intelligence processes and associated cognitive functions, using machines running algorithms.
● ML relies upon teaching machines to make data-driven predictions based on data and learned experiences.
● Deep learning employs complex algorithms to enable high-level abstraction in data.
At Cisco we have a unique set of historical data that allows us to apply AI and ML techniques. We can leverage AI, ML, and deep learning to positively impact areas with high potential. Data-driven solutions should influence:
● Top-line revenue growth solutions, which lead to increased revenue or bookings.
● Bottom-line cost reduction solutions, which reduce Cisco's cost of doing business.
● Customer and workforce experience solutions, which enable an improved experience for Cisco's customers or workforce.
● Product or service innovation, in which a new product or service or improvement is added to an existing product or service.
● Solutions that benefit humanity, which create tangible benefits for humanity.
Furthermore, deploying AI technologies in your organization can help on multiple fronts, such as engaging better with customers, automating tasks, and gaining insights through data analytics. Given the wide range of AI’s applications, we can achieve the extraordinary within CX product management. The art of the possible can include:
● A service portfolio presented in a 3D hologram to sales and customers, and real-time adjustments of features and attributes based on customer requirements.
● A virtual live 3D portfolio that automatically modifies itself based on requests from the seller (voice recognition integrated with the portfolio and roadmap).
● Humanoid robots that can withstand extreme environments and work in hazardous areas 24 hours a day, or aerial and underwater robots for oil and gas use cases.
Artificial intelligence can help us improve our understanding of customers’ consumption patterns for IoT CX Services to optimize portfolio management and pricing and predict financial numbers. Using regression, clustering, and classification helps us to understand key parameters and relationships, leading to data-driven decisions and an understanding of customer behavior and purchasing patterns.
Additionally, we can improve operational efficiency to support the field during their sales motion. For sales enablement, machine learning algorithms will learn the sales profile of each seller-customer interaction, the performance of the seller in different product families and sub-technologies, and behavioral history. The algorithm will identify the necessary collateral that supports sales in their interactions with customers and propose the appropriate cost-efficient support services offer.
This will lead to improved customer and employee experiences. Natural language processing will improve internal cost optimization. A digital virtual assistant integrated into Cisco WebEx Teams™ would respond to repetitive questions from the field, freeing up time to work on high-value product management tasks and reducing the average handle time of customer field support interactions.
Putting in place a business analytics framework, with a clearly defined methodology, has allowed the Cisco CX Product Management IoT team to quickly translate the continuous stream of data into meaningful information that helped to create distinct industry profiles, reflecting the unique business drivers and priorities of each. These insights are driving targeted and industry-specific responses to continuously reassess and realign the Cisco IoT Services portfolio to the ever-evolving customer requirements and to help customers achieve their business goals in a cost-efficient and effective manner.
The examples described in this white paper underscore the importance of and need for product managers, in collaboration with data scientists, to identify trends in data and to leverage those insights to develop and execute a data-backed business strategy.
Ultimately, as businesses are rapidly evolving and becoming more digital, the amount of data available is increasing exponentially. This leads to more opportunities to use the plethora of data to improve existing services or create new ones in response to new or as-yet-unidentified customer requirements and business needs, but it also leads to challenges in finding ways to consume and translate this ever-growing data set. Applying a defined methodology and techniques to a greater scope will help more teams handle the data in a structured and consistent manner, translate the insights into data-informed decisions, and ultimately achieve hyperawareness.
Customers are continuously adjusting their support asks and requirements to address changes and their need to explore new markets. Staying at the forefront of adapting to these changes is vital. The continuous process of collecting the right data and analyzing it in a consistent manner will helps us adapt and grow in this digitally transforming world.