Cisco UCS C845A M8 Rack Server Getting Started GuideDense GPU Server
Available Languages
Bias-Free Language
The documentation set for this product strives to use bias-free language. For the purposes of this documentation set, bias-free is defined as language that does not imply discrimination based on age, disability, gender, racial identity, ethnic identity, sexual orientation, socioeconomic status, and intersectionality. Exceptions may be present in the documentation due to language that is hardcoded in the user interfaces of the product software, language used based on RFP documentation, or language that is used by a referenced third-party product. Learn more about how Cisco is using Inclusive Language.
Chapter 1 defines the guide scope, intended audience, operating-system example, and relationship to the official Cisco® product documentation.
This guide is intended to help customers bring a Cisco UCS® C845A M8 Rack Server system into operation with a practical, task-oriented workflow. The focus is on initial management access, Cisco Intersight® onboarding, host OS installation, driver and tooling enablement, networking adapter firmware and mode validation, benchmark execution, validation commands, and escalation-ready data collection.
This document is intentionally complementary to the published Cisco product documentation. It does not restate rack-and-stack procedures, detailed physical installation tasks, or evolving platform compatibility matrices that are already maintained in the official Cisco hardware installation guide, spec sheet, release notes, and related product documentation.
Cisco Intersight SaaS is used as the example workflow in this guide. Cisco Intersight Private Virtual Appliance (PVA) and Connected Virtual Appliance (CVA) are also valid deployment models, but their appliance-specific workflows are documented separately on Cisco Intersight.
The Cisco UCS C845A M8 Rack Server supports multiple operating systems. This guide uses Ubuntu 24.04 LTS as the worked example so that the workflow can show concrete commands and validation output. For other supported operating systems, use the same high-level sequence and substitute the operating-system-specific package, driver, and validation commands recommended for that release.
The purpose of this guide is to provide a concise, reproducible starting point for administrators who need to move from initial management access to a validated host software stack. The procedures are written as operational examples and should be adapted to the firmware, software, security, and change-control requirements of the deployment.
This document does not replace the official Cisco UCS C845A M8 Rack Server product documentation, release notes, software-download instructions, or compatibility information published on Cisco.com and software.cisco.com. Always use the latest Cisco documentation and the applicable vendor documentation when selecting supported operating systems, firmware releases, drivers, and update procedures.
2. Initial server setup and Cisco Intersight onboarding
Chapter 2 describes the management-network checks and Cisco Intersight SaaS claim workflow used to onboard a standalone Cisco UCS C845A M8 Rack Server.
Before starting the claim workflow, verify that the BMC is reachable on the management network and that DNS and NTP are configured and operational. This is required because the Device Connector uses the BMC management network to establish connectivity to Cisco Intersight.
To verify readiness, log in to the BMC web interface and navigate to Administration > Device Connector. In the expected pre-claim state, the page should show successful internet connectivity, the server should be marked as not yet claimed, and both a Device ID and Claim Code should be available for use during onboarding.

Device Connector pre-claim status
If the Device Connector cannot reach Cisco Intersight directly, configure proxy access before proceeding. In the BMC web interface, open Administration > Device Connector, select Settings, then open Proxy Configuration. Enable the proxy and enter the required proxy parameters for the environment. After saving the configuration, return to the Device Connector page and confirm that Cisco Intersight reachability is successful before continuing.

Device Connector proxy configuration
Once the Device Connector page shows that connectivity is established and the Device ID and Claim Code are available, claim the server in Cisco Intersight SaaS. In Cisco Intersight, navigate to System > Targets and click Claim a New Target. When prompted to select a target type, choose Cisco UCS Server (Standalone). Enter the Device ID and Claim Code from the BMC Device Connector page. Location and resource-group assignment are optional and can be applied according to the operational model in use.

Cisco Intersight Targets page
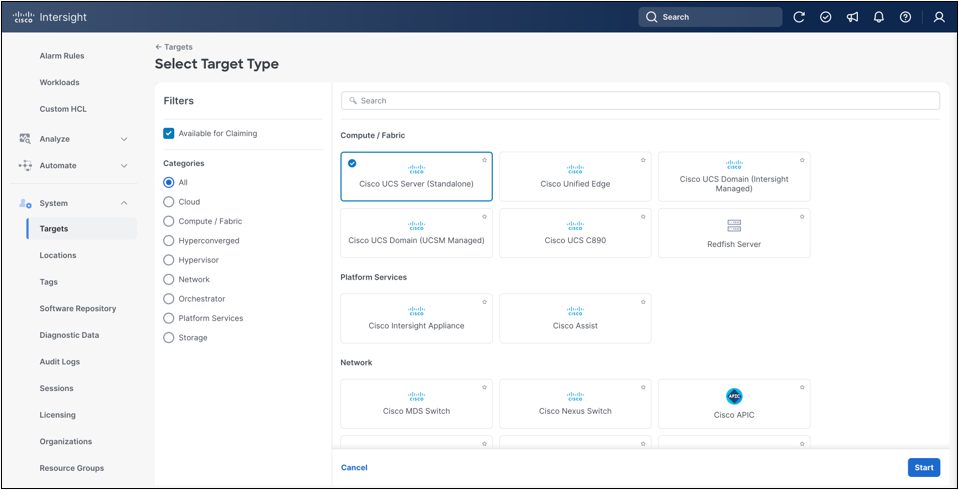
Standalone Cisco UCS server target type

Standalone Cisco UCS server claim form
After the claim is submitted, the system should appear in System > Targets in Cisco Intersight. Allow a few minutes for inventory synchronization to complete. Successful onboarding is confirmed when the system becomes visible under Operate > Servers in Cisco Intersight.
If the claimed target appears under Targets but the server does not appear under Operate > Servers after approximately 10 minutes, reboot the BMC and check the inventory again after a few additional minutes.

Newly claimed target in Intersight
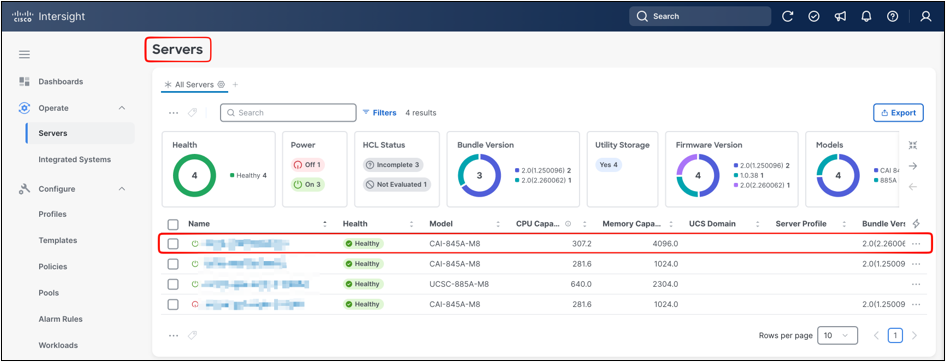
Server listed under Operate > Servers
2.1 Cisco Intersight operational features
Section 2.1 summarizes the Cisco Intersight workflows used after the Cisco UCS C845A M8 Rack Server has been claimed and appears under Operate > Servers. It intentionally does not restate the full Cisco Intersight Help Center content. Use the Cisco Intersight Help Center page for Managing UCS C845A M8 Server as the authoritative feature reference: https://intersight.com/help/saas/resources/managing_ucs_c845a_m8_server.
2.1.1 Review server inventory and operational state
After the server is claimed, navigate to Operate > Servers to review the centralized inventory view. The server table lists claimed systems and exposes operational columns such as health, model, CPU capacity, memory capacity, server profile association, and firmware bundle version. The summary widgets above the table provide a quick view of health, power state, HCL status, firmware distribution, profile status, and recent requests across the selected server scope.

Operate > Servers overview
Open the Cisco UCS C845A M8 Rack Server to review the General tab. This view combines server identity, health, power state, profile association, chassis visualization, core platform properties, active events, request status, and advisories. Use this page as the first operational checkpoint after onboarding. Confirm that the server is reachable, the platform model is correct, the expected hardware properties are visible, and any active alarms or requests are understood before applying profile or policy changes.
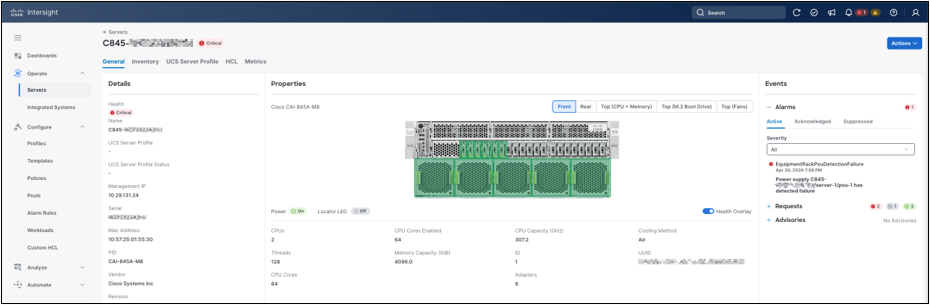
Server General view
The Inventory tab provides an endpoint-collected hardware tree for the server. Use this view to confirm that major platform inventory is visible from Cisco Intersight, including motherboard, boot, management controller, CPUs, memory, adapters, storage, GPUs, and other installed components where applicable. Selecting an inventory item displays the collected properties for that component, such as firmware version, model, vendor, serial number, UUID, and health state. This view is useful for operational inventory and cross-checking, while detailed host-side validation remains covered later with operating-system tools such as lspci, nvidia-smi, ethtool, mlxfwmanager, and Redfish inventory queries.
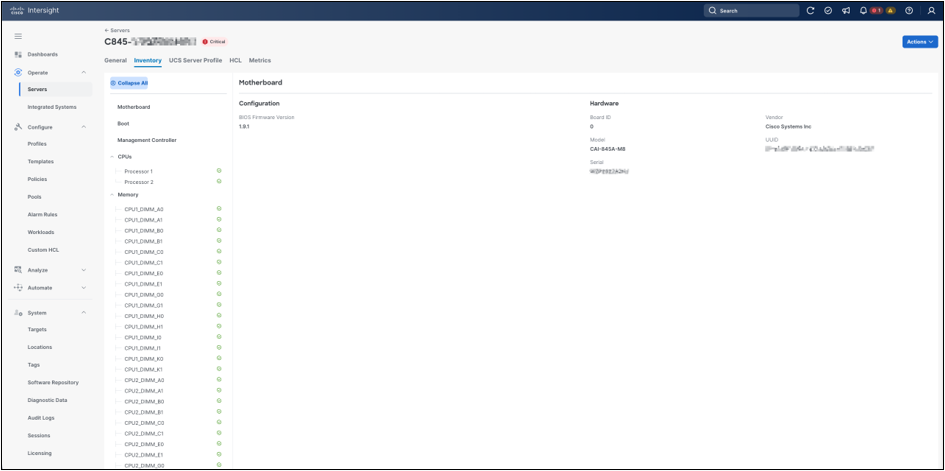
Server Inventory view
Before creating or assigning a profile, open the UCS Server Profile tab on the server details page. In the initial state, the server can show that no server profile is assigned. This confirms that the server is claimed and inventoried in Cisco Intersight, but is not yet managed by a server profile. Use this state as the transition point before creating a reusable profile template and deriving a server profile for the target server.

UCS Server Profile tab, unassigned
2.1.2 Create a UCS Server Profile Template
Cisco Intersight separates reusable configurations from server assignments. Policies define configuration intent, while a UCS Server Profile applies selected policies to a specific server. A UCS Server Profile Template lets the same baseline be reused to derive multiple server profiles with consistent settings. This guide uses the template-derived profile workflow rather than importing a profile from the endpoint.
To create a reusable baseline, navigate to Configure > Templates and select UCS Server Profile Templates. This view lists existing server profile templates and their synchronization status, usage, target platform, description, and last update time. If no template exists for the deployment, click Create UCS Server Profile Template to start the template workflow.
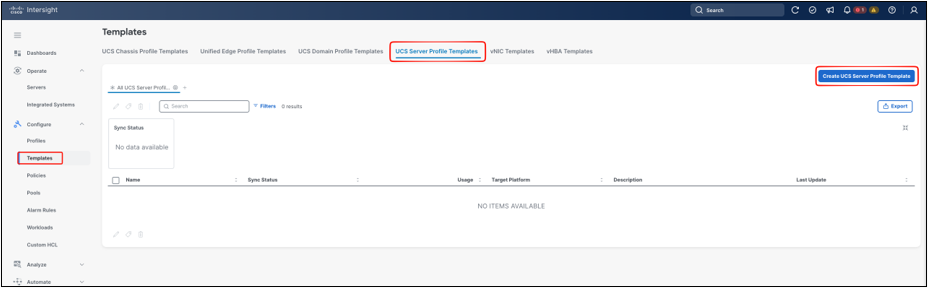
UCS Server Profile Templates view
In the General step, select the organization, enter a template name and description, and choose the target platform for the server profile template. For a standalone Cisco UCS C845A M8 Rack Server, select UCS Server (Standalone) and set Server Family to UCS C845A. The server family selection is important because it scopes the workflow to the policies and template behavior applicable to this platform.

Server profile template General step
In the Compute Configuration step, attach or create the compute-related policies that should become part of the reusable template. For the UCS C845A server family, the workflow exposes policy rows for BIOS, Firmware, Power, and Virtual Media. These policies are optional at template creation time, but they are the mechanism used to standardize platform behavior across derived server profiles. Add only the policies that are required for the deployment baseline.

Template Compute Configuration step
2.1.3 Attach policies to the template
To attach a policy, select the relevant policy row and click Select Policy. The same selection mechanism is used for the compute-policy rows shown in this step. If a suitable policy already exists, select it from the policy list. If a new baseline is required, create a new policy first, then return to the template workflow and attach it. This guide shows the BIOS policy selection as the example, but the same pattern applies to the Firmware, Power, and Virtual Media policy rows.
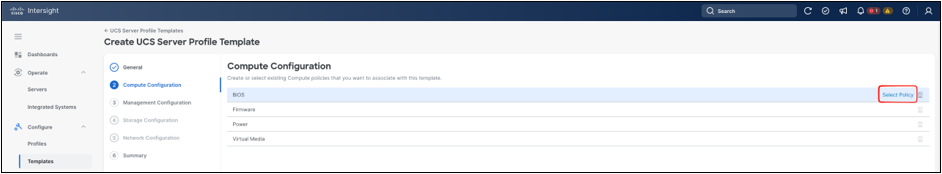
BIOS policy selection
The policy selection panel lists existing policies of the selected type. If the required policy already exists, select it and attach it to the template. If no appropriate policy exists, click Create Policy to define a new one from within the workflow. This allows administrators to build the required policy set while creating the template, or to pre-create policies under Configure > Policies and attach them later.

Create BIOS policy from selector
When creating a new BIOS policy from the template workflow, the General step defines the policy identity and scope. Enter the organization, policy name, optional tags, and description. For the C845A workflow, select Model Specific as the policy type and confirm that the model is UCS C845A. Model-specific BIOS policies should be used only with the matching server family, because unsupported model selections can cause configuration errors.

BIOS policy General step
The Policy Details step exposes model-specific BIOS settings grouped by category, such as I/O, memory, power/performance, processor, and security. In the getting-started workflow, keep the BIOS policy at platform-default values unless the deployment has a validated requirement to change a specific setting. These options control important server behavior, including memory configuration, NUMA exposure, I/O behavior, processor features, security settings, and performance-related behavior. Changes to BIOS settings are applied on the next host reboot, so BIOS policy deployment should be planned as a maintenance-window activity.
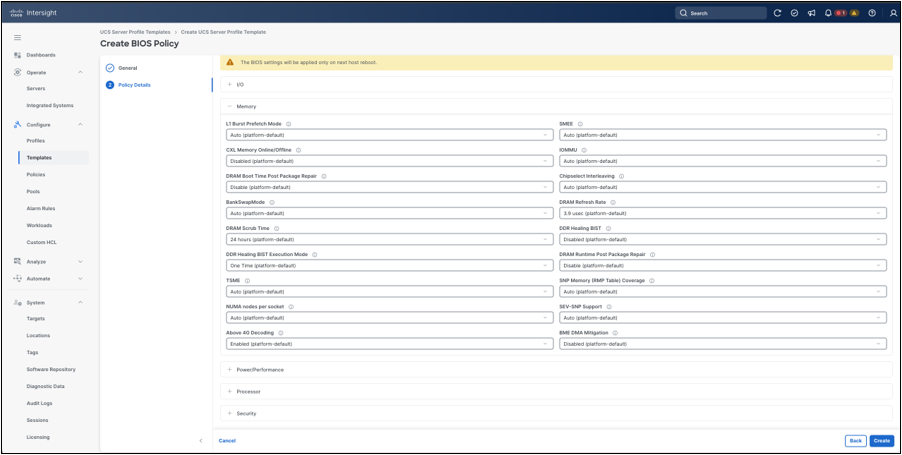
BIOS policy details
After the BIOS policy is created, Cisco Intersight returns to the template workflow and shows the policy attached to the BIOS row. This confirms that the policy has been created as a reusable object and is associated with the template. Use the same policy-selection pattern for other compute policy types when they are part of the deployment baseline.

BIOS policy attached to template
The Management Configuration step lists management policy types that can be attached to the template. These policies define how the server is managed and integrated with site services. Examples include certificate management, IPMI over LAN, LDAP, local users, management-network connectivity, NTP, Serial over LAN, SMTP, SSH, and Virtual KVM. Create or attach only the policies required by the operational model. Management policies can affect access paths, so review policies such as Network Connectivity, LDAP, local user, SSH, and certificate management carefully before deployment.
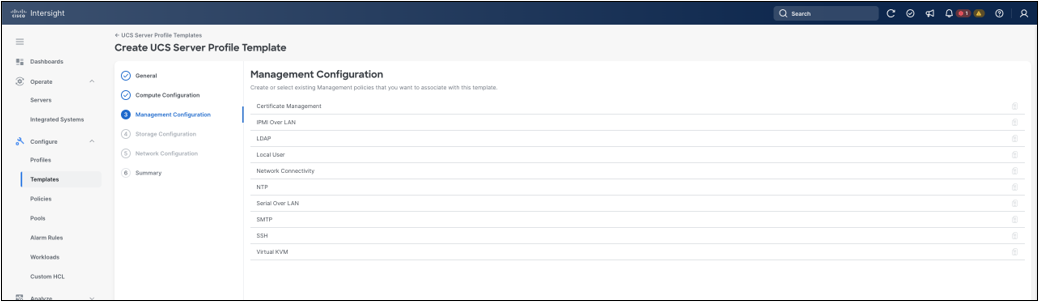
Template Management Configuration step
After the compute and management policy selections are complete, the workflow advances to Summary. In this example, the template targets UCS Server (Standalone) with UCS C845A as the server family, and the BIOS policy is attached under Compute Configuration. At the time of writing, May 2026, the Storage Configuration and Network Configuration steps are not available for the UCS C845A workflow shown here. Use the summary page to verify the template name, organization, target platform, server family, attached policies, and any reported errors or warnings before deriving profiles from the template.

Template Summary step
2.1.4 Derive the server profile
After reviewing the template summary, click Derive Profiles to create one or more server profiles from the template. In the General step of the derive workflow, Cisco Intersight shows the source template, target platform, organization, and server family. For the getting-started workflow, select Assign Now and choose the target Cisco UCS C845A M8 Rack Server from the server list. This creates a derived server profile and associates it with the selected server in the same workflow. Administrators can also derive profiles without immediate assignment, but assigning the profile during derivation provides a direct path from template creation to server deployment.
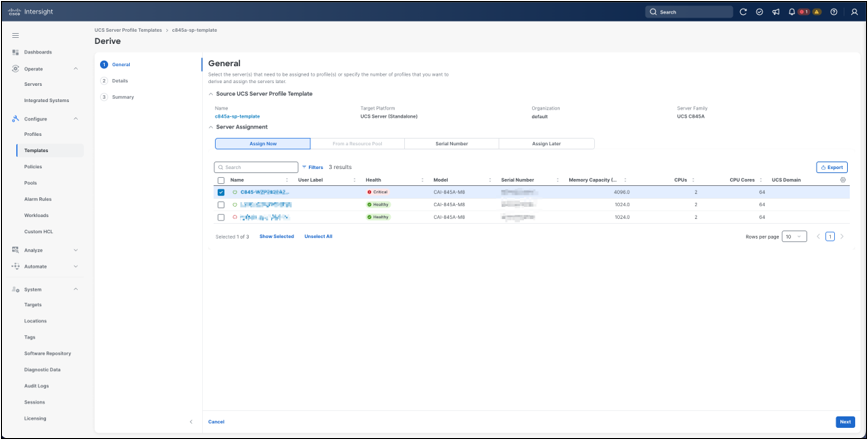
Derive profile server assignment
In the Details step, review the organization, target platform, server family, description, and tags inherited from the template workflow. Under Derive, provide the name for the derived UCS Server Profile and confirm the assigned server. Use a naming convention that makes the profile purpose, platform, and environment clear, especially when one template is used to derive profiles for multiple servers.

Derived profile details
In the Summary step, review the source template, target platform, server family, and the UCS Server Profile that will be derived. Confirm that the derived profile name, assigned server, organization, and attached policies are correct. The summary also shows the policy categories included in the template and any errors or warnings detected by the workflow. After the summary has been reviewed, click Derive to create the server profile from the template and associate it with the selected server.
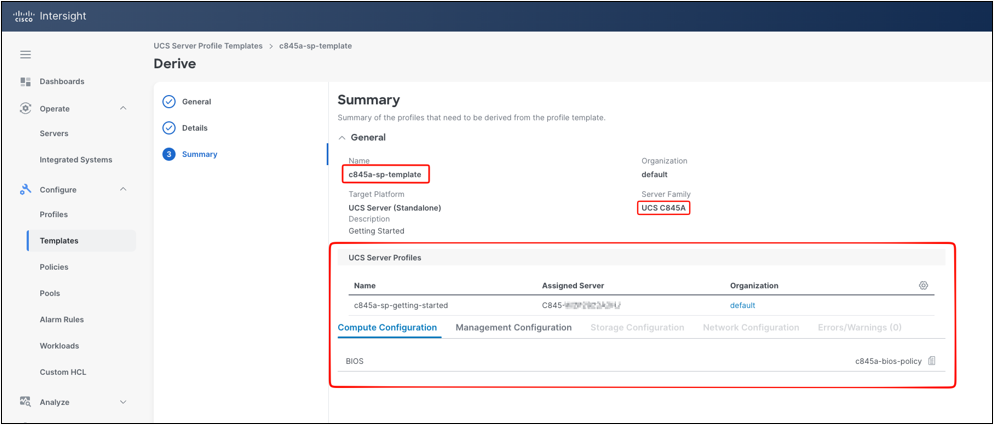
Derive Summary step
After Derive is submitted, Cisco Intersight creates a request to derive the server profile from the template. The request details show the target type, target profile name, source template, initiator, timing, and execution flow. At this point the server profile exists, but it still must be deployed before the selected policy configuration is applied to the assigned server.

Profile derivation request
After the derive request is completed, return to Operate > Servers to confirm that the derived server profile is associated with the target server. The Server Profile column shows the assigned profile name, while the Profile Status widget and status indicator show whether the profile has been deployed. A Not Deployed status means the profile has been associated with the server but its policy configuration has not yet been applied. This distinction is important: profile assignment identifies the intended configuration, while deployment applies that configuration to the server.
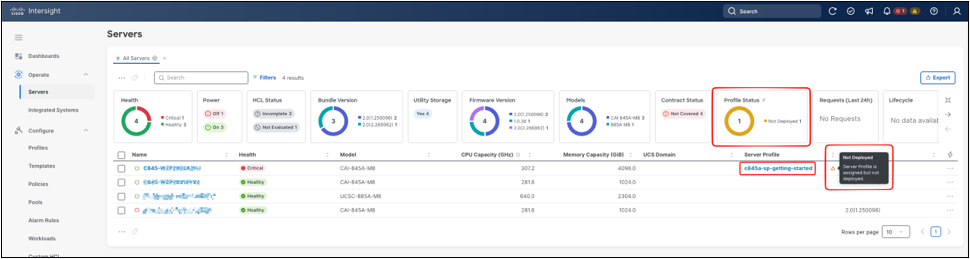
Assigned profile, not deployed
2.1.5 Deploy and activate the server profile
The derived profile is also visible under Configure > Profiles > UCS Server Profiles. From this view, confirm the profile Status, Target Platform, Source Template, Template Synch Status, Assigned Server, and Last Update time. When the profile is ready to be applied, open the profile context menu (ellipsis) and select Deploy.

Deploy action for server profile
Before deploying the server profile, Cisco Intersight displays a confirmation dialog. If the server is powered on, deployment or activation can be disruptive. Review the warning carefully before proceeding. The “Reboot immediately to activate” option controls whether Cisco Intersight should reboot the server during the deployment workflow so that reboot-required settings take effect immediately. BIOS policy changes are a common example of settings that require a reboot before they become active. Select this option only when the server is in an approved maintenance window.
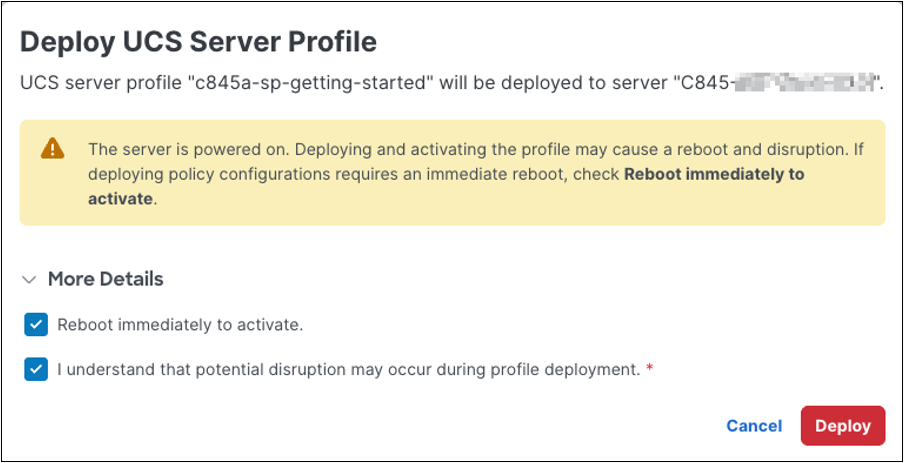
Deploy UCS Server Profile warning for powered on servers
After deployment starts, Cisco Intersight opens a request-details panel for the Deploy Server Profile workflow. Review the request status and execution flow to confirm that Intersight prepared the deployment, validated user access to the profile and attached policies, validated the BIOS policy, and deployed the BIOS policy to the server. A Success status on this request means that the deployment workflow completed successfully. If the profile includes settings that require activation, such as BIOS settings, the profile can still appear as Activating or Not Activated until the activation workflow and any required reboot are completed.

Deploy Server Profile workflow request
After the deployment request completes, Cisco Intersight may start a separate Server Profile Activation workflow. Activation applies configuration changes that require the server state to change. If the profile includes reboot-required settings, such as BIOS policy settings, and “Reboot immediately to activate” was selected, Cisco Intersight reboots the server and waits for the system to return to the expected power state. During this phase, monitor progress from the Intersight request panel. The virtual KVM can also be used to observe the reboot and POST sequence. On dense GPU servers with large memory configurations, POST can take several minutes, so allow enough time before treating the activation workflow as stalled.

Server Profile Activation in progress
When activation completes, the Server Profile Activation request reports Success. The execution flow shows that Cisco Intersight rebooted the server and waited for BIOS POST to complete successfully. This confirms that the reboot-required profile configuration was activated, not only deployed. The activation duration can vary by hardware configuration.

Server Profile Activation completed
After activation completes, return to Operate > Servers and verify the final profile state. The Profile Status widget should report OK, and the server row should show the assigned UCS Server Profile with a healthy status indicator. The Requests (Last 24h) widget can also be used to confirm that the related derive, deploy, and activation workflows have completed.

Profile OK after activation
At this point, the reusable template has been created, a server profile has been derived and assigned to the Cisco UCS C845A M8 Rack Server, and the profile has been deployed and activated. This completes the basic Cisco Intersight server profile workflow for the getting-started path.
2.1.6 Metrics
After deployment, use the server profile state to detect a pending or inconsistent configuration. If a policy attached to a deployed profile changes, the profile can show not-yet-deployed changes until the updated configuration is deployed. If settings are changed directly on the endpoint outside the profile workflow, Intersight can report inconsistency or drift, which should be reviewed before additional changes are made.
Cisco Intersight also provides time-series metrics for claimed servers. For the Cisco UCS C845A M8 Rack Server, metrics can be reviewed directly from the server details page or explored in the full Metrics Explorer workflow. Use the Cisco Intersight Help Center pages for Managing Cisco UCS C845A M8 Server and Metrics Explorer for the complete feature reference. This guide focuses on a practical getting-started path for reading C845A platform metrics after onboarding and profile deployment.
Open the server from Operate > Servers and select the Metrics tab. The server metrics view lists available environmental and error metrics for the selected time interval. The table includes a sparkline for each metric and summary columns such as Average, Minimum, Maximum, Sum, and Last. Not every statistic applies to every metric. For example, an energy metric is typically read as a summed value over the selected interval, while a temperature or power metric is usually read with average, minimum, and maximum values.
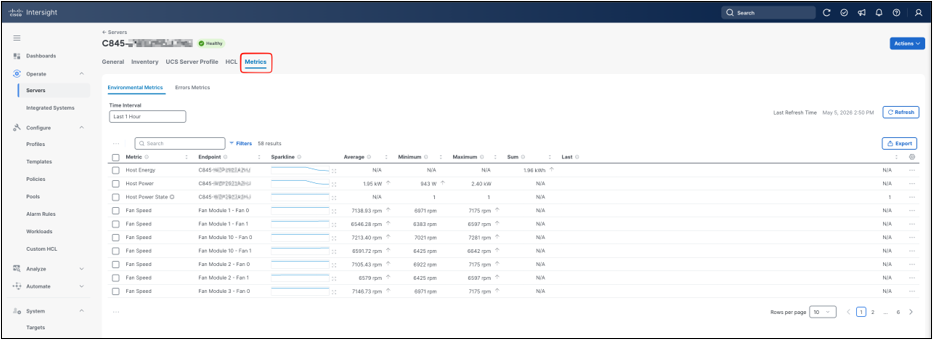
Server metrics tab
Use the metric search field or Filters panel to narrow the table to the metrics you want to inspect. GPU-related entries can include PCIe link width, PCIe link generation, PCIe traffic counters, power, temperature, utilization, and memory-clock metrics, depending on platform support, software state, and installed drivers. If an expected GPU metric is not visible immediately after software installation or reboot, allow time for metric collection and confirm that the appropriate host GPU driver stack is installed.
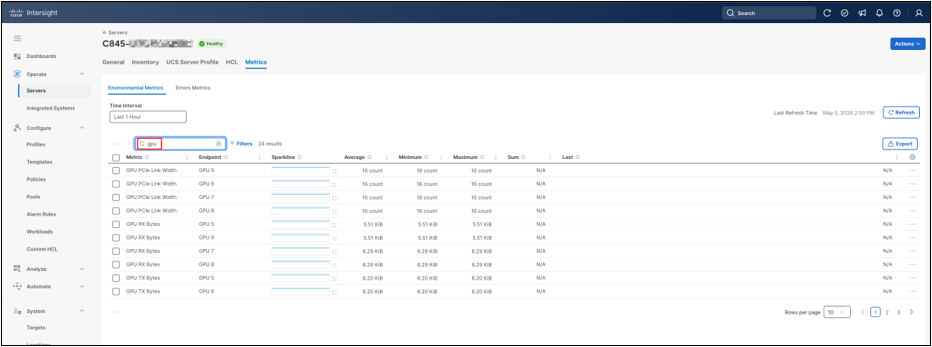
GPU metrics filter
For a short validation window, power and temperature metrics are useful first checks. Host power shows the system-level draw for the server, output power shows per-PSU contribution, and temperature metrics show the thermal response during workload activity. The Sparkline gives a quick trend preview, and the Average, Minimum, and Maximum columns help quantify the selected window. A zero or near-zero value for a specific PSU means that the PSU did not contribute output during the selected interval; verify the expected power-supply population, cabling, redundancy mode, and related alarms before treating the value as abnormal.

Power and temperature metrics
To inspect a metric in more detail, open the row menu for the metric and select View Metrics.
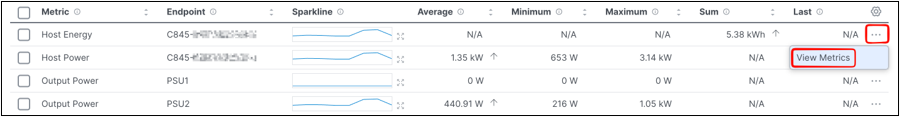
View Metrics action
Clicking View Metrics opens a chart detailing the selected metric. Use Time Interval to choose the observation window, and use Granularity to control how data points are aggregated. Shorter granularity shows greater detail; longer granularity smooths the chart and is useful for longer time windows. In this example, the load interval is visible as a rise in host energy over the selected four-hour window.

View of metric details
Click View in Explorer to open the same metric in Analyze > Explorer. Metrics Explorer exposes the metric definition, filters, grouping options, Chart Type, Time Interval, Granularity, Raw Data, Distinct Endpoints, Query Code, and Export options. Use this view when you need to compare metrics, adjust grouping, export data, or save an exploration for reuse.

Metric opened in Metrics Explorer
Metrics Explorer can overlay multiple metrics in the same visualization. This is useful for correlation, such as comparing host energy with per-PSU output energy over the same time interval. When reading combined charts, verify that the units and aggregation method are appropriate for the comparison. Energy values accumulate over the interval, while power values represent draw during each aggregation bucket.
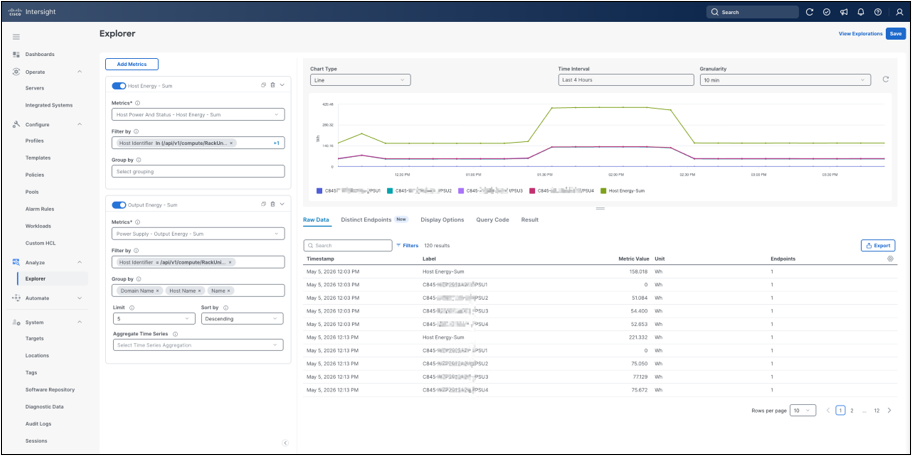
Correlated energy metrics
For distribution-style questions, change the chart type. A pie chart can summarize how output energy is distributed across PSU endpoints during the selected interval. This view is useful for quickly identifying whether power delivery appears balanced across the expected contributing PSUs.

PSU output energy pie chart
Intersight metrics complement, but do not replace, host-side validation. Use the Intersight views for operational monitoring, trend analysis, and quick visual correlation. Use the command-line validation sections later in this guide to confirm the installed operating-system packages, GPU software stack, networking drivers, firmware versions, topology, and benchmark behavior from the host perspective.
3. Out-of-band management validation
Chapter 3 shows how to validate out-of-band management access and use the BMC Redfish API for read-only platform checks that complement Cisco Intersight and host-side validation.
The Cisco UCS C845A M8 Rack Server BMC exposes Redfish services that can be used to verify management-controller status, system identity, secure-boot state, hardware inventory, and firmware inventory. These checks are useful early in the bring-up process because they provide an out-of-band view of the server that does not depend on the host operating system. They can also be repeated later to compare BMC inventory with Cisco Intersight and host-side validation output.
The examples in this section use only read-only GET requests after creating a temporary authenticated Redfish session. They do not reset the server, change BIOS settings, update firmware, modify boot order, or perform any other state-changing operation. Replace <bmc-ip> and <bmc-user> with values from your environment, and enter the BMC password only when prompted.
Install curl and jq on the management workstation or Linux client from which you will query the BMC. The client must have IP reachability to the BMC management network. If the BMC management network is isolated from the host operating-system network, run these commands from an appropriate management workstation or jump host:
| sudo apt-get install -y curl jq |
Create a temporary Redfish session:
| export BMC_HOST="https://<bmc-ip>" export BMC_USER="<bmc-user>" read -rsp "BMC password: " BMC_PASSWORD; echo
SESSION_BODY=$(mktemp) SESSION_HEADERS=$(mktemp)
curl -sk --connect-timeout 10 --max-time 30 \ -D "$SESSION_HEADERS" -o "$SESSION_BODY" \ -H "Content-Type: application/json" \ -X POST "$BMC_HOST/redfish/v1/SessionService/Sessions" \ -d "{\"UserName\":\"$BMC_USER\",\"Password\":\"$BMC_PASSWORD\"}"
export REDFISH_TOKEN=$(awk -F': ' 'tolower($1)=="x-auth-token"{gsub("\r","",$2); print $2}' "$SESSION_HEADERS") export REDFISH_SESSION=$(awk -F': ' 'tolower($1)=="location"{gsub("\r","",$2); print $2}' "$SESSION_HEADERS") |
The session creation request returns an authentication token in the X-Auth-Token response header and a session URI in the Location response header. The token is used for subsequent requests. The session URI is used later to delete the session. Do not place the BMC password directly on the command line, because command-line arguments can be visible in shell history or process listings.
Define a small helper for read-only Redfish GET requests:
| redfish_get() { curl -sk --connect-timeout 10 --max-time 30 \ -H "X-Auth-Token: $REDFISH_TOKEN" "$BMC_HOST$1" } |
Start with the Redfish service root:
| redfish_get /redfish/v1/ | jq -r ' "RedfishVersion: \(.RedfishVersion)", "Product: \(.Product)", "Vendor: \(.Vendor)", "CiscoProductName: \(.Oem.Cisco.ProductName)" ' |
Example output:
| RedfishVersion: 1.17.0 Product: CAI-845A-M8 Vendor: Cisco Systems Inc CiscoProductName: UCS C845A M8 |
This output confirms that the BMC Redfish service is reachable and identifies the platform exposed by the service root. RedfishVersion identifies the Redfish schema level implemented by the BMC. Product, Vendor, and CiscoProductName confirm that the endpoint is the expected Cisco UCS C845A M8 system.
Check the host system resource:
| redfish_get /redfish/v1/Systems/system | jq -r ' "Model: \(.Model)", "Manufacturer: \(.Manufacturer)", "PowerState: \(.PowerState)", "BiosVersion: \(.BiosVersion)", "Status: Health \(.Status.Health), State \(.Status.State)" ' |
Example output:
| Model: CAI-845A-M8 Manufacturer: Cisco Systems Inc PowerState: On BiosVersion: 1.9.1 Status: Health OK, State Enabled |
Read this as the out-of-band system baseline. PowerState shows the host power state from the BMC perspective. BiosVersion is the installed BIOS version reported by platform firmware inventory. Status.Health and Status.State should normally be OK and Enabled before proceeding with driver installation, mode changes, or performance validation.
Check the secure-boot state from the dedicated secure-boot resource:
| redfish_get /redfish/v1/Systems/system/SecureBoot | jq -r ' "SecureBootEnable: \(.SecureBootEnable)" ' |
Example output:
| SecureBootEnable: false |
SecureBootEnable reports whether secure boot is enabled for the system. This matters because host driver installation and DKMS module loading behavior can differ when secure boot is enabled. The procedures in this guide assume that the module-signing and operating-system policy requirements for the target environment have been satisfied before third-party kernel modules are installed.
Check the BMC manager resource:
| redfish_get /redfish/v1/Managers/bmc | jq -r ' "Name: \(.Name)", "Model: \(.Model)", "FirmwareVersion: \(.FirmwareVersion)", "PowerState: \(.PowerState)", "Status: Health \(.Status.Health), State \(.Status.State)" ' |
Example output:
| Name: Cisco Baseboard Management Controller Model: CAI-845A-M8 FirmwareVersion: 2.0(...) PowerState: On Status: Health OK, State Enabled |
This check confirms the BMC firmware baseline and health. The BMC firmware version is independent of the host OS and should be recorded with other firmware versions when building an escalation or reproducibility package.
Inventory network adapters from the chassis resource:
| redfish_get /redfish/v1/Chassis/chassis/NetworkAdapters | \ jq -r '.Members[]."@odata.id"' | \ while read adapter_uri; do redfish_get "$adapter_uri" | jq -r '[.Id, .Name, .Model, .Status.Health] | @tsv' done |
Example output, abridged:
| FHHL_9 NVIDIA OEM MCX715105AS-WEAT CX-7 1x400GbE QSFP112 PCIe Gen5 x16 VPI NIC CAI-P-N7S400GFO OK FHHL_10 NVIDIA OEM MCX755106AS-HEAT 2x200GbE QSFP112 Gen5x16 PCIe VPI NIC CAI-P-N7D200GFO OK FHHL_11 NVIDIA OEM MCX715105AS-WEAT CX-7 1x400GbE QSFP112 PCIe Gen5 x16 VPI NIC CAI-P-N7S400GFO OK OCP_NIC Cisco X710T2LG 2x10 GbE RJ45 OCP 3.0 NIC CAI-O-ID10GC OK |
The adapter inventory provides an out-of-band view of the installed NICs. The Id column identifies the slot or logical adapter entry. Name describes the adapter class and port configuration. Model gives the Cisco platform part identifier. Status.Health should be OK for adapters that are expected to participate in host networking or RDMA validation. This inventory is especially useful for confirming that the BMC sees the same adapter population that was later validated from the host with lspci, ethtool, mlxfwmanager, and mlxconfig.
Review selected firmware inventory entries:
| redfish_get /redfish/v1/UpdateService/FirmwareInventory | \ jq -r '.Members[]."@odata.id"' | \ while read firmware_uri; do redfish_get "$firmware_uri" | \ jq -r 'select((.Id | test("bmc|bios|CAI-P-N7|CAI-GPU-H200|OCP_NIC"; "i"))) | [.Id, .Version, .Updateable] | @tsv' done |
Example output, abridged:
| bmc 2.0(...) true bios 1.9.1 true CAI-P-N7S400GFO-slot-FHHL_9 28.47.1026 true CAI-P-N7D200GFO-slot-FHHL_10 28.47.1026 true CAI-GPU-H200-NVL-slot-GPU_5 96.00.D9.00.0E-1010.0230.00.02 true CAI-O-ID10GC-slot-OCP_NIC 0x8000FBE7-1.837.0-9.54 true |
Use firmware inventory to cross-check major component versions from the BMC perspective. The Id column identifies the component inventory entry, Version reports the installed firmware version, and Updateable indicates whether Redfish marks the component as update-capable. This is inventory information only; do not infer that a firmware update is required simply because Updateable is true.
When the checks are complete, delete the temporary Redfish session and clear local shell variables:
| curl -sk --connect-timeout 10 --max-time 30 \ -X DELETE -H "X-Auth-Token: $REDFISH_TOKEN" "$BMC_HOST$REDFISH_SESSION"
unset BMC_PASSWORD REDFISH_TOKEN REDFISH_SESSION BMC_HOST BMC_USER rm -f "$SESSION_BODY" "$SESSION_HEADERS" |
Deleting the session is part of normal credential hygiene. If a script or terminal session exits unexpectedly, log in to the BMC web interface or use the BMC session-management tools available in your environment to confirm that unused sessions are closed.
4. Pre-OS firmware and platform baseline
Chapter 4 establishes the pre-OS firmware baseline and shows how to use Cisco Intersight to stage and monitor the firmware update workflow.
Before host OS deployment, establish the intended firmware baseline for the system. Two management paths are available for firmware updates after the required firmware content has been downloaded, including the Cisco Server Configuration Utility (SCU) and the BMC firmware image: the update can be performed directly from the BMC, or it can be performed through Cisco Intersight.
Cisco publishes platform software for Cisco UCS C845A M8 Rack Server through Cisco Software Central. The relevant software categories include Unified Computing System (UCS) Diagnostics, Unified Computing System (UCS) Drivers, Unified Computing System (UCS) Server Configuration Utility, and Unified Computing System (UCS) Server Firmware. Use the official Cisco Software Central page for the product to obtain the SCU and firmware images used by the workflows in this guide: https://software.cisco.com .
Cisco software downloads can require a Cisco.com account and the appropriate entitlement for restricted images.
Before installing the host operating system, also decide how the platform should expose CPU, memory, PCIe, and power-management behavior to the operating system. These settings influence how schedulers, GPU runtimes, RDMA libraries, and collective communication frameworks understand locality and latency.
NUMA options define how CPU cores, memory, and nearby PCIe devices are grouped and reported to the operating system. More granular NUMA exposure can help software place threads and memory closer to the GPUs or NICs that use them, while less granular exposure can simplify scheduling. Select the NUMA mode that matches the deployment's workload model, operating-system policy, and application scheduler strategy, then verify the result from the host after installation.
IOMMU- and DMA-related options define how PCIe devices access host memory. For GPUs and high-speed NICs, this affects RDMA, GPU memory registration, and GPUDirect RDMA behavior. Translated IOMMU domains can provide stronger isolation, while passthrough-style operations can reduce translation overhead and are commonly evaluated for high-throughput GPU and RDMA paths. Choose the policy required by the deployment's security, driver, and performance requirements, and verify it from the running operating system.
Power-management options affect determinism. AI workloads often run for long periods and can be sensitive to latency variation, frequency transitions, and deep idle states. Review the available platform power and determinism options and select a profile appropriate for the deployment's balance of performance consistency and power efficiency.
In the BMC web interface, the local firmware-management path is available under Administration > Firmware Management. Refer to the official product documentation for the BMC web UI workflow. The example in this guide uses Cisco Intersight as the primary firmware update method.
Before starting the firmware update workflow in Cisco Intersight, place the required update content on a network location that is reachable from the server BMC. The required files include the Cisco Server Configuration Utility (SCU) image and the target BMC firmware image. The remote repository can be hosted on HTTPS, CIFS, or NFS. Ensure that the selected repository is reachable from the BMC management network before starting the upgrade procedure.
In Cisco Intersight, navigate to Operate > Servers. For the target system, open the context menu (...) and select Upgrade Firmware.

Upgrade Firmware action
In the Upgrade Firmware workflow, first select the server to be upgraded from the list of eligible systems. The workflow then proceeds to the firmware version step.
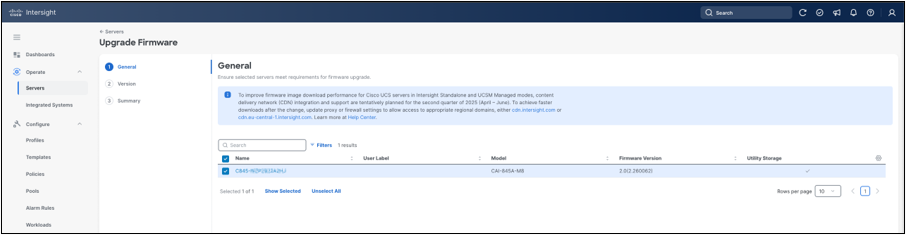
Firmware upgrade server selection
In the Version step, add the firmware source by selecting Add Firmware Link.

Add firmware link
When adding a firmware link in Cisco Intersight, specify the remote repository that hosts the firmware content. Select the appropriate transfer protocol and provide the file location for the firmware source. For an HTTPS-based repository, provide a File Location and, if required, a Username and a Password. Cisco Intersight also supports CIFS and NFS repository types, which use protocol-specific settings appropriate to the selected repository type.

HTTPS firmware repository
After the repository location is provided, Cisco Intersight populates the firmware image details automatically, based on the file specified in the previous step. Review the detected metadata and adjust it only if needed. The populated fields include Name, Version, and Supported Models. An optional Description field can also be provided before saving the firmware image entry.

Firmware image metadata
After the firmware link has been added, select the firmware image from the list of available entries in the Version step of the workflow, then click Next to continue.
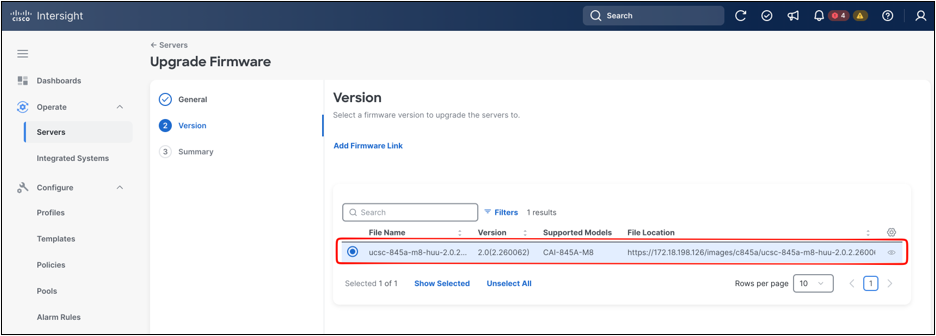
Firmware image selection
In the Summary step, review the selected firmware version and confirm the list of servers to be upgraded. Once the configuration has been verified, click Upgrade to start the firmware update.
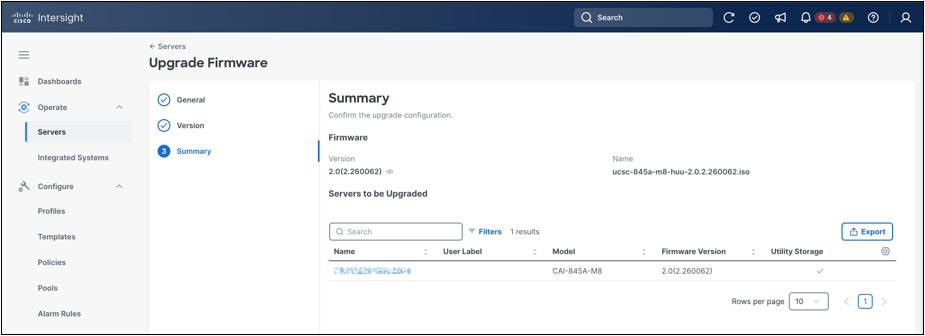
Firmware upgrade summary
After the upgrade request is submitted, Cisco Intersight prompts for a reboot. At this stage, you can choose to reboot the server immediately to begin the firmware installation right away, or leave the server running and allow the firmware to be installed at the next boot.
If the Reboot Immediately option is selected, the firmware update starts immediately and Cisco Intersight creates a new request to track the operation. Use the Requests view in Cisco Intersight to monitor the progress of the firmware update. This view shows the request status, execution type, target system, start time, duration, and progress of the running job.
Open the firmware-upgrade request to monitor the execution flow in detail. The request view provides step-by-step status for the operation, including overall progress and the individual execution stages completed so far. It also shows the target system, request identifier, initiator, source type, and start time.

Firmware update confirmation banner
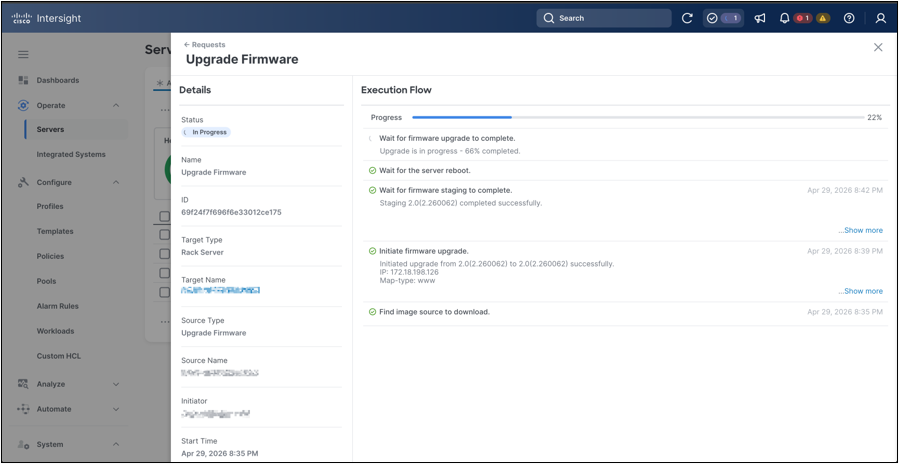
Firmware workflow request details
5. Host operating system installation
Chapter 5 installs Ubuntu by using the Cisco Intersight operating system installation workflow and confirms that the host reaches the login prompt.
The Cisco UCS C845A M8 Rack Server supports multiple operating systems, and the authoritative support matrix is maintained in the official Cisco documentation. This guide uses Ubuntu 24.04 LTS as the primary operating system. The command examples in this section are Ubuntu-based, but the overall sequence, decision points, and operational approach are generally applicable across supported operating systems.
Multiple installation paths are available for Cisco UCS C845A M8 Rack Server OS deployment, including Cisco Intersight’s operating-system installation, vKVM-based installation through the BMC, and PXE boot. This guide uses Cisco Intersight’s OS installation workflow as the primary path and treats the other methods as alternatives for environments that require a different provisioning model.
The workflow given below describes a Cisco Intersight-driven Ubuntu 24.04 LTS installation. In this workflow, the request completes from end to end, the KVM console shows Ubuntu subiquity and curtin autoinstall activity, and the system reaches the Ubuntu login prompt with the configured hostname. No manual installer interaction is required after the workflow is started.
To start the workflow, navigate to Operate > Servers in Cisco Intersight. Open the context menu (...) for the target Cisco UCS C845A M8 Rack Server and select Install Operating System.

Install Operating System action
In the General step, confirm that the selected target server is the intended Cisco UCS C845A M8 system, then click Next.
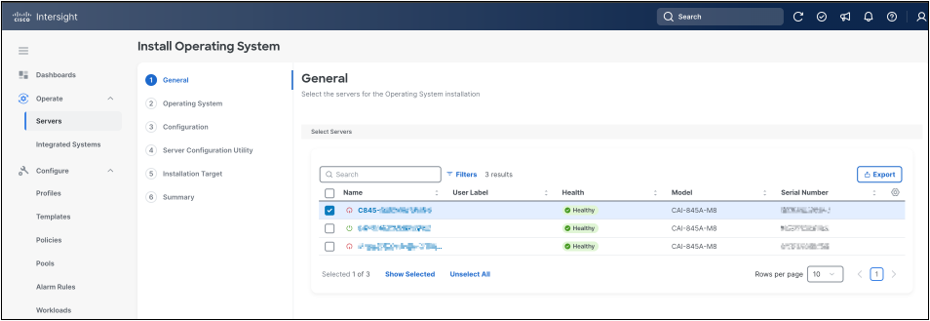
OS install server selection
In the Operating System step, select the Ubuntu 24.04 LTS image from the available repository entries, then click Next.

Ubuntu image selection
In the Configuration step, select the configuration source. Cisco Intersight presents three modes: Cisco, Custom, and Embedded. This guide uses Cisco mode. In this mode, Cisco Intersight applies a Cisco-managed operating system configuration workflow for supported operating systems. Custom follows a similar model but allows a user-provided configuration file. Embedded boots the image with the expectation that the required configuration is already included in the image.
When Cisco mode is selected, the workflow exposes operating system network configuration fields. In the Ubuntu example, static IPv4 addressing was used. Provide the IP address, netmask, gateway, preferred DNS server, optional alternate DNS server, hostname, target network device, and password, then click Next. Cisco Intersight assigns the management address to the first interface by default. If a specific host interface must be used, specify the device name or MAC address in the Network Device field.

OS network configuration
In the Server Configuration Utility step, select the SCU image from the available repository entries, then click Next. The SCU image list is filtered based on the operating system image selected earlier in the workflow.

SCU image selection
In the Installation Target step, select the M.2 boot device. For this workflow, the target disk type is Local Disk. After selecting the target, click Next.
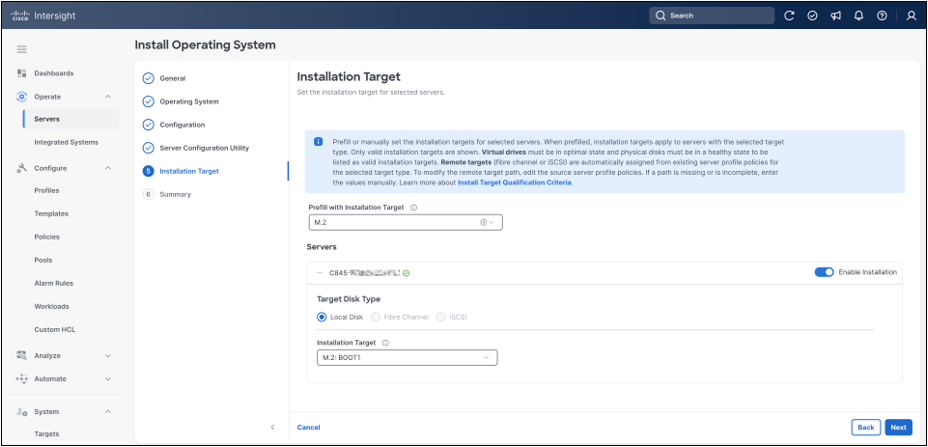
M.2 installation target
In the Summary step, review the selected server, operating system image, configuration mode, network settings, SCU image, and installation target. When the selections are correct, click Install.

OS install summary
Cisco Intersight displays a confirmation prompt before starting the installation. The prompt warns that an existing operating system may be overwritten and that files on the selected target may be deleted. Confirm the prompt only after verifying that the selected installation target is correct.
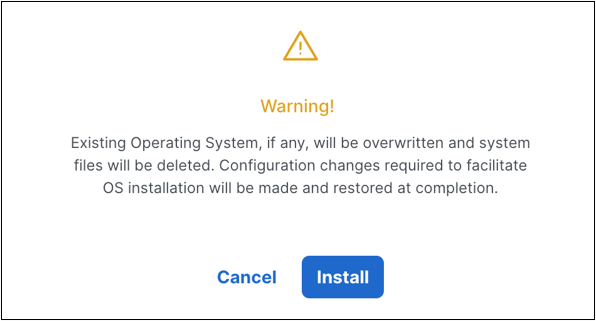
OS overwrite warning
After the installation request is confirmed, Cisco Intersight creates a new request for the operating system installation workflow. Use the Requests view in Cisco Intersight to monitor the overall status of the installation. The request view shows the workflow status, target server, initiator, start time, and overall progress.
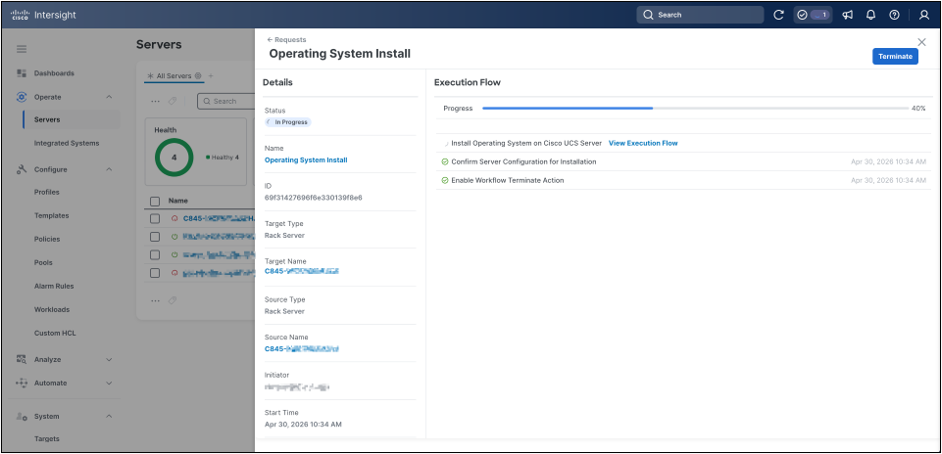
OS install request in progress
Open the operating system installation request to monitor the execution flow in detail. The detailed execution view shows preparation and validation stages, including initiating the operating system installation, preparing the operating system install configuration, validating the install configuration, validating virtual media on the server, validating task parameters, and processing workflow inputs.

OS install request details
The KVM console is useful for confirming server-side progress while Cisco Intersight executes the workflow. From the server context menu, launch vKVM. During installation, the console first displays the Cisco® logo, then the BIOS boot phase. If a BIOS prompt appears, no action is required; wait for the workflow to continue.
After the BIOS phase, SCU prepared the system to boot the installation workflow. The Ubuntu installation then started automatically, and the console showed subiquity and curtin autoinstall activity, including autoinstall configuration handling and storage and installation stages.

Ubuntu autoinstall in KVM

Ubuntu autoinstall in KVM
When the workflow completes, the detailed request view shows successful completion of the operating system’s installation, virtual media reset and image unmount.
Final validation can be performed from the KVM console. After the request completes, the system should reach an Ubuntu 24.04 LTS login prompt with the configured hostname.
6. Post-OS host configuration and component updates
Chapter 6 validates the installed host OS, configures outbound access if required, updates the installed Ubuntu LTS release, and captures a compact hardware inventory before driver installation.
After the Cisco Intersight operating system installation completes and the KVM console reaches the Ubuntu login prompt, validate the host baseline before moving into driver downloads or component-specific enablement. The goal is to confirm that the installed OS is reachable, that the basic platform identity is correct, that network and name resolution are usable, and that the hardware inventory is visible to the OS.
Run the baseline checks from a management workstation that can reach the host OS address. Replace <host-ip> with the address configured during OS installation:
| ssh ubuntu@<host-ip> 'hostnamectl --static; cat /etc/os-release | awk -F= "/^(PRETTY_NAME|VERSION_CODENAME)=/ {gsub(/\"/,"",$2); print $1"="$2}"; uname -r' ssh ubuntu@<host-ip> 'hostnamectl | awk "/Hardware Vendor|Hardware Model|Firmware Version/ {sub(/^[[:space:]]*/,""); print}"' |
Example output, abridged:
| c845a-host PRETTY_NAME=Ubuntu 24.04 LTS VERSION_CODENAME=noble 6.8.0-31-generic
Hardware Vendor: Cisco Systems Inc Hardware Model: CAI-845A-M8 Firmware Version: 1.9.1 |
Validate network readiness before depending on package repositories or external downloads. Confirm that the intended host interface has the expected IP address, that the default route is present, that DNS lookup works, and that the host can reach both its default gateway and an external IP address:
| ssh ubuntu@<host-ip> 'ip -br addr show up; ip route show default; getent hosts cisco.com ubuntu.com' ssh ubuntu@<host-ip> 'gw=$(ip route | awk "/^default/ {print \$3; exit}"); ping -c 3 -W 2 "$gw"; ping -c 3 -W 2 8.8.8.8' |
Example output, abridged:
| enp175s0f1np1 UP <host-ip>/<prefix> default via <gateway-ip> dev enp175s0f1np1 proto static cisco.com and ubuntu.com resolve successfully
gateway ping: 3 transmitted, 3 received, 0% packet loss external IP ping: 3 transmitted, 3 received, 0% packet loss |
If the environment requires an HTTP or HTTPS proxy for outbound access, configure the proxy before updating package repositories. On Ubuntu, set the proxy in /etc/environment so user sessions can inherit it. For apt, also add a dedicated apt proxy configuration so package operations work consistently when run through sudo:
| sudo tee -a /etc/environment >/dev/null <<'EOF' http_proxy="<proxy-url>" https_proxy="<proxy-url>" HTTP_PROXY="<proxy-url>" HTTPS_PROXY="<proxy-url>" no_proxy="localhost,127.0.0.1,::1" NO_PROXY="localhost,127.0.0.1,::1" EOF
sudo tee /etc/apt/apt.conf.d/95proxy >/dev/null <<'EOF' Acquire::http::Proxy "<proxy-url>"; Acquire::https::Proxy "<proxy-url>"; EOF |
Validate clock and package-repository readiness before installing drivers or development tools. A large clock-skew can cause TLS and repository metadata validation failures even when the network path is otherwise working:
| ssh ubuntu@<host-ip> 'timedatectl | awk "/Local time|Time zone|System clock synchronized|NTP service/ {sub(/^[[:space:]]*/,""); print}"' ssh ubuntu@<host-ip> 'sudo apt-get update' |
Expected output pattern:
| System clock synchronized: yes NTP service: active apt repository metadata downloads without time-validity errors |
If apt-get update reports that release files are "not valid yet," correct the time synchronization before proceeding. This error can occur even when the host can reach the repositories, because repository metadata validation depends on the host clock.
Update the installed Ubuntu LTS release before installing platform drivers. The following commands update package metadata, apply package updates within the current Ubuntu release, install kernel meta-package updates when required, and reboot if the updated package set requires it. Do not run a release upgrade unless the target Ubuntu release has been validated for the platform and the deployment plan explicitly calls for it:
| sudo apt-get update sudo DEBIAN_FRONTEND=noninteractive apt-get -y upgrade sudo DEBIAN_FRONTEND=noninteractive apt-get -y full-upgrade if [ -f /var/run/reboot-required ]; then sudo reboot; fi |
After the reboot, reconnect and confirm that the system is running the expected kernel and that no unexpected package updates remain pending.
On systems with large memory configurations, POST and the first boot after firmware or operating system updates can take longer than a typical server reboot. Allow adequate time for POST, memory initialization, and operating system startup before treating temporary SSH or console unavailability as a failure:
| uname -r apt list --upgradable |
Expected output pattern:
| The running kernel matches the updated kernel package. No package updates remain pending, except packages deferred by Ubuntu phased updates. |
Install the baseline host utilities used by the remaining validation commands as a minimal Ubuntu installation, by default, may not include all of the following tools:
| sudo apt-get install -y pciutils numactl lshw ethtool iproute2 |
pciutils provides lspci, numactl provides numactl -H, ethtool reports the interface driver and firmware states, and iproute2 provides the ip commands used for address, route, and link checks. Installing these tools before the inventory step avoids confusing a missing utility with a missing hardware device.
Capture a compact storage, CPU, memory, and PCIe inventory snapshot. The purpose is not to create a complete hardware audit, but to confirm that the expected classes of devices are visible before installing drivers:
| ssh ubuntu@<host-ip> 'lsblk -o NAME,SIZE,TYPE,MOUNTPOINTS; df -h /' ssh ubuntu@<host-ip> 'lscpu | awk -F: "/Model name|Socket\\(s\\)|Core\\(s\\) per socket|Thread\\(s\\) per core|CPU\\(s\\):/ {gsub(/^[ \\t]+/,"",$2); print $1": "$2}"; free -h' ssh ubuntu@<host-ip> 'lspci -nn | egrep -i "nvidia|mellanox|ethernet|infiniband|non-volatile|raid|sas|vga|3d controller"' |
Example output, abridged:
| Boot disk: one local disk mounted at / with /boot/efi Additional NVMe devices: visible to the OS CPU: 2 sockets, 128 logical CPUs, AMD EPYC 9375F Memory: approximately 4 TiB PCIe highlights: NVIDIA 3D controllers, Mellanox ConnectX-7 adapters, NVMe controllers, platform VGA, and storage controllers |
In the example system, the filtered inventory showed four NVIDIA 3D controllers, six Mellanox ConnectX-7 functions, six NVMe disks, one SATA boot disk, and approximately 4 TiB of memory. These values are configuration-specific and should be treated as an example of a successful visibility check, not as a universal Cisco UCS C845A M8 Rack Server inventory requirement.
Validate the CPU and NUMA topology exposed to the operating system. The NUMA layout is the operating system's map for CPU locality, memory locality, and nearby PCIe devices. It should match the platform policy selected before OS installation:
| lscpu | egrep 'CPU\\(s\\)|Thread|Core|Socket|NUMA|Model name' numactl -H |
Example output, abridged:
| Model name: AMD EPYC 9375F 32-Core Processor CPU(s): 128 Thread(s) per core: 2 Core(s) per socket: 32 Socket(s): 2 NUMA node(s): 2
available: 2 nodes (0-1) node 0 cpus: 0-31,64-95 node 1 cpus: 32-63,96-127 node distances: 0: 10 32 1: 32 10 |
lscpu summarizes CPU sockets, cores, threads, and NUMA nodes. numactl -H shows which CPUs belong to each NUMA node and the relative distance between nodes. The distance table is not an absolute latency value; it is a relative cost map used by the operating system and applications. Use it to confirm the selected platform NUMA policy and to plan later CPU, memory, GPU, and NIC locality checks.
Check the IOMMU state reported by Linux:
| cat /proc/cmdline | tr ' ' '\n' | egrep 'iommu|amd_iommu|intel_iommu' || true sudo dmesg | egrep -i 'iommu|AMD-Vi|Intel-IOMMU' | head -n 20 |
Example output, abridged:
| AMD-Vi: Using global IVHD EFR ... iommu: Default domain type: Translated iommu: DMA domain TLB invalidation policy: lazy mode |
The kernel command line shows whether the operating system was started with explicit IOMMU parameters. The dmesg output confirms whether the IOMMU driver was initialized and which default domain type Linux selected. A translated domain indicates that DMA translation is active. A passthrough domain indicates that devices use identity-mapped DMA by default. Select and validate the mode required by the deployment's security policy, driver stack, and GPUDirect RDMA requirements.
7. Software and driver downloads
Chapter 7 enables the NVIDIA software repository, verifies the package families required for GPU enablement, and identifies the version choices that must remain aligned during installation.
Use the Cisco Software Download page for Cisco-provided platform software and use the GPU, NIC, DPU, or operating-system vendor repositories for component software where the validated stack requires them. For Cisco UCS C845A M8 Rack Servers, Cisco Software Download provides UCS Diagnostics, UCS Drivers, UCS Server Configuration Utility, and UCS Server Firmware categories for the product. Record whether each installed component came from media provided by Cisco, the operating-system repositories, NVIDIA repositories, or another approved repository.
For the Ubuntu worked example, use Ubuntu apt as the package manager, but obtain the GPU software stack from NVIDIA repositories rather than relying only on the default Ubuntu package set.
For the Ubuntu 24.04 x86_64 example workflow, first install the basic download and certificate tools, then enable the NVIDIA CUDA network repository with the CUDA keyring package:
| sudo apt-get install -y ca-certificates wget cd /tmp wget https://developer.download.nvidia.com/compute/cuda/repos/ubuntu2404/x86_64/cuda-keyring_1.1-1_all.deb sudo dpkg -i cuda-keyring_1.1-1_all.deb sudo apt-get update |
After the repository is enabled, verify that the expected package families are visible before installing them. In this example, the NVIDIA repository is used for the driver, CUDA toolkit, NCCL, and DCGM package families:
| apt-cache policy cuda-toolkit-13-0 apt-cache policy cuda-drivers-580 apt-cache policy libnccl2 libnccl-dev apt-cache policy datacenter-gpu-manager-4-cuda13 |
Example output, abridged:
| cuda-toolkit-13-0: candidate available from NVIDIA CUDA repository cuda-drivers-580: candidate available from NVIDIA CUDA repository libnccl2/libnccl-dev: CUDA-aligned NCCL packages available from NVIDIA CUDA repository datacenter-gpu-manager-4-cuda13: DCGM 4 package available from NVIDIA CUDA repository |
Choose package versions as a matched set. The CUDA toolkit major version, NVIDIA driver branch, NCCL package variant, and DCGM CUDA package should be selected together based on the target GPU configuration and the compatibility guidance for the software release in use. The example workflow uses the NVIDIA 580 driver branch, CUDA Toolkit 13.0, NCCL packages built for CUDA 13.0, and DCGM 4 for CUDA 13.
Follow the installation order given below:
1. Install matching kernel headers before the GPU driver.
2. Install the NVIDIA driver and reboot if the package installation or kernel state requires it.
3. Validate the driver with nvidia-smi.
4. Install the CUDA toolkit.
5. Install NCCL packages aligned to the selected CUDA major version.
6. Install and enable DCGM for monitoring and diagnostics.
8. GPU software stack installation and validation
Chapter 8 installs the selected NVIDIA driver, CUDA toolkit, NCCL, and DCGM packages, then validates GPU visibility and basic health.
Before installing the GPU driver, install the kernel headers and build tools required for NVIDIA kernel modules. This allows the NVIDIA driver package to build against the active Ubuntu kernel:
| sudo apt-get install -y linux-headers-$(uname -r) build-essential dkms |
Install the selected NVIDIA driver package from the NVIDIA repository:
| sudo apt-get install -y cuda-drivers-580 |
After the driver package installation completes, validate that the driver can enumerate the GPUs:
| nvidia-smi |
Example output, abridged:
| NVIDIA-SMI 580.x Driver Version: 580.x CUDA Version: 13.0
GPU Name Bus-Id Memory 0 NVIDIA H200 NVL 00000000:03:00.0 143771 MiB 1 NVIDIA H200 NVL 00000000:0B:00.0 143771 MiB 2 NVIDIA H200 NVL 00000000:61:00.0 143771 MiB 3 NVIDIA H200 NVL 00000000:69:00.0 143771 MiB |
Read the nvidia-smi output as the first driver-level GPU inventory check. The header shows the loaded NVIDIA driver version and the maximum CUDA runtime version supported by that driver. The GPU rows show the GPU index that later tools use, the detected GPU model, the PCI bus ID, and the visible framebuffer memory. The expected result is that every installed GPU appears with the intended model and a consistent driver version. Missing GPUs, No devices were found, or driver/library mismatch errors should be resolved before installing or validating higher-level CUDA and NCCL software.
Install the CUDA Toolkit, NCCL, and DCGM packages as a matched set. If change control requires an exact NCCL build, list the available package versions before installation and select matching CUDA 13.0 builds for both libnccl2 and libnccl-dev:
| apt-cache madison libnccl2 libnccl-dev |
Example output, abridged:
| libnccl2 2.x-1+cuda13.0 https://developer.download.nvidia.com/... libnccl-dev 2.x-1+cuda13.0 https://developer.download.nvidia.com/... |
When an exact NCCL package version is required, specify the same CUDA 13.0 version for both packages during installation:
| sudo apt-get install -y cuda-toolkit-13-0 \ libnccl2=<nccl-cuda13.0-version> \ libnccl-dev=<nccl-cuda13.0-version> \ datacenter-gpu-manager-4-cuda13 |
If exact package pinning is not required, install the current CUDA 13-compatible NCCL packages selected by the configured NVIDIA repository:
| sudo apt-get install -y cuda-toolkit-13-0 \ libnccl2 libnccl-dev \ datacenter-gpu-manager-4-cuda13 |
For a repeatable validation environment, record the selected NCCL package version after installation and consider holding the NCCL packages so later package upgrades do not move them to a different CUDA minor version unexpectedly:
| sudo apt-mark hold libnccl2 libnccl-dev |
Add the CUDA Toolkit path to the shell environment if the package installation has not already done so through the site's standard profile management:
| sudo tee /etc/profile.d/cuda-13.sh >/dev/null <<'EOF' export PATH=/usr/local/cuda-13.0/bin:$PATH export LD_LIBRARY_PATH=/usr/local/cuda-13.0/lib64${LD_LIBRARY_PATH:+:$LD_LIBRARY_PATH} EOF |
After installation completes, validate the installed package set and CUDA compiler:
| dpkg-query -W cuda-drivers-580 nvidia-driver-580 cuda-toolkit-13-0 \ libnccl2 libnccl-dev datacenter-gpu-manager-4-cuda13 /usr/local/cuda-13.0/bin/nvcc --version |
Example successful output, with patch versions abbreviated:
| cuda-drivers-580 580.x nvidia-driver-580 580.x cuda-toolkit-13-0 13.0.x libnccl2 2.x+cuda13.0 libnccl-dev 2.x+cuda13.0 datacenter-gpu-manager-4-cuda13 4.x
Cuda compilation tools, release 13.0 |
This package check verifies that the driver, CUDA Toolkit, NCCL runtime and development packages, and DCGM package are installed as an aligned software set. The package names identify the installed component families; the version strings confirm the selected release branch. In this guide, the important relationship is that the CUDA Toolkit is 13.0 and the NCCL packages are built for CUDA 13.0. The nvcc output confirms that the CUDA compiler installed with the toolkit is available and reports the expected CUDA release.
Enable and start DCGM, then confirm that it discovers the GPUs:
| sudo systemctl enable --now nvidia-dcgm dcgmi discovery -l |
Example output, abridged:
| 4 GPUs found (Active). GPU ID Device Information 0 Name: NVIDIA H200 NVL PCI Bus ID: 00000000:03:00.0 1 Name: NVIDIA H200 NVL PCI Bus ID: 00000000:0B:00.0 2 Name: NVIDIA H200 NVL PCI Bus ID: 00000000:61:00.0 3 Name: NVIDIA H200 NVL PCI Bus ID: 00000000:69:00.0 |
DCGM discovery confirms that the DCGM host engine can enumerate the GPUs through the installed driver. The first line reports the number of active GPUs visible to DCGM. The GPU ID values are DCGM identifiers used by DCGM commands, while the PCI bus IDs let administrators correlate DCGM output with nvidia-smi, lspci, and platform inventory. If nvidia-smi sees GPUs but DCGM does not, check the nvidia-dcgm service state and DCGM package installation before running diagnostics.
Enable NVIDIA persistence mode after the driver is loaded:
| sudo nvidia-smi -pm 1 nvidia-smi --query-gpu=index,persistence_mode --format=csv |
Example output, abridged:
| index, persistence_mode 0, Enabled 1, Enabled 2, Enabled 3, Enabled |
Persistence mode keeps the NVIDIA driver initialized for each GPU after the first client exits. This can reduce initialization overhead and avoids some surprises when running repeated diagnostics or benchmarks. The index column is the same GPU index that was shown by nvidia-smi; Enabled confirms that the setting was applied. If any GPU remains Disabled, rerun the command with appropriate privileges and confirm that the driver and nvidia-persistenced service are healthy.
8.1 Validate GPU, NIC, NUMA, and PCIe topology
After the NVIDIA GPU driver and NIC driver are present, validate the physical topology that GPU libraries and RDMA-aware applications will see. This does not tune the application by itself; it gives administrators the map needed to reason about locality, PCIe paths, NUMA placement, and GPU-to-NIC communication.
| nvidia-smi topo -m |
Example output, abridged:
| GPU0 GPU1 GPU2 GPU3 NIC0 NIC1 NIC2 NIC3 NIC4 NIC5 CPU Affinity NUMA Affinity GPU0 X NV6 NV6 NV6 NODE PIX NODE NODE SYS SYS 0-31,64-95 0 GPU1 NV6 X NV6 NV6 NODE PIX NODE NODE SYS SYS 0-31,64-95 0 GPU2 NV6 NV6 X NV6 PIX NODE NODE NODE SYS SYS 0-31,64-95 0 GPU3 NV6 NV6 NV6 X PIX NODE NODE NODE SYS SYS 0-31,64-95 0
NIC Legend: NIC0: mlx5_0 NIC1: mlx5_1 NIC2: mlx5_2 NIC3: mlx5_3 NIC4: mlx5_4 NIC5: mlx5_5 |
Read the matrix as a locality map. NV# means the GPUs are connected through a bonded set of NVLinks. PIX means the path traverses at most one PCIe bridge and is typically closer than paths that traverse a host bridge or socket interconnect. NODE means the path stays within a NUMA node but crosses PCIe host-bridge infrastructure. SYS means the path crosses the CPU socket interconnect. The CPU and NUMA affinity columns show the CPUs and NUMA node closest to each GPU. Use this output to decide how to bind applications, select NCCL or UCX devices, and interpret performance results.
Check NVLink status when the platform uses NVLink-connected GPUs:
| nvidia-smi nvlink -s nvidia-smi topo -p2p n |
Example output, abridged:
| GPU 0: NVIDIA H200 NVL Link 0: 26.562 GB/s Link 1: 26.562 GB/s ...
GPU0 GPU1 GPU2 GPU3 GPU0 X OK OK OK GPU1 OK X OK OK GPU2 OK OK X OK GPU3 OK OK OK X |
nvidia-smi nvlink -s reports per-link NVLink bandwidth status. nvidia-smi topo -p2p n reports whether peer-to-peer communication over NVLink is supported between GPU pairs. Use these checks to confirm that the GPU interconnect is visible before relying on collective communication performance.
Confirm that GPUs and high-speed adapters negotiated the expected PCIe generation and width:
| nvidia-smi --query-gpu=index,name,pci.bus_id,pcie.link.gen.current,pcie.link.gen.max,pcie.link.width.current,pcie.link.width.max --format=csv
for dev in 03:00.0 15:00.0 29:00.0 71:00.0; do echo "--- $dev" sudo lspci -s "$dev" -vvv | egrep 'LnkCap:|LnkSta:' done |
Example output, abridged:
| index, name, pci.bus_id, pcie.link.gen.current, pcie.link.gen.max, pcie.link.width.current, pcie.link.width.max 0, NVIDIA H200 NVL, 00000000:03:00.0, 5, 5, 16, 16 1, NVIDIA H200 NVL, 00000000:0B:00.0, 5, 5, 16, 16
--- 03:00.0 LnkCap: Speed 32GT/s, Width x16 LnkSta: Speed 32GT/s, Width x16 --- 29:00.0 LnkCap: Speed 32GT/s, Width x16 LnkSta: Speed 32GT/s, Width x16 |
The NVIDIA query reports the active PCIe generation and width for each GPU. lspci provides the same style of check for PCIe devices such as GPUs and NICs. LnkCap is what the device and slot are capable of negotiating, while LnkSta is the speed and width currently in use. If LnkSta is lower than expected, inspect slot placement, riser/cable seating, firmware settings, and platform logs before treating workload performance as an application issue.
Run a DCGM level-1 diagnostic after DCGM is active. This check validates the basic software deployment state and confirms that DCGM can communicate with each GPU through the installed driver:
| dcgmi diag -r 1 |
Example output, abridged:
| Diagnostic Result DCGM Version 4.x Driver Version Detected 580.x software Pass GPU0 Pass GPU1 Pass GPU2 Pass GPU3 Pass |
Read this output as a basic DCGM health gate. DCGM Version identifies the diagnostic tool version. Driver Version Detected confirms that DCGM is using the same NVIDIA driver branch validated earlier. The software row verifies the deployment-level checks performed by the level-1 diagnostic, and the per-GPU rows show whether each GPU passed those checks. A failure at this stage usually indicates a driver, DCGM service, device-file, or package-version issue that should be resolved before running workload benchmarks.
8.3 Validate CUDA compile and runtime behavior
Confirm that the CUDA compiler can build a program and that the resulting binary can launch a kernel. The following vector-add sample allocates unified memory, launches a CUDA kernel, waits for completion, and checks the result.
Create a persistent validation working directory and write the sample source file there. Avoid using /tmp for validation artifacts that you may want to rerun after a reboot:
| mkdir -p ~/c845a-validation cat > ~/c845a-validation/cuda-vector-add.cu <<'EOF' #include <cuda_runtime.h> #include <stdio.h>
__global__ void add(const float *a, const float *b, float *c, int n) { int i = blockIdx.x * blockDim.x + threadIdx.x; if (i < n) { c[i] = a[i] + b[i]; } }
int main() { int n = 1 << 20; size_t bytes = n * sizeof(float); float *a, *b, *c;
cudaMallocManaged(&a, bytes); cudaMallocManaged(&b, bytes); cudaMallocManaged(&c, bytes);
for (int i = 0; i < n; i++) { a[i] = 1.0f; b[i] = 2.0f; }
add<<<(n + 255) / 256, 256>>>(a, b, c, n); cudaError_t err = cudaDeviceSynchronize(); if (err != cudaSuccess) { fprintf(stderr, "CUDA error: %s\n", cudaGetErrorString(err)); return 1; }
int errors = 0; for (int i = 0; i < n; i++) { if (c[i] != 3.0f) { errors++; } }
int device = -1; cudaGetDevice(&device); cudaFree(a); cudaFree(b); cudaFree(c);
printf("CUDA vector add completed on device %d; errors=%d\n", device, errors); return errors ? 1 : 0; } EOF |
Compile and run the sample:
| /usr/local/cuda-13.0/bin/nvcc \ ~/c845a-validation/cuda-vector-add.cu \ -o ~/c845a-validation/cuda-vector-add ~/c845a-validation/cuda-vector-add |
Example output:
| CUDA vector add completed on device 0; errors=0 |
This test validates both the compiler path and the runtime path. Successful compilation proves that nvcc, CUDA headers, and CUDA libraries are usable. Successful execution proves that the CUDA runtime can allocate GPU-accessible memory, launch a kernel, synchronize with the GPU, and return a correct result to the host. device 0 means that the runtime selected GPU index 0 for the test. errors=0 means that every checked result matched the expected value. A compile failure usually points to toolkit-path or package issues; a runtime failure usually points to driver, device-access, or CUDA runtime compatibility issues.
Use NCCL tests for a first single-node communication smoke test before moving into larger benchmark or fabric-validation work. If your package repository does not provide prebuilt nccl-tests binaries, build the NVIDIA test suite from source:
| sudo apt-get install -y git make g++ git clone --depth 1 https://github.com/NVIDIA/nccl-tests.git \ ~/c845a-validation/nccl-tests make -C ~/c845a-validation/nccl-tests \ MPI=0 CUDA_HOME=/usr/local/cuda-13.0 -j$(nproc) |
The MPI=0 build is sufficient for the single-node tests shown here. Multi-node NCCL validation requires MPI or another multi-process launch method and should be treated as a separate fabric-validation activity.
8.5 Run single-node NCCL smoke tests
Start with an all-reduce test across the installed GPUs:
| ~/c845a-validation/nccl-tests/build/all_reduce_perf -b 8 -e 64M -f 2 -g 4 |
Example output, abridged:
| nccl-tests version 2.x nccl-headers=228xx nccl-library=228xx Using devices Rank 0 device 0 NVIDIA H200 NVL Rank 1 device 1 NVIDIA H200 NVL Rank 2 device 2 NVIDIA H200 NVL Rank 3 device 3 NVIDIA H200 NVL
size algbw busbw #wrong 67108864 196.x 294.x 0
Out of bounds values : 0 OK Collective test concluded: all_reduce_perf |
Read the first lines as the NCCL software identity: nccl-headers and nccl-library should correspond to the NCCL package version installed earlier. The Using devices section confirms which GPU indices and PCI bus IDs are participating. The size field is the message size in bytes. algbw is the algorithm bandwidth reported by the test for the collective operation, while busbw is NCCL's estimate of effective bus bandwidth for that collective. #wrong is the data-validation error count. For this smoke test, the pass criteria are the expected GPU count, #wrong equal to 0, Out of bounds values : 0 OK, and normal test completion. The exact bandwidth numbers vary by GPU population, PCIe topology, firmware, BIOS settings, and system load.
Run a point-to-point send/receive smoke test as a second NCCL check:
| ~/c845a-validation/nccl-tests/build/sendrecv_perf -b 8 -e 64M -f 2 -g 4 |
Example output, abridged:
| Collective test starting: sendrecv_perf Using devices Rank 0 device 0 NVIDIA H200 NVL Rank 1 device 1 NVIDIA H200 NVL Rank 2 device 2 NVIDIA H200 NVL Rank 3 device 3 NVIDIA H200 NVL
size algbw busbw #wrong 67108864 113.x 113.x 0
Out of bounds values : 0 OK Collective test concluded: sendrecv_perf |
The send/receive test is a point-to-point NCCL communication check. As with the all-reduce test, first confirm that the expected GPUs appear in the Using devices section. The bandwidth columns show transfer behavior for the tested message size, and #wrong reports validation errors for the out-of-place path. Some in-place validation fields can show N/A for this test type; focus on the reported validation column, Out of bounds values : 0 OK, and normal completion. These tests are not final performance characterization. They are early validation checks which confirm that NCCL can load, enumerate the GPUs, move data across the selected GPU set, and complete without data-validation errors.
8.6 Run a short sustained NCCL performance check
After the smoke tests pass, run a short sustained NCCL test to confirm that GPU-to-GPU communication remains stable under a longer transfer loop. The following example uses a fixed 64 MiB all-reduce across four GPUs for approximately two minutes:
| START=$(date +%s) ~/c845a-validation/nccl-tests/build/all_reduce_perf \ -b 64M -e 64M -f 2 -g 4 -w 20 -n 165000 END=$(date +%s) echo "Elapsed seconds: $((END-START))" |
Example output, abridged:
| nccl-tests version 2.x nccl-headers=228xx nccl-library=228xx Collective test starting: all_reduce_perf iters: 165000
Using devices Rank 0 device 0 NVIDIA H200 NVL Rank 1 device 1 NVIDIA H200 NVL Rank 2 device 2 NVIDIA H200 NVL Rank 3 device 3 NVIDIA H200 NVL
size time(us) algbw(GB/s) busbw(GB/s) #wrong 67108864 342.x 195.x 293.x 0 67108864 341.x 196.x 294.x 0
Out of bounds values : 0 OK Avg bus bandwidth : 294.x Collective test concluded: all_reduce_perf Elapsed seconds: 118 |
Use this as a stability and sanity check, not as a formal benchmark. A passing run should complete without timeout, show the expected GPU count, report #wrong as 0, and end with Out of bounds values : 0 OK. Bandwidth values are useful for comparison between repeated runs on the same system, but they vary with GPU population, PCIe topology, BIOS and firmware settings, power and thermal state, and background system activity.
The sustained run uses the same all-reduce operation as the smoke test, but fixes the message size at 64 MiB and increases the iteration count so the workload runs for roughly two minutes. iters is the requested number of measured iterations after warmup. The two result rows in the abridged output represent out-of-place and in-place test modes. time(us) is the average operation time in microseconds for the row. algbw and busbw provide throughput indicators, and Avg bus bandwidth summarizes the measured bus bandwidth across the reported modes. Treat these values as a baseline for the same server under the same configuration. A large drop between repeated runs, new validation errors, thermal or power throttling messages, or a timeout should trigger investigation before moving to workload-level benchmarking.
9. Networking adapter firmware, drivers, and mode validation
Chapter 9 discusses how to discover the installed NVIDIA networking adapters, record the current firmware baseline, update ConnectX-7 firmware, install the host networking stack, inspect Ethernet or InfiniBand port mode, and clarify where BlueField DPU operating modes apply.
The adapter examples in this section use NVIDIA ConnectX-7 NICs. ConnectX adapters support NIC functions such as Ethernet or InfiniBand port mode, RoCE, SR-IOV, firmware updates, and RDMA driver validation. DPU mode, NIC mode, and zero-trust mode are BlueField operating modes. For example, NVIDIA documents BlueField DPU mode as embedded function ownership where the ARM Compute Subsystem controls NIC resources and the data path; the same NVIDIA platform documentation lists BlueField-3 B3220 and B3140H-class devices with ARM subsystem cores and integrated BMCs. Treat DPU-mode procedures as applicable to BlueField adapters, not to ConnectX-7 NICs.
9.1 Network design proposal for RoCE fabrics
Plan the network design before workload validation begins. Treat each high-speed adapter port as a fabric rail and validate the rails independently before running NCCL, distributed training, or storage traffic over the fabric.
At a minimum, document the intended design for each rail:
● Host interface name and PCI bus address
● RDMA device name from ibdev2netdev or rdma link show
● Adapter slot or BMC inventory identifier
● Switch name and switch port
● Link speed, FEC, MTU, and expected link layer
● IP address, peer address, and gateway if the rail is routed
● Whether the rail is used for RoCE, storage, GPU-to-GPU communication, or another data-plane role
Install basic topology and network-inspection tools before validating a cabled fabric. Ubuntu does not install LLDP tooling by default, and the RDMA user-space tools are required for later RDMA inventory and traffic checks:
| sudo apt-get install -y lldpd iproute2 ethtool rdma-core perftest sudo systemctl enable --now lldpd |
lldpd lets the host learn the directly connected switch and switch port through LLDP. iproute2, ethtool, and rdma-core provide the interface, driver, and RDMA inventory commands used throughout this chapter. perftest provides RDMA traffic-generation tools that can be used later when a peer host or fabric endpoint is available.
When links are connected, use LLDP to confirm the physical topology:
| for i in $(ls /sys/class/net | grep -v '^lo$' | sort); do echo "--- $i" lldpctl "$i" 2>/dev/null | egrep 'SysName|PortID|PortDescr' || true done |
Example output, abridged:
| --- ens10np0 SysName: leaf-1 PortID: ifname Ethernet1/17/1 PortDescr: connected-to-c845a-rail-1
--- enp41s0f0np0 SysName: leaf-2 PortID: ifname Ethernet1/18/1 PortDescr: connected-to-c845a-rail-2 |
LLDP output confirms physical cabling from the host perspective. SysName identifies the adjacent switch. PortID or PortDescr identifies the switch port. If an expected high-speed interface has no LLDP neighbor, check cabling, optics or DAC support, switch-port state, and whether LLDP is enabled on the switch.
For RoCEv2 Ethernet fabrics, the switch configuration should be treated as part of the server bring-up design. The exact commands vary by switch platform and software release, but the relevant concepts are consistent: jumbo MTU, lossless handling for the selected RoCE class, congestion handling for CNP traffic, and QoS policy application on the data-plane interfaces.
The following generalized Cisco Nexus®-style snippets show the type of configuration to verify with the network team. They are examples only and must be adapted to the switch platform, software release, topology, QoS policy, and site addressing plan.
Network QoS for jumbo frames and PFC on the selected class:
| policy-map type network-qos <network-qos-policy> class type network-qos <roce-network-class> mtu 9216 pause pfc-cos <roce-cos> class type network-qos <default-network-class> mtu 9216
system qos service-policy type network-qos <network-qos-policy> QoS classification for RoCE and CNP traffic: class-map type qos match-any <cnp-class> match <cnp-traffic-selector>
class-map type qos match-any <roce-class> match <roce-traffic-selector>
policy-map type qos <qos-classification-policy> class <roce-class> set qos-group <roce-qos-group> class <cnp-class> set qos-group <cnp-qos-group> class class-default set qos-group 0 |
Egress queuing with ECN marking for the RoCE queue:
| policy-map type queuing <egress-queuing-policy> class type queuing <roce-queue> random-detect minimum-threshold <min-threshold> maximum-threshold <max-threshold> ecn |
Data-plane interface treatment:
| interface Ethernet<slot>/<port> description <server>-<rail> no switchport mtu 9216 ip address <rail-gateway-ip>/<prefix> service-policy type qos input <qos-classification-policy> priority-flow-control mode on priority-flow-control watch-dog-interval on no shutdown |
A successful fabric design should make the host and switch views agree. On the host, LLDP should show the expected switch and port, ethtool should show the expected driver, firmware, link speed, and link state, rdma link show should show the RDMA device mapped to the expected network interface, and per-rail peer or gateway tests should pass. On the switch, the corresponding port should show link-up, the intended MTU and QoS policies, and healthy PFC/ECN counters without unexpected drops.
9.2 Discover NVIDIA networking inventory
Before changing NIC port mode or adapter configuration, capture the current network-adapter inventory. This confirms what the operating system can see and gives you a firmware baseline before any update is attempted.
| lspci -nn | egrep -i 'mellanox|connectx|bluefield|infiniband|ethernet|network' ip -br link lsmod | egrep 'mlx5|ib_core|rdma' || true |
Example output, abridged:
| 15:00.0 Ethernet controller: Mellanox Technologies MT2910 Family [ConnectX-7] 29:00.0 Ethernet controller: Mellanox Technologies MT2910 Family [ConnectX-7] 29:00.1 Ethernet controller: Mellanox Technologies MT2910 Family [ConnectX-7] 71:00.0 Ethernet controller: Mellanox Technologies MT2910 Family [ConnectX-7] 9b:00.0 Ethernet controller: Mellanox Technologies MT2910 Family [ConnectX-7] eb:00.0 Ethernet controller: Mellanox Technologies MT2910 Family [ConnectX-7] af:00.0 Ethernet controller: Intel Ethernet Controller X710 for 10GBASE-T af:00.1 Ethernet controller: Intel Ethernet Controller X710 for 10GBASE-T
mlx5_ib ib_uverbs ib_core mlx5_core |
Read the PCI inventory first. Each ConnectX-7 entry is a PCI function exposed to the host; a dual-port adapter can appear as two functions. The Intel® X710 entries are separate host-management Ethernet ports and should not be confused with the high-speed ConnectX-7 adapters. The loaded mlx5_core and mlx5_ib modules show that the Linux inbox Mellanox Ethernet/RDMA driver stack is active before any additional NVIDIA networking package is installed.
Map Linux interface names back to their PCI devices and current firmware:
| for i in $(ls /sys/class/net | grep -v '^lo$' | sort); do echo "--- $i" ethtool -i "$i" 2>/dev/null | egrep 'driver|version|firmware-version|bus-info' || true done |
Example output, abridged:
| --- ens10np0 driver: mlx5_core version: 6.8.0-110-generic firmware-version: 28.43.2026 (MT_0000001244) bus-info: 0000:71:00.0
--- enp41s0f0np0 driver: mlx5_core version: 6.8.0-110-generic firmware-version: 28.43.2026 (MT_0000000834) bus-info: 0000:29:00.0 |
This output connects the administrative interface name, driver, firmware version, PSID, and PCI address. The PSID in parentheses identifies the exact adapter firmware family and must match any firmware image used for an update. Do not update firmware with an image that does not match the adapter PSID.
9.3 Install MFT and capture the firmware baseline
Install NVIDIA Mellanox Firmware Tools (MFT) before querying firmware in detail. In the Ubuntu workflow shown in this guide, the mft package is available from the NVIDIA repository already enabled for the GPU software stack:
| apt-cache policy mft sudo apt-get install -y mft dpkg-query -W -f='${Package} ${Version}\n' mft |
Example output, abridged:
| mft: Candidate: 4.34.x
mft 4.34.x |
MFT provides firmware-management utilities such as mlxfwmanager. It is tooling only; installing MFT does not update NIC firmware by itself.
After installing MFT, check whether MST device nodes are available:
| sudo mst start sudo mst status |
Example output, abridged:
| MST PCI module is not loaded MST PCI configuration module is not loaded
PCI devices: DEVICE_TYPE MST PCI RDMA NET ConnectX7 NA 29:00.0 mlx5_2 net-enp41s0f0np0 ConnectX7 NA 71:00.0 mlx5_0 net-ens10np0 |
If mst status shows MST device names as NA, use PCI addresses for firmware inventory and basic adapter queries, or install the supported NVIDIA networking driver/tooling package set that provides the MST kernel modules for the running kernel before proceeding.
Query the current adapter firmware inventory:
| sudo mlxfwmanager --query |
Example output, abridged:
| Device Type: ConnectX7 Part Number: MCX715105AS-WEAT_Ax PSID: MT_0000001244 PCI Device Name: 0000:71:00.0 Versions: Current Available FW 28.43.2026 N/A PXE 3.7.0500 N/A UEFI 14.36.0021 N/A Status: No matching image found
Device Type: ConnectX7 Part Number: MCX755106AS-HEA_Ax PSID: MT_0000000834 PCI Device Name: 0000:29:00.0 Versions: Current Available FW 28.43.2026 N/A Status: No matching image found |
Read mlxfwmanager --query as the authoritative firmware baseline for the NVIDIA adapters. Device Type identifies the adapter family. Part Number identifies the card model. PSID is the firmware identity used to match the correct image. PCI Device Name maps the firmware record to the PCI address seen in lspci and ethtool. Under Versions, Current is what is installed now; Available is populated only when mlxfwmanager has access to a matching firmware image or repository. Status: No matching image found means the tool successfully queried the adapter, but no PSID-matched update image was available in the current search path.
9.4 Update ConnectX-7 adapter firmware
When internet access to NVIDIA firmware metadata is available and your change-control process allows online firmware lookup, query the available firmware for the PSIDs observed in the baseline:
| sudo mlxfwmanager --online-query-psid MT_0000001244,MT_0000000834 --query |
Example output, abridged:
| Device Type: ConnectX7 Part Number: MCX715105AS-WEAT_Ax PSID: MT_0000001244 Versions: Current Available FW 28.43.2026 28.47.1026 Status: Found
Device Type: ConnectX7 Part Number: MCX755106AS-HEA_Ax PSID: MT_0000000834 Versions: Current Available FW 28.43.2026 28.47.1026 Status: Found |
The online query does not update firmware. It only confirms whether the online repository contains a firmware image that matches the adapter PSID. Status: Found means the tool found a PSID-matched image. Confirm that the available version is approved for the target environment before updating.
Schedule a maintenance window before updating adapter firmware. The update can temporarily affect high-speed network ports, and the new firmware may not become active until the host is restarted. To perform the online update with MFT, run:
| sudo mlxfwmanager --online -u -y --log -L /tmp/mlxfwmanager-update.log |
Example output, abridged:
| Querying Mellanox devices firmware ...
Device #1: ConnectX7 PSID MT_0000001244 FW 28.43.2026 -> 28.47.1026 Status: Update required Device #2: ConnectX7 PSID MT_0000000834 FW 28.43.2026 -> 28.47.1026 Status: Update required
Downloading MFA bundle ... Device #1: Updating FW ... Done Device #2: Updating FW ... Done Device #3: Updating FW ... Done Device #4: Updating FW ... Done Device #5: Updating FW ... Done
Restart needed for updates to take effect. |
The update output can include a warning similar to BME is not set, DMA access is not supported. Treat any warning as something to review in the update log, but use the final per-device status and the post-restart verification to determine whether the update completed successfully. If you need the log after the reboot, write it to a persistent filesystem path rather than /tmp, because some operating-system configurations clean /tmp during startup.
After the firmware update completes, restart the host if MFT reports that a restart is needed. On systems with large memory configurations, allow additional time for POST and memory initialization before concluding that the host is unavailable.
After the host returns, verify the active driver-level firmware version:
| for i in ens10np0 ens32np0 enp41s0f0np0 enp41s0f1np1 ens12np0 ens11np0; do printf '%-16s ' "$i" ethtool -i "$i" 2>/dev/null | awk -F': ' '/driver|firmware-version|bus-info/{print $1 "=" $2}' | paste -sd' ' - done |
Example output, abridged:
| ens10np0 driver=mlx5_core firmware-version=28.47.1026 (MT_0000001244) bus-info=0000:71:00.0 ens32np0 driver=mlx5_core firmware-version=28.47.1026 (MT_0000001244) bus-info=0000:15:00.0 enp41s0f0np0 driver=mlx5_core firmware-version=28.47.1026 (MT_0000000834) bus-info=0000:29:00.0 enp41s0f1np1 driver=mlx5_core firmware-version=28.47.1026 (MT_0000000834) bus-info=0000:29:00.1 ens12np0 driver=mlx5_core firmware-version=28.47.1026 (MT_0000001244) bus-info=0000:eb:00.0 ens11np0 driver=mlx5_core firmware-version=28.47.1026 (MT_0000001244) bus-info=0000:9b:00.0 |
This verification is important because the firmware manager can show that the new image has been written before the running driver reports the new active firmware. The pass criteria are that each expected ConnectX-7 interface is present, the driver is mlx5_core, the firmware version matches the target version, and the bus information maps back to the expected PCI inventory. A dual-port adapter can appear as two operating-system interfaces with the same PSID and adjacent PCI functions.
9.5 Install the NVIDIA DOCA-OFED host networking stack
After the firmware baseline is current, install the NVIDIA host networking stack. NVIDIA DOCA-Host is the NVIDIA-documented host networking software path for ConnectX and BlueField adapters. The example below uses the DOCA 3.3.0 doca-ofed profile for Ubuntu 24.04 x86_64, based on the NVIDIA DOCA-Host installation workflow and the NVIDIA DOCA downloads page. Use the current NVIDIA DOCA documentation and downloads page for the release, operating system, architecture, and profile selected for your environment.
Before installing the networking stack, install the repository, build, and secure-boot inspection tools used by the DOCA-OFED setup and readiness checks:
| sudo apt-get install -y ca-certificates curl gnupg \ linux-headers-$(uname -r) build-essential dkms mokutil |
Then confirm host readiness:
| uname -r test -d /lib/modules/$(uname -r)/build && echo "kernel headers present" gcc --version | head -n 1 dkms --version mokutil --sb-state 2>/dev/null || true |
Example output, abridged:
| 6.8.0-110-generic kernel headers present gcc (Ubuntu 13.3.0-6ubuntu2~24.04.1) 13.3.0 dkms-3.3.0 SecureBoot disabled |
The DOCA-Host profile uses DKMS to build kernel modules for the running kernel. Matching kernel headers and a working compiler toolchain are required before the package installation begins. If secure boot is enabled, plan for the key-enrollment workflow required by the operating system and NVIDIA documentation before expecting newly built DKMS modules to load.
Configure the NVIDIA DOCA online repository for the selected release and install the doca-ofed profile:
| export DOCA_URL="https://linux.mellanox.com/public/repo/doca/3.3.0/ubuntu24.04/x86_64/" curl -fsSL https://linux.mellanox.com/public/repo/doca/GPG-KEY-Mellanox.pub \ | gpg --dearmor \ | sudo tee /etc/apt/trusted.gpg.d/GPG-KEY-Mellanox.gpg >/dev/null echo "deb [signed-by=/etc/apt/trusted.gpg.d/GPG-KEY-Mellanox.gpg] $DOCA_URL ./" \ | sudo tee /etc/apt/sources.list.d/doca.list sudo apt-get update sudo apt-get -s install doca-ofed sudo apt-get install -y doca-ofed |
The simulated install is optional but recommended. It shows the package impact before the system is modified. If another repository exposes an older mft package at higher apt priority than the DOCA repository, explicitly select the DOCA-compatible mft package version required by doca-ofed:
| sudo apt-get install -y doca-ofed mft=4.35.0-159 doca-sosreport |
Example output, abridged:
| The following NEW packages will be installed: doca-ofed doca-sosreport kernel-mft-dkms mlnx-ofed-kernel-dkms mft-mlx5 perftest rdma-core ... The following packages will be upgraded: ibverbs-providers libibverbs1 mft
Setting up kernel-mft-dkms ... Installing /lib/modules/6.8.0-110-generic/updates/dkms/mst_pci.ko.zst Installing /lib/modules/6.8.0-110-generic/updates/dkms/mst_pciconf.ko.zst
Setting up mlnx-ofed-kernel-dkms ... Installing /lib/modules/6.8.0-110-generic/updates/dkms/mlx5_core.ko.zst Installing /lib/modules/6.8.0-110-generic/updates/dkms/mlx5_ib.ko.zst
Setting up doca-ofed (3.3.0-088000) ... |
Read the install output in three parts. The package list shows which operating-system RDMA packages and NVIDIA packages will be installed or upgraded. The kernel-mft-dkms lines confirm that the MST kernel modules are now built for the running kernel. The mlnx-ofed-kernel-dkms lines confirm that the NVIDIA OFED kernel modules, including mlx5_core and mlx5_ib, are built and installed under the DKMS update path. It is normal for the install to take several minutes while DKMS builds modules.
After the installation completes, perform a planned reboot before validating the host networking stack:
| sudo reboot |
The reboot gives the operating system a clean opportunity to load the newly installed OFED and MST kernel modules. This is the recommended path for a publishable bring-up workflow because networking and RDMA modules may already be loaded or in use before the package installation completes. On systems with large memory configurations, firmware POST and operating-system return can take several minutes; allow the reboot to complete before troubleshooting the driver stack.
After the host returns, initialize MST and verify that device nodes are present:
| sudo mst start sudo mst status |
Example output, abridged:
| Starting MST (Mellanox Software Tools) driver set Loading MST PCI module - Success Loading MST PCI configuration module - Success Create devices MST devices: /dev/mst/mt4129_pciconf0 domain:bus:dev.fn=0000:15:00.0 /dev/mst/mt4129_pciconf1 domain:bus:dev.fn=0000:29:00.0 /dev/mst/mt4129_pciconf2 domain:bus:dev.fn=0000:71:00.0 |
After kernel-mft-dkms is installed and the host has rebooted, mst start should create the expected MST device nodes. The non-verbose mst status command returns the device nodes and PCI mappings. Use these device nodes or the PCI addresses in later firmware, link, and mode-validation commands.
9.6 Validate DOCA-OFED installation and RDMA visibility
Verify the installed package versions, DKMS state, and active loaded driver:
| dpkg-query -W -f='${Package} ${Version}\n' \ doca-ofed mft mft-mlx5 kernel-mft-dkms mlnx-ofed-kernel-dkms \ rdma-core ibverbs-providers perftest doca-sosreport dkms status ofed_info -s cat /sys/module/mlx5_core/version |
Example output, abridged:
| doca-ofed 3.3.0-088000 mft 4.35.0-159 mft-mlx5 4.35.0-159 kernel-mft-dkms 4.35.0.159-1 mlnx-ofed-kernel-dkms 26.01.OFED.26.01.1.0.0.1-1 rdma-core 2601.0.7-1 perftest 26.01.5-1
mlnx-ofed-kernel/26.01.OFED.26.01.1.0.0.1, 6.8.0-110-generic: installed kernel-mft-dkms/4.35.0.159, 6.8.0-110-generic: installed
OFED-internal-26.01-1.0.0: 26.01-1.0.0 |
The package versions identify the installed DOCA-OFED profile and the accompanying MFT, RDMA, and test utilities. dkms status confirms that the kernel modules were built and installed for the active kernel. ofed_info -s identifies the installed OFED stack, and /sys/module/mlx5_core/version confirms the version of the loaded mlx5_core driver after the post-install reboot.
Finally, verify that the ConnectX-7 interfaces and RDMA devices remain visible:
| for i in ens10np0 ens32np0 enp41s0f0np0 enp41s0f1np1 ens12np0 ens11np0; do printf '%-16s ' "$i" ethtool -i "$i" 2>/dev/null | awk -F': ' '/driver|version|firmware-version|bus-info/{print $1 "=" $2}' | paste -sd' ' - done rdma link show ibdev2netdev ibv_devices ibstat | egrep "^CA '|Firmware version|State:|Physical state:|Rate:|Link layer" |
Example output, abridged:
| ens10np0 driver=mlx5_core version=26.01-1.0.0 firmware-version=28.47.1026 bus-info=0000:71:00.0 enp41s0f0np0 driver=mlx5_core version=26.01-1.0.0 firmware-version=28.47.1026 bus-info=0000:29:00.0 link mlx5_0/1 state DOWN physical_state DISABLED netdev ens10np0 link mlx5_2/1 state DOWN physical_state DISABLED netdev enp41s0f0np0 mlx5_0 port 1 ==> ens10np0 (Down) mlx5_2 port 1 ==> enp41s0f0np0 (Down) device node GUID ------ ---------------- mlx5_0 <node-guid> mlx5_1 <node-guid> mlx5_2 <node-guid> CA 'mlx5_0' Firmware version: 28.47.1026 State: Down Physical state: Disabled Link layer: Ethernet |
The interface check confirms that the operating system is using the NVIDIA OFED mlx5_core driver and that the expected firmware remains active.
rdma link show and ibdev2netdev map RDMA devices to Linux network interfaces.
ibv_devices confirms that verbs devices are visible to RDMA applications, and ibstat reports RDMA port state, physical state, firmware, rate, and link layer. DOWN or DISABLED is acceptable for ports that are not cabled or administratively enabled yet; it still confirms that the driver and verbs devices are present. Evaluate the RDMA link state against the intended cabling and fabric design for the deployment.
9.7 Configure server-side RoCE traffic marking
For RoCEv2 fabrics that use lossless classes, the host and switch must agree on how RDMA traffic is marked and classified. The exact values should come from the fabric QoS design. A common design maps RoCE traffic to DSCP 24, which corresponds to IP ToS 96 and priority 3 when the upper DSCP bits are mapped to Ethernet priority.
The commands in this section assume the NVIDIA DOCA-OFED host networking stack from section 9.5 has been installed. That package set provides tools such as mlnx_qos and cma_roce_tos. If those commands are not present, complete the networking-stack installation before attempting RoCE marking validation.
Inspect the current QoS state on each high-speed interface before changing it:
| sudo mlnx_qos -i <interface> sudo cma_roce_tos -d <rdma-device> |
Example output before marking, abridged:
| DCBX mode: OS controlled Priority trust state: pcp PFC configuration: priority 0 1 2 3 4 5 6 7 enabled 0 0 0 0 0 0 0 0
cma_roce_tos: 0 |
mlnx_qos shows the DCBX mode, trust state, DSCP-to-priority mapping, receive-buffer allocation, and PFC state for the interface. cma_roce_tos shows the default ToS value used by RDMA-CM applications for the selected RDMA device. A value of 0 means no explicit ToS marking has been configured for that device.
To align the host with a fabric that expects DSCP trust, PFC on priority 3, and RoCE ToS 96, apply the marking to the intended RoCE interfaces and RDMA devices:
| sudo mlnx_qos -i <interface> --trust dscp sudo mlnx_qos -i <interface> --pfc 0,0,0,1,0,0,0,0 sudo cma_roce_tos -d <rdma-device> -t 96 |
For multiple rails, repeat the commands for each interface and RDMA device that belongs to the RoCE fabric:
| for i in ens10np0 ens32np0 enp41s0f0np0 enp41s0f1np1 ens12np0 ens11np0; do sudo mlnx_qos -i "$i" --trust dscp sudo mlnx_qos -i "$i" --pfc 0,0,0,1,0,0,0,0 done
for d in mlx5_0 mlx5_1 mlx5_2 mlx5_3 mlx5_4 mlx5_5; do sudo cma_roce_tos -d "$d" -t 96 done |
Verify the resulting host-side marking:
| sudo mlnx_qos -i ens10np0 | egrep 'DCBX mode|Priority trust state|dscp2prio|PFC configuration|priority|enabled' sudo cma_roce_tos -d mlx5_0 |
Example output, abridged:
| DCBX mode: OS controlled Priority trust state: dscp dscp2prio mapping: prio:3 dscp:31,30,29,28,27,26,25,24, PFC configuration: priority 0 1 2 3 4 5 6 7 enabled 0 0 0 1 0 0 0 0
cma_roce_tos: 96 |
The trust state tells the NIC whether to classify traffic based on DSCP or PCP. The dscp2prio map shows that DSCP 24 through 31 map to priority 3. The PFC row shows that priority 3 is enabled for lossless handling. The ToS value 96 corresponds to DSCP 24 shifted into the IP ToS field. These host settings must match the switch QoS policy; otherwise, packets can be marked one way by the server and classified differently by the fabric.
During traffic tests, use hardware counters to confirm that RDMA traffic and flow-control behavior are visible:
| cat /sys/class/infiniband/<rdma-device>/ports/1/counters/port_rcv_data cat /sys/class/infiniband/<rdma-device>/ports/1/counters/port_xmit_data cat /sys/class/infiniband/<rdma-device>/ports/1/counters/port_xmit_wait sudo ethtool -S <interface> | egrep 'rdma_unicast_bytes|prio3_pause|discard' |
port_rcv_data and port_xmit_data are low-level RDMA byte counters. They should move when RDMA traffic is active. port_xmit_wait is a congestion-related counter; sustained growth indicates that transmission is being delayed by flow-control issues or congestion,
The ethtool -S counters provide interface-level RDMA byte, pause, and discard visibility. Use these counters with switch-side PFC, ECN, and queue counters when validating a fabric.
9.8 Inspect Ethernet and InfiniBand NIC mode settings
Use mlxconfig to inspect the persistent adapter configuration before making any Ethernet or InfiniBand NIC mode changes. mlxconfig is installed with MFT, which was installed earlier in section 9.3 and may be upgraded as part of the DOCA-OFED workflow in section 9.5. The following command focuses on the fields most relevant to mode inspection:
| for dev in 0000:15:00.0 0000:29:00.0 0000:71:00.0 0000:9b:00.0 0000:eb:00.0; do echo "--- $dev" sudo mlxconfig -d "$dev" q | egrep 'Device type:|Name:|Device:|LINK_TYPE|ROCE_CONTROL|SRIOV_EN|NUM_OF_VFS|PF_BAR2' done |
Example output, abridged:
| --- 0000:15:00.0 Device type: ConnectX7 Name: MCX715105AS-WEAT_Ax Device: 0000:15:00.0 NUM_OF_VFS 8 PF_BAR2_ENABLE False(0) SRIOV_EN True(1) ROCE_CONTROL ROCE_ENABLE(2) LINK_TYPE_P1 ETH(2)
--- 0000:29:00.0 Device type: ConnectX7 Name: MCX755106AS-HEA_Ax Device: 0000:29:00.0 NUM_OF_VFS 16 PF_BAR2_ENABLE False(0) SRIOV_EN True(1) ROCE_CONTROL ROCE_ENABLE(2) LINK_TYPE_P1 ETH(2) LINK_TYPE_P2 ETH(2) |
LINK_TYPE_P1 and LINK_TYPE_P2 show whether each port is configured for Ethernet or InfiniBand. Single-port adapters expose only P1; dual-port adapters expose both P1 and P2. ROCE_CONTROL applies to RDMA over Converged Ethernet and is relevant when the port is in Ethernet mode. SRIOV_EN and NUM_OF_VFS show whether SR-IOV is enabled and how many virtual functions the adapter can expose per physical function. PF_BAR2_ENABLE and related BAR2 settings affect PCIe resource exposure for advanced virtualization and should be changed only when required by the deployment design.
Confirm the operating-system RDMA link layer view:
| ibstat | egrep "^CA '|Firmware version|State:|Physical state:|Link layer" |
Example output, abridged:
| CA 'mlx5_0' Firmware version: 28.47.1026 State: Active Physical state: LinkUp Link layer: Ethernet CA 'mlx5_2' Firmware version: 28.47.1026 State: Active Physical state: LinkUp Link layer: Ethernet |
Link layer: Ethernet confirms that the verbs device is currently operating in Ethernet/RoCE mode. State and Physical state report whether the RDMA port is operational. Evaluate these fields together with mlxlink, ethtool, the switch port, and the peer endpoint.
To inspect which mode-related parameters the adapter supports, use show_confs:
| sudo mlxconfig -d 0000:29:00.0 show_confs | egrep 'LINK_TYPE|INTERNAL_CPU|ECPF|DPU|ROCE_CONTROL|SRIOV_EN|NUM_OF_VFS' |
Example output, abridged:
| LINK_TYPE_P1=<ETH|IB> Select the link type for the port LINK_TYPE_P2=<ETH|IB> ROCE_CONTROL=<DEVICE_DEFAULT|ROCE_DISABLE|ROCE_ENABLE> SRIOV_EN=<False|True> Enable Single-Root I/O Virtualization NUM_OF_VFS=<NUM> Number of virtual functions per PF INTERNAL_CPU_MODEL=<EMBEDDED_CPU|SEPARATED_HOST> INTERNAL_CPU_ESWITCH_MANAGER=<ECPF|EXT_HOST_PF> |
This output is a capability view, not the current configuration. It tells you which keys the firmware and tool schema can describe for that adapter family. Some BlueField-oriented internal-CPU or ECPF keys can appear in a shared mlxconfig schema even when the installed adapter is a standard ConnectX NIC. Do not interpret schema visibility as proof that a ConnectX adapter supports DPU mode. Use the adapter part number, the current mlxconfig q output, and the NVIDIA platform documentation to decide which fields are applicable.
Changing Ethernet or InfiniBand mode is a maintenance-window task. The command syntax below shows how a port-mode change is staged; do not run it until the target mode and cabling design have been confirmed:
| # Example: stage Ethernet mode on both ports of a dual-port adapter sudo mlxconfig -d 0000:29:00.0 set LINK_TYPE_P1=ETH LINK_TYPE_P2=ETH
# Example: stage InfiniBand mode on both ports of a dual-port adapter sudo mlxconfig -d 0000:29:00.0 set LINK_TYPE_P1=IB LINK_TYPE_P2=IB |
After a mode change is staged, follow the reset or reboot requirement reported by mlxconfig, then verify the new state with mlxconfig q, ibstat, rdma link show, and mlxlink.
9.9 Understand BlueField NIC, DPU, and zero-trust modes
The preceding mode inspection and staged LINK_TYPE examples apply to ConnectX-7 NICs. BlueField operating modes are a different topic. NVIDIA BlueField devices include an embedded ARM Compute Subsystem and can operate in modes such as NIC mode, DPU mode, and zero-trust mode. NVIDIA documents DPU mode as embedded function ownership, where the embedded ARM subsystem controls NIC resources and the data path. NVIDIA BlueField platform documentation also lists BlueField-3 B3220 and B3140H-class adapters as devices with ARM subsystem cores and integrated BMCs.
In practical terms:
● On a ConnectX-7 NIC, use LINK_TYPE_P1 and LINK_TYPE_P2 to inspect or stage Ethernet versus InfiniBand port mode, and use fields such as ROCE_CONTROL, SRIOV_EN, and NUM_OF_VFS to inspect NIC behavior.
● On a BlueField DPU or SuperNIC, use the NVIDIA BlueField documentation for NIC mode, DPU mode, and zero-trust mode. Those modes describe ownership of the NIC resources by the embedded Arm subsystem and are outside the ConnectX-7 scope of this chapter.
● If mlxconfig show_confs displays internal-CPU or ECPF-related fields on a host with ConnectX adapters, treat that as schema visibility from shared tooling, not as proof that the installed ConnectX adapter can operate as a DPU.
For BlueField systems, validate the exact adapter SKU, PSID, installed BMC/Arm-side software, and NVIDIA-supported mode transition workflow before making mode changes. Those operations can affect host networking, embedded Arm services, RShim access, and reset behavior. The procedures in this chapter focus on ConnectX-7 NIC behavior and reference BlueField modes only to define the applicability boundary.
9.10 Check adapter configuration and link state
Before changing port mode or other adapter settings, you can also use the PCI address directly with other MFT utilities. This step assumes MFT and the DOCA-OFED tooling have already been installed. It is useful when MST device names are not available:
| sudo mlxconfig -d 0000:29:00.0 q sudo mlxlink -d 0000:29:00.0 -p 1 |
Example output, abridged:
| Device type: ConnectX7 Name: MCX755106AS-HEA_Ax Device: 0000:29:00.0
ROCE_CONTROL ROCE_ENABLE(2) SRIOV_EN True(1)
Operational Info State Disable Physical state ETH_AN_FSM_ENABLE Speed N/A Auto Negotiation ON Recommendation Cable is unplugged Firmware Version 28.47.1026 MFT Version 4.35.x |
10. Benchmarking and verification commands
Chapter 10 provides a final readiness checklist to confirm that the platform is ready for workload-level validation.
Use this section after completing the management, firmware, operating-system, GPU, and networking procedures earlier in the guide. The goal is not to create a formal benchmark report. The goal is to confirm that the server is healthy, the expected devices are visible, the software stack is aligned, and the basic compute and communication paths work before handing the system to users or starting application-level testing.
10.1 Verify operating system and platform baseline
Start with the installed OS, kernel, CPU, memory, storage, and platform identity:
| hostnamectl --static cat /etc/os-release | awk -F= '/^(PRETTY_NAME|VERSION_CODENAME)=/ {gsub(/"/,"",$2); print $1"="$2}' uname -r hostnamectl | awk '/Hardware Vendor|Hardware Model|Firmware Version/ {sub(/^[[:space:]]*/,""); print}' lscpu | egrep 'Model name|Socket|Core|Thread|CPU\\(s\\)|NUMA' free -h lsblk -o NAME,SIZE,TYPE,MOUNTPOINTS |
Example output, abridged:
| c845a-host PRETTY_NAME=Ubuntu 24.04 LTS VERSION_CODENAME=noble 6.8.0-110-generic
Hardware Vendor: Cisco Systems Inc Hardware Model: CAI-845A-M8 Firmware Version: 1.9.1
CPU: AMD EPYC 9375F, 2 sockets, 128 logical CPUs Memory: approximately 4 TiB Boot disk: local disk mounted at / |
This check confirms that the host is running the expected Ubuntu LTS release and kernel, that the platform identity is visible through SMBIOS, and that the expected CPU, memory, and boot storage are present. If the platform identity, memory capacity, CPU count, or boot device is unexpected, resolve that before debugging higher-level GPU or networking behavior.
10.2 Verify NUMA, IOMMU, GPU topology, and PCIe links
Validate the topology map that the operating system, GPU runtime, and communication libraries will use:
| numactl -H cat /proc/cmdline | tr ' ' '\n' | egrep 'iommu|amd_iommu|intel_iommu' || true sudo dmesg | egrep -i 'iommu|AMD-Vi|Intel-IOMMU' | head -n 20 nvidia-smi topo -m nvidia-smi --query-gpu=index,name,pci.bus_id,pcie.link.gen.current,pcie.link.gen.max,pcie.link.width.current,pcie.link.width.max --format=csv |
Example output, abridged:
| available: 2 nodes (0-1) node 0 cpus: 0-31,64-95 node 1 cpus: 32-63,96-127 node distances: 0: 10 32 1: 32 10
iommu: Default domain type: Translated
GPU0 to GPU1: NV6 GPU0 to NIC1: PIX GPU0 to NIC4: SYS
index, name, pci.bus_id, pcie.link.gen.current, pcie.link.gen.max, pcie.link.width.current, pcie.link.width.max 0, NVIDIA H200 NVL, 00000000:03:00.0, 5, 5, 16, 16 |
numactl -H shows CPU and memory locality. The IOMMU messages show the DMA translation mode selected by Linux. nvidia-smi topo -m shows GPU-to-GPU and GPU-to-NIC path classes such as NV#, PIX, NODE, and SYS. The PCIe query confirms the negotiated PCIe generation and link width for each GPU. A healthy result is one where the topology matches the deployment plan, GPUs negotiate the expected PCIe generation and width, and the IOMMU mode matches the security and performance policy selected for the deployment.
For PCIe devices beyond the GPUs, verify representative GPU and NIC bus IDs with lspci:
| for dev in <gpu-bus-id> <nic-bus-id>; do echo "--- $dev" sudo lspci -s "$dev" -vvv | egrep 'LnkCap:|LnkSta:' done |
Example output, abridged:
| --- 03:00.0 LnkCap: Speed 32GT/s, Width x16 LnkSta: Speed 32GT/s, Width x16 --- 29:00.0 LnkCap: Speed 32GT/s, Width x16 LnkSta: Speed 32GT/s, Width x16 |
LnkCap is the capability of the device and slot path. LnkSta is the negotiated state in use. If the active speed or width is lower than expected, investigate slot placement, riser seating, firmware, cabling, and platform logs before treating workload performance as an application problem.
10.3 Verify GPU driver, NVLink, and DCGM health
Confirm GPU driver visibility, NVLink status, and DCGM diagnostics:
| nvidia-smi nvidia-smi nvlink -s nvidia-smi topo -p2p n dcgmi discovery -l dcgmi diag -r 1 |
Example output, abridged:
| NVIDIA-SMI 580.x Driver Version: 580.x CUDA Version: 13.0 GPU Name Bus-Id 0 NVIDIA H200 NVL 00000000:03:00.0 1 NVIDIA H200 NVL 00000000:0B:00.0 2 NVIDIA H200 NVL 00000000:61:00.0 3 NVIDIA H200 NVL 00000000:69:00.0
GPU 0: NVIDIA H200 NVL Link 0: 26.562 GB/s ...
GPU0 to GPU1 NVLink P2P: OK
4 GPUs found (Active). Diagnostic Result: Pass |
nvidia-smi proves that the driver can enumerate the GPUs. nvidia-smi nvlink -s confirms per-link NVLink status where NVLink is present. nvidia-smi topo -p2p n confirms whether NVLink peer-to-peer communication is supported between GPU pairs. DCGM discovery and diagnostics confirm that the management and diagnostic stack can see the GPUs and complete basic health checks. Resolve missing GPUs, driver/library mismatches, failed DCGM diagnostics, or unexpected NVLink status before running application benchmarks.
10.4 Verify CUDA and NCCL execution
Run the CUDA compile/runtime sample from section 8.3 of this guide, then run the NCCL smoke and sustained tests from sections 8.5 and 8.6. These commands assume that the persistent validation directory from chapter 8, “GPU software stack installation and validation,” was used:
| /usr/local/cuda-13.0/bin/nvcc \ ~/c845a-validation/cuda-vector-add.cu \ -o ~/c845a-validation/cuda-vector-add ~/c845a-validation/cuda-vector-add ~/c845a-validation/nccl-tests/build/all_reduce_perf -b 8 -e 64M -f 2 -g 4 ~/c845a-validation/nccl-tests/build/sendrecv_perf -b 8 -e 64M -f 2 -g 4 START=$(date +%s) ~/c845a-validation/nccl-tests/build/all_reduce_perf \ -b 64M -e 64M -f 2 -g 4 -w 20 -n 165000 END=$(date +%s) echo "Elapsed seconds: $((END-START))" |
Example output, abridged:
| CUDA vector add completed on device 0; errors=0
all_reduce_perf: size algbw busbw #wrong 67108864 196.x 294.x 0 Out of bounds values : 0 OK
sendrecv_perf: size algbw busbw #wrong 67108864 113.x 113.x 0 Out of bounds values : 0 OK
sustained all_reduce_perf: Avg bus bandwidth : 294.x Elapsed seconds: 118 |
The CUDA sample proves that the compiler, headers, runtime, device allocation path, kernel launch path, and result validation are working. The NCCL smoke tests prove that NCCL can enumerate the selected GPUs, move data through the selected communication paths, and complete without data-validation errors. The sustained run adds a short stability check. Treat the bandwidth values as a baseline for this server and software configuration, not as a universal performance target.
10.5 Verify NIC firmware, RDMA devices, and link-layer state
Confirm the active NIC driver, firmware, RDMA mapping, and verbs visibility:
| for i in ens10np0 ens32np0 enp41s0f0np0 enp41s0f1np1 ens12np0 ens11np0; do printf '%-16s ' "$i" ethtool -i "$i" 2>/dev/null | awk -F': ' '/driver|version|firmware-version|bus-info/{print $1 "=" $2}' | paste -sd' ' - done rdma link show ibdev2netdev ibv_devices ibstat | egrep "^CA '|Firmware version|State:|Physical state:|Rate:|Link layer" |
Example output, abridged:
| ens10np0 driver=mlx5_core version=26.01-1.0.0 firmware-version=28.47.1026 bus-info=0000:71:00.0 enp41s0f0np0 driver=mlx5_core version=26.01-1.0.0 firmware-version=28.47.1026 bus-info=0000:29:00.0
link mlx5_0/1 state <state> physical_state <physical-state> netdev ens10np0 mlx5_0 port 1 ==> ens10np0 (<state>)
device mlx5_0 mlx5_1 mlx5_2
CA 'mlx5_0' Firmware version: 28.47.1026 Link layer: Ethernet |
The ethtool -i output connects Linux interface names to driver versions, firmware versions, and PCI addresses. rdma link show and ibdev2netdev map RDMA device names to network interfaces. ibv_devices confirms that verbs devices are available to RDMA applications. ibstat shows firmware, link state, rate, and link layer.
Links state should match expectations from deployment's cabling and switch-port design.
10.6 Verify RoCE marking and fabric counters
For RoCEv2 fabrics, confirm that the host marking matches the fabric QoS policy:
| sudo mlnx_qos -i <interface> | egrep 'DCBX mode|Priority trust state|dscp2prio|PFC configuration|priority|enabled' sudo cma_roce_tos -d <rdma-device> cat /sys/class/infiniband/<rdma-device>/ports/1/counters/port_rcv_data cat /sys/class/infiniband/<rdma-device>/ports/1/counters/port_xmit_data cat /sys/class/infiniband/<rdma-device>/ports/1/counters/port_xmit_wait sudo ethtool -S <interface> | egrep 'rdma_unicast_bytes|prio3_pause|discard' |
Example output, abridged:
| DCBX mode: OS controlled Priority trust state: dscp dscp2prio mapping: prio:3 dscp:31,30,29,28,27,26,25,24, PFC configuration: priority 0 1 2 3 4 5 6 7 enabled 0 0 0 1 0 0 0 0
cma_roce_tos: 96 port_rcv_data: <counter> port_xmit_data: <counter> port_xmit_wait: <counter> rx_vport_rdma_unicast_bytes: <counter> tx_vport_rdma_unicast_bytes: <counter> rx_prio3_pause: <counter> tx_prio3_pause: <counter> |
The mlnx_qos output confirms whether the NIC trusts DSCP and whether PFC is enabled on the intended priority. The cma_roce_tos output confirms the ToS value used by RDMA-CM applications. The RDMA and ethtool counters show whether RDMA traffic, pauses, waits, or discards are occurring. During an RDMA or NCCL traffic test, transmit and receive byte counters should move. Sustained growth in pause, wait, or discard counters should be investigated with switch-side queue, PFC, and ECN counters.
10.7 Cross-check out-of-band inventory
Use the Redfish session method from chapter 3, “Out-of-band management validation,” to cross-check the BMC view of the system, BMC firmware, secure-boot state, adapter inventory, and firmware inventory:
| redfish_get /redfish/v1/Systems/system | jq -r ' "Model: \(.Model)", "PowerState: \(.PowerState)", "BiosVersion: \(.BiosVersion)", "Status: Health \(.Status.Health), State \(.Status.State)" '
redfish_get /redfish/v1/Systems/system/SecureBoot | jq -r ' "SecureBootEnable: \(.SecureBootEnable)" '
redfish_get /redfish/v1/Chassis/chassis/NetworkAdapters | \ jq -r '.Members[]."@odata.id"' | \ while read adapter_uri; do redfish_get "$adapter_uri" | jq -r '[.Id, .Name, .Model, .Status.Health] | @tsv' done |
Example output, abridged:
| Model: CAI-845A-M8 PowerState: On BiosVersion: 1.9.1 Status: Health OK, State Enabled
SecureBootEnable: false
FHHL_9 NVIDIA OEM ConnectX-7 adapter CAI-P-N7S400GFO OK FHHL_10 NVIDIA OEM ConnectX-7 adapter CAI-P-N7D200GFO OK OCP_NIC Cisco 2x10 GbE OCP NIC CAI-O-ID10GC OK |
This final out-of-band check confirms that the BMC inventory agrees with the host-side view. Differences between BMC, Cisco Intersight, and host-side inventory can point to firmware inventory lag, device initialization issues, driver gaps, or cabling and slot-mapping mistakes.
At the end of validation, record the command outputs, software versions, firmware versions, and any deviations from the intended design. These artifacts become the starting point for support escalation or later performance tuning.
11. Escalation artifact checklist
Chapter 11 identifies the host, firmware, driver, Intersight, and log artifacts that are useful for Cisco support or engineering escalation.
11.1 Record software, firmware, and workflow artifacts
When collecting artifacts for Cisco support or engineering escalation, include the exact Cisco software images used during bring-up. At a minimum, record the UCS Server Firmware image, UCS Server Configuration Utility image, UCS Drivers image if used, and UCS Diagnostics image if a diagnostic run was performed. Include the image names, release versions, checksums if available, and the Cisco Software Central location used to obtain them.
For host-side software, record the source and version of each major component. Include the operating system release and kernel, NVIDIA driver branch, CUDA toolkit version, NCCL package version, DCGM version, NIC/DPU driver and firmware versions, and whether each component was installed from Cisco media, operating-system repositories, NVIDIA repositories, or another approved repository.
Capture the following items before changing firmware, reinstalling drivers, or rerunning destructive tests:
● Cisco Intersight request details for firmware update, OS installation, or other failed workflows.
● BMC firmware, BIOS, adapter firmware, GPU firmware, and storage firmware inventory.
● Host operating-system release, kernel version, driver versions, and package source repositories.
● GPU validation output from nvidia-smi, dcgmi, CUDA sample compilation, and NCCL tests.
● Networking validation output from lspci, ethtool -i, mlxfwmanager, mlxconfig, rdma link show, ibv_devices, ibstat, mlnx_qos, and fabric counters where applicable.
● Relevant system logs such as journalctl -b, dmesg, package installation logs, and application test logs.
The goal is to capture a time-aligned picture of the platform before the state changes. When a test is rerun after a change, save the new output separately and include the time, change performed, and result.
11.2 Export the BMC technical support bundle with Redfish
The BMC can export a technical support bundle through a Redfish OEM action. Use this when Cisco support asks for a BMC technical support bundle, or when you want to preserve a management-controller snapshot before performing additional recovery steps.A
Start from the authenticated Redfish session method defined in chapter 3, “Out-of-band management validation.”
Confirm that the export action is present:
| redfish_get /redfish/v1/Managers/bmc | jq '.Actions.Oem' |
Example output, abridged:
| { "#CiscoUCSExtensions.BmcTechSupportExport": { "@Redfish.ActionInfo": "/redfish/v1/Managers/bmc/Oem/BmcTechSupportExportActionInfo", "@odata.type": "#CiscoUCSExtensions.v1_0_0.ExportTechSupport", "target": "/redfish/v1/Managers/bmc/Actions/Oem/CiscoUCSExtensions.BmcTechSupportExport" } } |
The target field is the Redfish URI that starts the export. The @Redfish.ActionInfo field points to the metadata that describes the required request parameters.
Display the action metadata:
| redfish_get /redfish/v1/Managers/bmc/Oem/BmcTechSupportExportActionInfo | \ jq '.Parameters' |
Example output, abridged:
| [ { "Name": "Protocol", "Required": true, "AllowableValues": ["TFTP", "FTP", "SCP", "SFTP", "HTTP"] }, { "Name": "RemoteHostname", "Required": true }, { "Name": "RemotePath", "Required": true }, { "Name": "RemoteUsername", "Required": false }, { "Name": "RemotePassword", "Required": false } ] |
The BMC writes the bundle to a remote server. Protocol selects the transfer method, RemoteHostname is the remote file server, and RemotePath is the destination path and filename. Use a filename ending in .tgz or .tar.gz. RemoteUsername and RemotePassword are used for protocols that require authentication, such as SCP or SFTP.
Prepare the export request. The following example uses SCP:
| export TECHSUPPORT_PROTOCOL="SCP" export TECHSUPPORT_REMOTE_HOST="<remote-file-server>" export TECHSUPPORT_REMOTE_PATH="/upload/c845a-bmc-techsupport-$(date +%Y%m%d-%H%M%S).tar.gz" export TECHSUPPORT_REMOTE_USER="<remote-user>" read -rsp "Remote server password: " TECHSUPPORT_REMOTE_PASSWORD; echo
TECHSUPPORT_BODY=$(mktemp)
jq -n \ --arg protocol "$TECHSUPPORT_PROTOCOL" \ --arg host "$TECHSUPPORT_REMOTE_HOST" \ --arg path "$TECHSUPPORT_REMOTE_PATH" \ --arg user "$TECHSUPPORT_REMOTE_USER" \ --arg password "$TECHSUPPORT_REMOTE_PASSWORD" \ '{ Protocol: $protocol, RemoteHostname: $host, RemotePath: $path } + (if $user == "" then {} else {RemoteUsername: $user} end) + (if $password == "" then {} else {RemotePassword: $password} end)' \ > "$TECHSUPPORT_BODY" |
Start the export:
| curl -sk --connect-timeout 10 --max-time 60 \ -H "X-Auth-Token: $REDFISH_TOKEN" \ -H "Content-Type: application/json" \ -X POST \ "$BMC_HOST/redfish/v1/Managers/bmc/Actions/Oem/CiscoUCSExtensions.BmcTechSupportExport" \ -d @"$TECHSUPPORT_BODY" | jq .
rm -f "$TECHSUPPORT_BODY" unset TECHSUPPORT_REMOTE_PASSWORD |
Example output:
| { "Result": "Success." } |
After the command completes, verify that the .tgz or .tar.gz file exists on the remote server and record the filename with the support case artifacts. If the export fails, check the remote server path, protocol, credentials, firewall rules, and available space, then repeat the export after correcting the transfer problem.
11.3 Collect the BMC technical support bundle from the BMC web UI
The BMC web interface provides an interactive alternative to the Redfish export workflow when an administrator is working from a browser. Log in to the BMC web interface with the site-specific BMC address and credentials, then go to Administration > Utilities. Use the Export Technical Support Logs area for support-log collection. The factory-reset and BMC-reboot controls on the same page are separate operations and are not required for collecting logs.
Choose one of the following collection methods:
● Download Logs: Collect the bundle and download it through the browser. If a collected bundle is not already present, the BMC prompts you to initiate a new collection. Click Confirm and keep the browser session open until the archive is generated and downloaded.
● Export Logs: Write the bundle to a remote file server. Enter the external server address, destination path, and transfer protocol supported by the environment, such as TFTP, SFTP, FTP, SCP, or HTTP. Use an authenticated and encrypted protocol where available.
After the bundle is collected, save the archive with the support case artifacts. Record the collection time, server identifier, BMC firmware version, and a short description of the issue being investigated. Treat the archive as sensitive operational data because it can include platform inventory, event history, configuration context, and diagnostic logs.