UCS M6 Rack Server NVMe Disk I/O Whitepaper
Available Languages
Bias-Free Language
The documentation set for this product strives to use bias-free language. For the purposes of this documentation set, bias-free is defined as language that does not imply discrimination based on age, disability, gender, racial identity, ethnic identity, sexual orientation, socioeconomic status, and intersectionality. Exceptions may be present in the documentation due to language that is hardcoded in the user interfaces of the product software, language used based on RFP documentation, or language that is used by a referenced third-party product. Learn more about how Cisco is using Inclusive Language.
The Cisco UCS® C240 M6 Rack Server is well-suited for a wide range of storage and I/O-intensive applications such as big data analytics, databases, virtualization, and high-performance computing in its 2-socket, 2-rack-unit (2RU) form factor.
The Cisco UCS C240 M6 server extends the capabilities of the Cisco Unified Computing System™ (Cisco UCS) rack server portfolio with third-generation (3rd Gen) Intel® Xeon® Scalable processors supporting more than 43 percent more cores per socket and 33 percent more memory when compared with the previous generation. This server provides up to 40 percent more performance than the M5 generation for your most demanding applications.
You can deploy the Cisco UCS C-Series Rack Servers as standalone servers or as the part of Cisco UCS managed by Cisco Intersight™ technology, Cisco UCS Manager, or Intersight Managed Mode to take advantage of Cisco® standards-based unified computing innovations that can help reduce your total cost of ownership (TCO) and increase your business agility.
These improvements deliver significant performance and efficiency gains that will improve your application performance. The Cisco UCS C240 M6 Rack Server delivers outstanding levels of expandability and performance.
This document summarizes the Non-Volatile Memory Express (NVMe) I/O performance characteristics of the Cisco UCS C220 M6 and C240 M6 Rack Servers using NVMe solid-state disks (SSDs). Performance data for the M6 servers with the supported number of NVMe SSDs is presented. The goal of this document is to help customers make well-informed decisions so that they can choose the right platform with supported NVMe drives to meet their I/O workload needs.
Performance data was obtained using the Fio measurement tool, with analysis based on the number of I/O operations per second (IOPS) for random I/O workloads and megabytes-per-second (MBps) throughput for sequential I/O workloads. From this analysis, specific recommendations are made for storage configuration parameters.
The widespread adoption of virtualization and data center consolidation technologies has profoundly affected the efficiency of the data center. Virtualization brings new challenges for the storage technology, requiring the multiplexing of distinct I/O workloads across a single I/O “pipe”. From a storage perspective, this approach results in a sharp increase in random IOPS. For spinning-media disks, random I/O operations are the most difficult to handle, requiring costly seek operations and rotations between microsecond transfers. Not only do the hard disks add a security factor, but they also constitute the critical performance components in the server environment. Therefore, it is important that data centers bundle the performance of these components through intelligent technology so that they do not cause a system bottleneck and so that they will compensate for any failure of an individual component. RAID technology offers a solution by arranging several hard disks in an array so that any disk failure can be accommodated.
According to conventional wisdom, data center I/O workloads are either random (many concurrent accesses to relatively small blocks of data) or sequential (a modest number of large sequential data transfers). Historically, random access has been associated with a transactional workload, which is the most common type of workload for an enterprise. Currently, data centers are dominated by random and sequential workloads resulting from the scale-out architecture requirements in the data center.
NVMe storage solutions offer the following main benefits:
● Reduced TCO: NVMe storage can be used to eliminate the need for SANs and network-attached storage (NAS) or to augment existing shared-array infrastructure. With significant performance improvements available in both cases, Cisco customers can reduce the amount of physical infrastructure they need to deploy, increase the number of virtual machines they can place on a single physical server, and improve overall system efficiency. These improvements provide savings in capital expenditures (CapEx) and operating expenses (OpEx), including reduced application licensing fees and savings related to space, cooling, and energy use.
● Strategic partnerships: Cisco tests a broad set of NVMe storage technologies and focuses on major vendors. With each partnership, devices are built exclusively in conjunction with Cisco engineering, so customers have the flexibility of a variety of endurance and capacity levels and the most relevant form factors, as well as the powerful management features and robust quality benefits that are unique to Cisco.
The rise of technologies such as virtualization, cloud computing, and data consolidation poses new challenges for the data center and requires enhanced I/O requests. These enhanced requests lead to increased I/O performance requirements. They also require that data centers fully use available resources so that they can support the newest requirements of the data center and reduce the performance gap observed industrywide.
The following are the major factors leading to an I/O crisis:
● Increasing CPU use and I/O operations: Multicore processors with virtualized server and desktop architectures increase processor use, thereby increasing the I/O demand per server. In a virtualized data center, it is the I/O performance that limits the server consolidation ratio, not the CPU or memory size.
● Randomization: Virtualization has the effect of multiplexing multiple logical workloads across a single physical I/O path. The greater the degree of virtualization achieved, the more random the physical I/O requests.
● For the NVMe I/O performance characterization tests, performance was evaluated using Intel D7 P5600 NVMe SSDs for random and sequential access patterns for Cisco UCS C220 M6N, C240 M6SX, C240 M6N, and C240 M6SN servers.
● The Cisco UCS C220 M6N and C240 M6N servers are NVMe servers in which all drives are connected to PCIe x4 lanes and managed by the CPU.
● The Cisco C240 M6SX server supports four front and four rear NVMe SSDs, and all drives use PCIe x4 lanes and are managed by the CPU.
● The Cisco C240 M6SN server supports up to 24 NVMe drives on front slots and is managed by three M-switches. Each M-switch can handle 8 NVMe drives.
Note: The Intel Virtual RAID on CPU (VROC) configuration was not tested and is not discussed in this document.
The tested solution used these components:
● Cisco UCS C220 M6N with 10 x 6.4 TB NVMe SSDs
● Cisco UCS C240 M6SX with 8 x 6.4 TB NVMe SSDs
● Cisco UCS C240 M6N with 14 x 6.4 TB NVMe SSDs
● Cisco UCS C240 M6SN with 24 x 1.6 TB NVMe SSDs
Cisco UCS C220 M6 and C240 M6 Rack Server overview
See the following data sheets for more information about the C220 M6 and C240 M6 servers:
The server specifications are as follows for all tested servers:
● Cisco UCS C220 M6 and C240 M6 Rack Servers
● CPU: Two Intel Xeon Gold 6330 processors
● Memory: Sixteen 16 GB (256 GB) 3200 MHz DDR4
● Cisco LAN-on-motherboard (LOM) X550-TX 10 Gigabit LOM
● 1.6 TB 2.5 inch U.2 Intel P5600 NVMe high-performance medium-endurance drive
(UCS-NVMEI4-I1600)
● 6.4 TB 2.5 inch U.2 Intel P5600 NVMe high-performance medium-endurance drive
(UCS-NVMEI4-I6400)
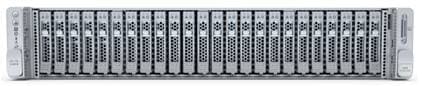
Cisco UCS C220 M6 server models
The Cisco UCS C220 M6 server (Figure 1) extends the capabilities of the Cisco UCS portfolio in a 1RU form factor with the addition of the 3rd Gen Intel Xeon Scalable processors (Ice Lake) and 16 dual-inline-memory-module (DIMM) slots per CPU for 3200-MHz double-data-rate 4 (DDR4) DIMMs with DIMM capacity points of up to 128 GB. The maximum memory capacity for two CPUs is either of the following:
● 4 TB (32 x 128 GB DDR4 DIMMs)
● 10 TB (16 x 128 GB DDR4 DIMMs and 16 x 512 GB Intel Optane Persistent Memory [PMem] Modules)
You can choose among several options:
Front drives:
● Up to 10 SAS/SATA and NVMe drives (up to 4 of the drives can be NVMe)
● Up to 10 NVMe drives (all drives are NVMe)
Rear PCIe risers
● One to three half-height PCIe risers
● One to two full-height PCIe risers
The server provides an internal slot for one of the following:
● SATA interposer to control SATA drives from the Intel Platform Controller Hub (PCH) Advanced Host Controller Interface (AHCI)
● Cisco 12 Gbps RAID controller with cache backup to control SAS/SATA drives
● Cisco 12 Gbps SAS pass-through host bus adapter (HBA) to control SAS/SATA drives
![]()
![]()
Front and rear view of Cisco UCS C220 M6 server
For information about configuring a specific model of C220 M6 server, refer to the appropriate specification sheet: https://www.cisco.com/c/dam/en/us/products/collateral/servers-unified-computing/ucs-c-series-rack-servers/c220m6-sff-specsheet.pdf
The performance testing described in this document uses the Cisco UCS C220 M6N server, which supports 10 small-form-factor (SFF) NVMe SSDs.
Cisco UCS C240 M6 server models
The Cisco UCS C240 M6 SFF server (Figure 2) extends the capabilities of the Cisco UCS portfolio in a 2RU form factor with the addition of the 3rd Gen Intel Xeon Scalable processors (Ice Lake) and 16 DIMM slots per CPU for 3200-MHz DDR4 DIMMs, with DIMM capacity points of up to 256 GB. The maximum memory capacity for two CPUs is either of the following:
● 8 TB (32 x 256 GB DDR4 DIMMs)
● 12 TB (16 x 256 GB DDR4 DIMMs and 16 x 512 GB Intel Optane PMem Modules)
You can choose among several options:
Option 1:
● Up to 12 front SFF SAS/SATA hard-disk drives (HDDs) or SSDs (optionally, up to 4 of the drives can be NVMe)
● I/O-centric option, which provides up to 8 PCIe slots using all three rear risers
● Storage-centric option, which provides 6 PCIe slots and one rear riser with a total of up to 2 SFF drives (SAS/SATA or NVMe with 4 PCIe Gen 4 slots)
● Optional optical drive
Option 2:
● Up to 24 front SFF SAS/SATA HDDs or SSDs (optionally, up to 4 of the slots can be NVMe)
● I/O-centric option, which provides up to 8 PCIe slots using all three rear risers
● Storage-centric option, which provides 3 PCIe slots using slots in one of the rear risers and two rear risers with a total of up to 4 SFF drives (SAS/SATA or NVMe with 4 PCIe Gen 4 slots)
Option 3:
● Up to 12 front SFF NVMe-only drives
● I/O-centric option, which provides up to 6 PCIe slots using two rear risers
● Storage-centric option, which provides 3 PCIe slots using slots in one of the rear risers and up to 2 SFF drives (NVMe with 4 PCIe Gen 4 slots) using one of the rear risers
Option 4:
● Up to 24 front NVMe-only drives
● I/O-centric option, which provides up to 6 PCIe slots using two rear risers
● Storage-centric option, which provides 3 PCIe slots using slots in one of the rear risers and up to 2 SFF drives using one of the rear risers
The server provides one or two internal slots (depending on the server type) for one of the following:
● One slot for a SATA interposer to control up to 8 SATA-only drives from the PCH (AHCI)
● One slot for a Cisco 12 Gbps RAID controller with cache backup to control up to 28 SAS/SATA drives
● Two slots for Cisco 12 Gbps SAS pass-through HBAs; each HBA controls up to 16 SAS/SATA drives
● A mix of 24 SAS/SATA and NVMe front drives (up to 4 NVMe front drives) and optionally 4 SAS/SATA and NVMe rear drives
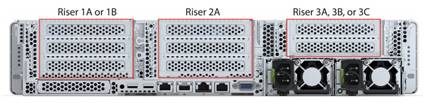
Front and rear view of Cisco UCS C240 M6 server
A specifications sheet for the C240 M6 is available at https://www.cisco.com/c/dam/en/us/products/collateral/servers-unified-computing/ucs-c-series-rack-servers/c240m6-sff-specsheet.pdf.
This section provides an overview of the specific access patterns used in the performance tests.
Table 1 lists the workload types tested.
Table 1. Workload types
| Workload type |
RAID type |
Access pattern type |
Read:write (%) |
| Online transaction processing (OLTP) |
5 |
Random |
70:30 |
| Decision-support system (DSS), business intelligence, and video on demand (VoD) |
5 |
Sequential |
100:0 |
| Database logging |
10 |
Sequential |
0:100 |
| High-performance computing (HPC) |
5 |
Random and sequential |
50:50 |
| Digital video surveillance |
10 |
Sequential |
10:90 |
| Big data: Hadoop |
0 |
Sequential |
90:10 |
| Apache Cassandra |
0 |
Sequential |
60:40 |
| Virtual desktop infrastructure (VDI): Boot process |
5 |
Random |
80:20 |
| VDI: Steady state |
5 |
Random |
20:80 |
Tables 2 and 3 list the I/O mix ratios chosen for the sequential-access and random-access patterns, respectively.
Table 2. I/O mix ratio for sequential access pattern
| I/O mode |
I/O mix ratio (read:write) |
|
| Sequential |
100:0 |
0:100 |
Table 3. I/O mix ratio for random access pattern
| I/O mode |
I/O mix ratio (read:write) |
|
| Random |
100:0 |
0:100 |
The test configuration was as follows:
● Ten NVMe SFF SSDs on C220 M6N server (all front-facing NVMe PCIe SSDs)
● Eight NVMe SFF SSDs on C240 M6SX server (four front-facing and four rear-facing SFF NVMe PCIe SSDs)
● Fourteen NVMe SFF SSDs on C240 M6N server (12 front-facing and 2 rear-facing SFF NVMe PCIe SSDs)
● Twenty-four NVMe SFF SSDs on C240 M6SN server (24 front-facing SFF NVMe PCIe SSDs managed by three M-switches)
● Random workload tests were performed using 4 and 8 KB block sizes for all NVMe SSDs
● Sequential workload tests were performed using a 256 KB and 1 MB block sizes for all NVMe SSDs
Table 4 lists the recommended Fio settings.
Table 4. Recommended Fio settings
| Name |
Value |
| Fio version |
Fio-3.19 |
| File name |
Device name on which Fio tests should run |
| Direct |
For direct I/O, page cache is bypassed |
| Type of test |
Random I/O or sequential I/O, read, write, or mix of read and write |
| Block size |
I/O block size: 4, 8, or 256 KB or 1 MB |
| I/O engine |
Fio engine: libaio |
| I/O depth |
Number of outstanding I/O instances |
| Number of jobs |
Number of parallel threads to be run |
| Run time |
Test run time |
| Name |
Name for the test |
| Ramp-up time |
Ramp-up time before the test starts |
| Time based |
To limit the run time of the test |
Note: The NVMe SSDs were tested with various combinations of outstanding I/O and numbers of jobs to get the best performance within an acceptable response time.
Performance data was obtained using the Fio measurement tool, with analysis based on the IOPS rate for random I/O workloads and on MBps throughput for sequential I/O workloads. From this analysis, specific recommendations can be made for storage configuration parameters.
The server specifications and BIOS settings used in these performance characterization tests are detailed in the appendix, Test environment.
The I/O performance test results capture the maximum read IOPS rate and bandwidth achieved with the NVMe SSDs within the best possible response time (latency) measured in microseconds.
NVMe drives on Cisco UCS M6 rack servers are directly managed by CPU and x4 PCIe lanes, except on the Cisco UCS C240 M6SN. The C240 M6SN is configured with three M-switches for managing 24 NVMe disks (on the front), and each M-switch can manage up to eight NVMe disks. The results showed that each of these M-switches can scale to up to 3 million IOPS for random I/O when drives connected to a single M-switch are tested. This 3-million IOPS performance can be achieved with 3 to 8 NVMe disks based on the performance of each disk.
However, for the purposes of the tests reported in this document, the server is configured with Intel P5600 1.6 TB NVMe disks, and each M-switch is populated with 8 disks, with a total of 24 disks across three M-switches. This configuration achieved the best possible performance from each M-switch (more details are provided in the following sections). Alternatively, had the tests used high-performance drives for, for instance, drives with 1 million random-read IOPS per disk, the expected maximum performance of 8 drives connected to a single M-switch would be 3 million (instead of 8 million IOPS), and a configuration with 24 drives and three M-switches would be limited to 8.5 to 9 million IOPS. In other words, 9 such drives can reach the IOPS maximum of the 24 front slots, with the other 15 drives (24 – 9 = 15) only augmenting storage capacity.
Also, note that these NVMe drives used Gen 4 PCIe to connect to the CPU (both through an M-switch and without an M-switch), and hence high-I/O operations can consume significant CPU cycles, unlike regular SSDs, which typically are managed by storage adapters (RAID and HBA cards).
These factors need to be considered when setting performance expectations from NVMe drives for this configuration.
NVMe performance on Cisco UCS C220 M6N with 10-disk configuration
Figure 3 shows the performance with 10 NVMe SSDs (6.4 TB Intel P5600 NVMe high-performance medium-endurance drive) in the front slots for 100 percent random read and write operations with a 70:30 percent random read and write access pattern. The graph shows the comparative performance achieved for NVMe SSDs to help customers understand the performance. The graph shows that the 6.4 TB high-performance medium-endurance NVMe drive provides performance of 9.9 million IOPS with latency of 280 microseconds for random read operations, 2.7 million IOPS with latency of 190 microseconds for random write operations, and 5.3 million IOPS with latency of 290 microseconds for random read and write operations with a 70:30 percent access pattern with a 4 KB block size. Latency is the time taken to complete a single I/O request from the viewpoint of the application.
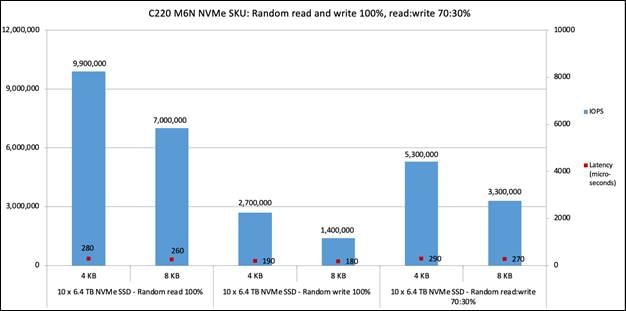
Cisco UCS C220 M6N 100 percent random read and write with 70:30 percent read:write
Figure 4 shows the performance with 10 NVMe SSDs for a 100 percent sequential read and sequential write access pattern. The graph shows the comparative performance values achieved for NVMe SSDs to help customers understand the performance. The graph shows that the 6.4 TB high performance medium-endurance NVMe drive provides performance of 70,000 MBps with latency of 730 microseconds for sequential read operations and 43,000 MBps with latency of 240 microseconds for sequential write operations with a 256 KB block size. Performance is similar for a 1 MB block size with a slight increase in latency.
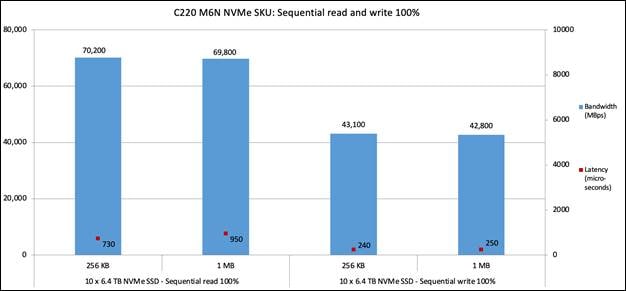
Cisco UCS C220 M6N 100 percent sequential read and write
NVMe performance on Cisco UCS C240 M6SX with 8-disk configuration
Figure 5 shows the performance with eight NVMe SSDs (6.4 TB Intel P5600 NVMe high-performance medium-endurance drive), with four in the front slots and four in the rear slots, for 100 percent random read and write operations with a 70:30 percent random read and write access pattern. The graph shows that eight of 6.4 TB NVMe drives provide performance of 7.9 million IOPS with latency of 290 microseconds for random read operations, performance of 2.1 million IOPS with latency of 200 microseconds for random write operations, and performance of 4.2 million IOPS with latency of 300 microseconds for random read and write operations with a 70:30 percent read and write pattern with a 4 KB block size.
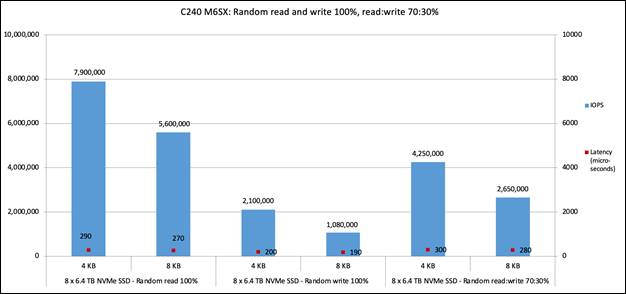
Cisco UCS C240 M6SX 100 percent random read and write with 70:30 percent read:write
Figure 6 shows the performance with eight NVMe SSDs for a 100 percent sequential read and write access pattern. The graph shows that the 6.4 TB high-performance medium-endurance NVMe drive provides performance of 56,000 MBps with latency of 730 microseconds for sequential read operations and 34,000 MBps with latency of 300 microseconds for sequential write operations with a 256 KB block size. Performance is similar for a 1 MB block size.
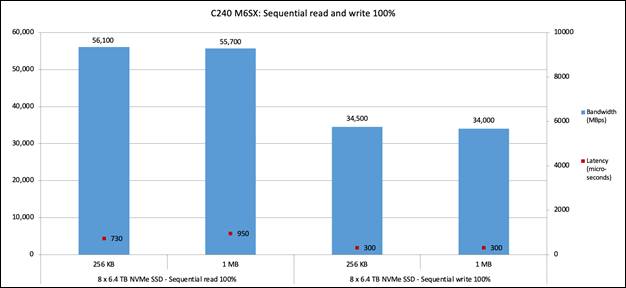
Cisco UCS C240 M6SX 100 percent sequential read and write
Note: This C240 M6SX server has an additional 20 slots in the front panel that can accommodate SAS/SATA SFF SSDs (managed by a storage adapter), and overall server performance will be the sum of the performance of 20 SAS/SATA SSDs and 8 NVMe SSDs.
NVMe performance on Cisco UCS C240 M6N with 14-disk configuration
Figure 7 shows the performance with 14 NVMe SSDs (6.4 TB Intel P5600 NVMe high-performance medium-endurance drive), with 12 in the front slots and 2 in the rear slots, for 100 percent random read and write operations with a 70:30 percent random read and write access pattern. The graph shows that 14 of the 6.4 TB NVMe drives provide performance of 13.8 million IOPS with latency of 280 microseconds for random read operations, 3.7 million IOPS with latency of 190 microseconds for random write operations, and 7.4 million IOPS with latency of 280 microseconds for a 70:30 percent random read and write pattern with a 4 KB block size.
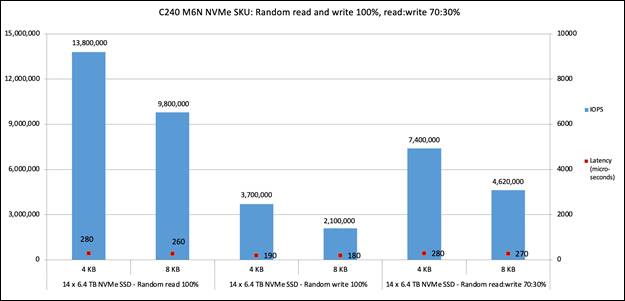
Cisco UCS C240 M6N 100 percent random read and write with 70:30 percent read:write
Figure 8 shows the performance with eight NVMe SSDs for a 100-percent sequential read and sequential write access pattern. The graph shows that the 6.4 TB high-performance medium-endurance NVMe drive provides performance of 97,000 MBps with latency of 730 microseconds for sequential read operations and 60,000 MBps with latency of 240 microseconds for sequential write operations with a 256 KB block size. Performance is similar for a 1 MB block size.
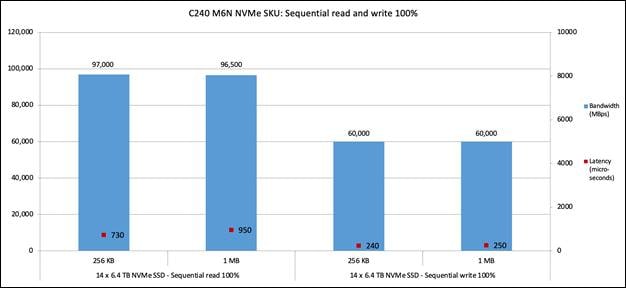
Cisco UCS C240 M6N 100 percent sequential read and write
NVMe performance on Cisco UCS C240 M6SN with 24-disk configuration
Figure 9 shows the performance with 24 NVMe SSDs (1.6 TB Intel P5600 NVMe high-performance medium-endurance drive), with 24 in the front slots for 100 percent random read and write operations with a 70:30 percent random read and write access pattern. These 24 NVMe drives are managed by three M-switches. The graph shows that all 24 of the 1.6 TB NVMe drives provide performance of 8.6 million IOPS with latency of 340 microseconds for random read operations, 2.9 million IOPS with latency of 280 microseconds for random write operations, and 5.7 million IOPS with latency of 320 microseconds for a 70:30 percent random read and write pattern with a 4 KB block size.
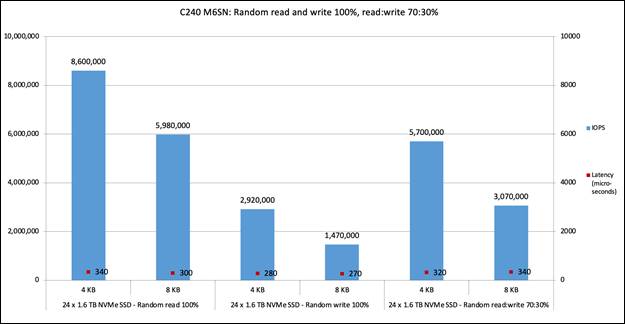
Cisco UCS C240 M6SN 100 percent random read and write with 70:30 percent read:write
Figure 10 shows the performance of 24 NVMe SSDs for a 100 percent sequential read and write access pattern. The graph shows that the 1.6 TB high-performance medium-endurance NVMe drive provides performance of 81,000 MBps with latency of 930 microseconds for sequential read operations and 41,000 MBps with latency of 430 microseconds for sequential write operations with a 256 KB block size. Performance is similar for a 1 MB block size.
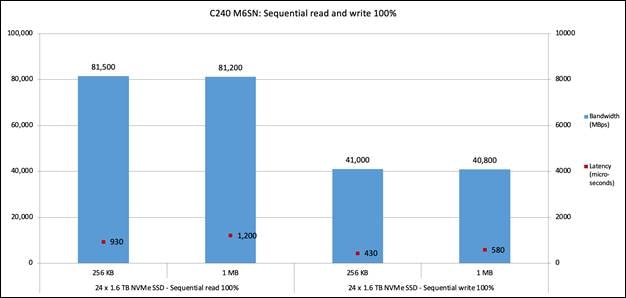
Cisco UCS C240 M6SN 100 percent sequential read and write
For additional information, see:
Table 5 lists the details of the server under test.
Table 5. Server properties
| Name |
Value |
| Product names |
Cisco UCS C220 M6 and C240 M6 |
| CPUs |
CPU: Two 2.00-GHz Intel Xeon Gold 6330 processors |
| Number of cores |
28 |
| Number of threads |
56 |
| Total memory |
512 GB |
| Memory DIMMs (16) |
32 GB x 16 DIMMs |
| Memory speed |
3200 MHz |
| Network controller |
Cisco LOM X550-TX; Two 10-Gbps interfaces |
| Virtual interface card (VIC) adapter |
Cisco UCS VIC 1477 modular LOM (mLOM) 40/100 Gbps Enhanced Small Form-Factor Pluggable (SFP+) |
| SFF NVMe SSDs |
● 1.6 TB 2.5-inch Intel P5600 NVMe high-performance medium-endurance (UCSC-NVMEI4-I1600)
(1.6 TB drive specifications)
● 6.4 TB 2.5-inch Intel P5600 NVMe high-performance medium-endurance (UCSC-NVMEI4-I6400)
(6.4 TB drive specification)
|
Table 6 lists the recommended server BIOS settings for a standalone Cisco UCS C-Series Rack Server for NVMe performance tests.
Table 6. BIOS settings for standalone rack server
| Name |
Value |
| BIOS version |
Release 4.2.1g |
| Cisco Integrated Management Controller (IMC) version |
Release 4.2(1f) |
| Cores enabled |
All |
| Hyper-threading (All) |
Enable |
| Hardware prefetcher |
Enable |
| Adjacent-cache-line prefetcher |
Enable |
| Data cache unit (DCU) streamer |
Enable |
| DCU IP prefetcher |
Enable |
| Non-uniform memory access (NUMA) |
Enable |
| Memory refresh enable |
1x refresh |
| Energy-efficient turbo |
Enable |
| Turbo mode |
Enable |
| Energy performance preference (EPP) profile |
Performance |
| CPU C6 report |
Enable |
| Package C-state |
C0/C1 state |
| Power performance tuning |
OS controls EPB |
| Workload configuration |
I/O sensitive |
Note: The rest of the BIOS settings were kept at platform default values. These settings are used for the purposes of testing and may require additional tuning for application workloads. For additional information, refer to the BIOS tuning guide.