Cisco 8000 Series Secure Routers: Enhanced Visibility with ThousandEyes Traffic Insights
Available Languages
Bias-Free Language
The documentation set for this product strives to use bias-free language. For the purposes of this documentation set, bias-free is defined as language that does not imply discrimination based on age, disability, gender, racial identity, ethnic identity, sexual orientation, socioeconomic status, and intersectionality. Exceptions may be present in the documentation due to language that is hardcoded in the user interfaces of the product software, language used based on RFP documentation, or language that is used by a referenced third-party product. Learn more about how Cisco is using Inclusive Language.
Introduction to Cisco 8000 Series Secure Router
Introduction to Cisco ThousandEyes
Traffic Insights: Benefits on Cisco Secure Routers
Traffic Insights: Components and architecture
#1: Troubleshooting issues with correlated application performance and network data
#2: Discovering bandwidth bottlenecks
#3: Network forensics for a first-line security defense
#4: QoS policy audit and optimization while troubleshooting collaboration application issues
Appendix A: Design options for deploying Traffic Insights
Design with CAF (hosted on Cisco Secure Router)
Design with TEVA (Virtual Appliance)
Appendix B: Enabling and verifying Traffic Insights on Cisco Secure Routers
Verifying the Data Path: A Guided Discovery
Phase 1: Validating the hosting environment
Phase 2: Confirming cloud connectivity
Phase 3: Testing the flow pipeline
Phase 4: Local processing check
Phase 5: The Final Handshake in the Portal
Appendix C: Architecture details at length
Appendix D: System requirements and hardware platform support
The rapid evolution of industry paradigms—marked by the cloud revolution, the widespread adoption of SaaS applications, and the transition to hybrid work—has fundamentally redefined Enterprise WAN architecture. Today, the Internet serves as a foundational backbone for modern enterprises. As Enterprise networks migrate toward software-defined, cloud-first, and transport-agnostic models, they increasingly rely on Internet and third-party Cloud infrastructure. Consequently, network teams are tasked with ensuring high-quality digital experiences across environments that extend well beyond traditional organizational boundaries. Achieving comprehensive visibility—spanning cloud and SaaS providers, ISP infrastructure, and local or cloud-based data centers—is now a critical requirement for maintaining business continuity.
Cisco ThousandEyes provides the granular visibility necessary to navigate this complexity, offering deep insights across network, application, routing, and device layers. By correlating performance metrics with actual user experience, ThousandEyes empowers teams to proactively manage WAN connectivity.
● ThousandEyes Synthetic Probing: By deploying Enterprise agents on Cisco Secure Routers, organizations can achieve continuous, real-time monitoring of critical network and application metrics, such as network latency, packet loss, jitter, and application response times. This data is essential for validating and maintaining Service Level Agreements (SLAs).
● ThousandEyes Traffic Insights: Beyond synthetic monitoring, ThousandEyes Traffic Insights provides a detailed analysis of the traffic traversing your network. This capability allows teams to move beyond surface-level symptom identification, enabling them to attribute performance degradation to specific traffic flows and conduct rapid root-cause analysis.
By integrating these capabilities, network teams can ensure that digital experiences with their business-critical applications remain consistent and performant across the entire enterprise ecosystem.
This whitepaper explores the underlying architecture and deployment models of Traffic Insights, illustrating through real-world use cases how embedded assurance turns every Cisco Secure Router into a strategic observability node.
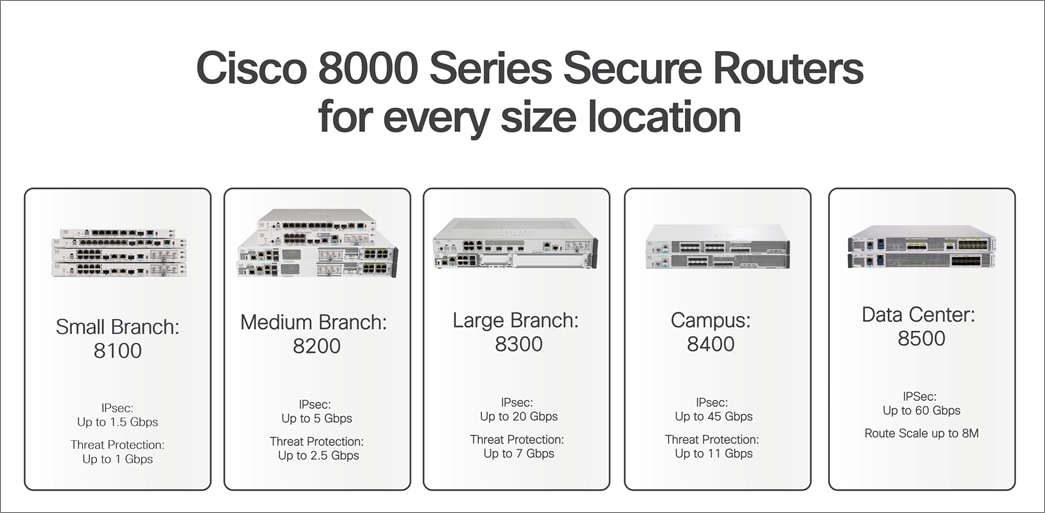
Introduction to Cisco 8000 Series Secure Router
The Cisco 8000 Series Secure Routers combine routing, security, and assurance in a single, zero-trust platform built for the AI era. Powered by the all-new secure networking processor built for large circuits, high-bandwidth AI/ML workloads, and security, these secure routers deliver unmatched protection, speed, and scalability, supporting up to 60Gbps of encrypted throughput while reducing power consumption and operational costs. These routers deliver zero-trust next-gen firewall (NGFW), post-quantum cryptography readiness, MACsec encryption, and Cisco Talos threat intelligence alongside industry-leading SD-WAN and enterprise routing, all in one box. The platform can be managed through command-line interface (CLI), Cisco SD-WAN Manager, Catalyst Center, or the Meraki Dashboard depending on the operational model.
The Cisco 8000 Series Secure Routers cover the entire portfolio from small branch to aggregation. The 8100 Series serves small branches with lean IT. The 8200 and 8300 Series handle small to medium branches with higher throughput, modularity, and PoE support. The 8400 Series targets campus aggregation and large branches, and 8500 Series is built for data center and WAN aggregation at scale.
Introduction to Cisco ThousandEyes
Cisco ThousandEyes is a cloud-based network intelligence platform. It provides end-to-end visibility across enterprise networks, the internet, cloud providers, and SaaS applications by collecting data across Layers 3 through 7 and presenting it through a unified dashboard. The platform’s Path Visualization technology incorporates 16 categories of data and metrics, including rDNS, BGP ASN, geolocation, end-to-end metrics, and hop-by-hop metrics. ThousandEyes effectively manages diverse scenarios, such as MPLS WANs, Internet paths, and multi-layer network topologies, including SD-WAN and cloud-based security, with comprehensive visibility into WAN or VPN overlay and underlay connectivity. For network teams, this means they can see exactly where a problem is occurring, even when it’s outside their own infrastructure.
ThousandEyes deploys three agent types: Enterprise Agents, Cloud Agents, and Endpoint Agents.
● Cloud Agents: Hosted by ThousandEyes in 200 locations globally, these agents test inward toward your public-facing services and applications ("Outside-In" visibility). No deployment or maintenance required. See Cloud Agents.
● Enterprise Agents: Deployed inside your network, these agents test outward toward applications, services, and internet destinations ("Inside-Out" visibility). They can run as ThousandEyes Virtual Appliances (TEVA), Linux packages, Docker containers, or embedded on Cisco Secure Routers via the Cisco Application Framework (CAF). Enterprise Agents also serve as Traffic Insights forwarders when enabled. See Enterprise Agents.
● Endpoint Agents: Lightweight agents installed on Windows and macOS user devices that capture last-mile Wi-Fi performance, VPN connectivity, system resource utilization, and real-user application experience. Ideal for monitoring the hybrid workforce. See Endpoint Agents.
To provide a comprehensive view of network health, the platform provides:
● Network and Application Synthetics: Active probes measuring availability, response time, throughput, packet loss, latency, and jitter at regular intervals from Cloud and Enterprise Agents. See Internet and WAN Monitoring.
● Path Visualization: Hop-by-hop, bidirectional network path mapping using 13 data points per hop, with outage detection across ISP, cloud, and CDN segments. See Path Visualization.
● Internet Insights: Collective intelligence aggregating data across the ThousandEyes customer base to detect macro-level internet and application provider outages. See Internet Insights.
● Traffic Insights: NetFlow/IPFIX flow data collection and correlation with synthetic test results for application-level traffic analysis. The focus of this whitepaper. See Traffic Insights.
● WAN Insights: AI-driven analysis of SD-WAN overlay performance, providing automated recommendations for tunnel and policy optimization. See WAN Insights.
Traffic Insights: Benefits on Cisco Secure Routers
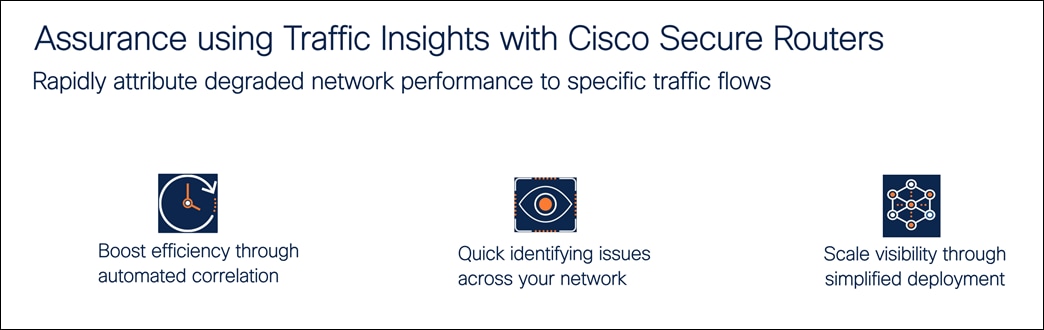
ThousandEyes Traffic Insights collects flow data from network devices and correlates it with synthetic test results. The combination is what makes it useful: synthetic tests tell you something is wrong, and flow data tells you what was happening on the wire at that exact moment. Together, they give you both the symptoms and the context. The ThousandEyes platform ingests NetFlow v9 and IPFIX from both Cisco and non-Cisco devices, enriches the data with SNMP device information and Cisco NBAR application classification, and presents the results through interactive charts, tables, and Sankey diagrams.
Traffic Insights enabled through Enterprise agent hosted on the Cisco 8000 Series Secure Router provides three primary operational benefits to help IT teams move from reactive troubleshooting to proactive management.
● Automated correlation for faster root cause: By viewing real-time flow data directly alongside synthetic test results, you can immediately identify which specific traffic is impacting the user experience. This correlation significantly reduces the manual effort typically required to determine why a performance dip occurred.
● Network-wide issue identification: Flexible, customizable dashboards allow you to interpret complex usage patterns at a glance. These granular views make it easy to filter through large datasets to find and resolve issues anywhere across the global network.
● Simplified deployment at scale: Centralized onboarding allows you to activate ThousandEyes agents across new locations rapidly. By integrating NetFlow and IPFIX directly into these agents, you gain broad and deep visibility without the overhead of deploying additional standalone hardware.
Traffic Insights: Components and architecture
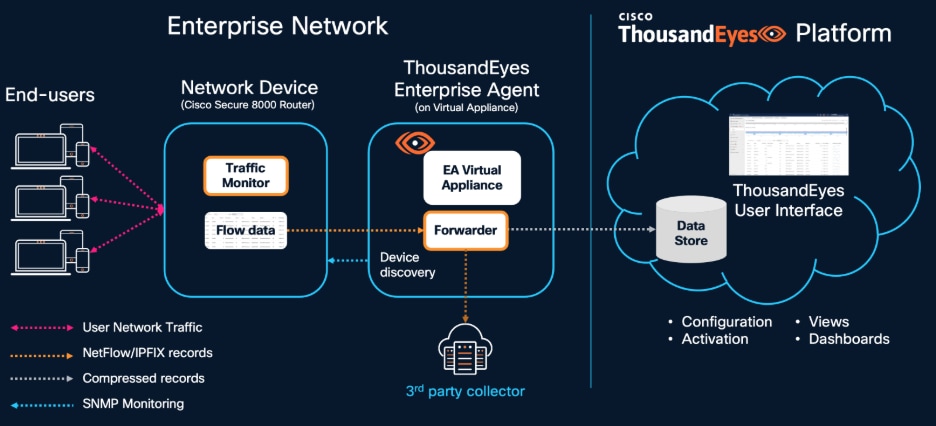
The following network components are involved in sending network flow data to ThousandEyes. The Flow Record defines which fields are captured per flow. The Interface is the observation point on the router (ingress, egress, or both). The Traffic Monitor in Traffic Insights combines two roles that are traditionally separate in NetFlow terminology. It acts as both the flow monitor (observing traffic on the interface and generating flow records based on the configured fields) and the flow exporter (sending those records to the forwarder using NetFlow v9 or IPFIX). The Forwarder is an Enterprise Agent that receives flow data, compresses and encrypts it, and sends it to the cloud. The Flow Collector is the ThousandEyes cloud platform where everything gets correlated. There is also the option to send a copy of raw flow data to an external collector (a SIEM, for example) in parallel.
Full component definitions are in the ThousandEyes Traffic Insights documentation.
Traffic Insights works by collecting flow data from your network devices and forwarding it to the ThousandEyes cloud for correlation with synthetic test results. Here is how the components fit together.
End-users at the branch connect to the network through LAN switches or wireless access points. These network devices forward traffic to the Cisco 8000 Series Secure Router, which serves as both the WAN gateway and the monitoring platform. On the router, a Traffic Monitor configured with Flexible NetFlow observes traffic on the WAN and LAN interfaces and generates flow records containing source and destination IPs, ports, protocol, byte counts, DSCP markings, and NBAR application classification. These flow records are exported internally to the ThousandEyes Enterprise Agent running on the same router as a Docker container via the Cisco Application Framework.
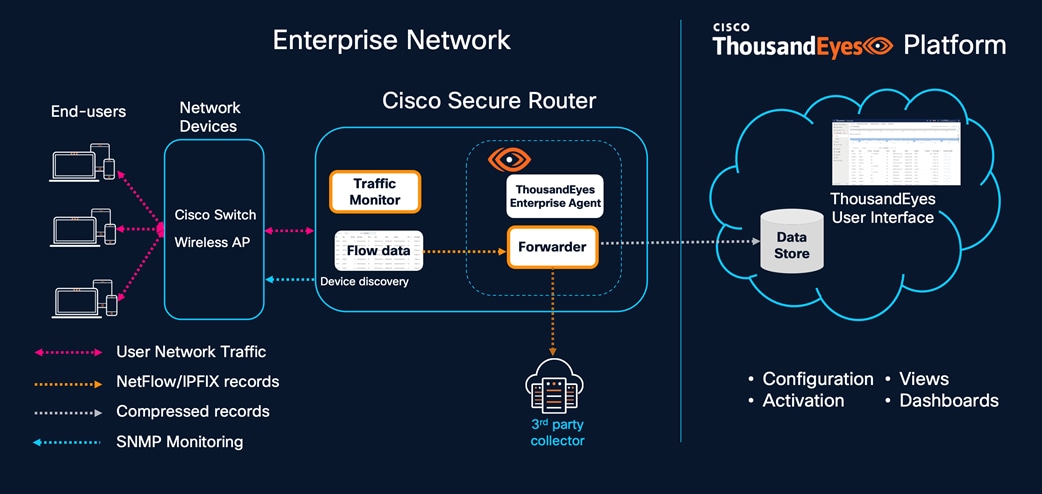
The Enterprise Agent acts as a forwarder. It receives the flow data, compresses and encrypts it, and transmits it to the ThousandEyes cloud platform in real time. If the organization already operates a third-party collector such as a SIEM or network analytics tool, the forwarder can optionally mirror the raw flow data to that external collector in parallel, so existing workflows are not disrupted. The architecture supports two deployment models for the forwarder. In a distributed model, each Cisco Secure Router runs the Enterprise Agent locally via CAF, and the router exports flows to its own embedded agent. This is ideal for branch sites with a single router. In a centralized model, multiple network devices across a region export flows to a single TEVA at a data center or hub site, which handles higher flow volumes (up to 200,000 flows per second with a 32 GB/16-core TEVA). Many organizations use both approaches: embedded agents at the branches and a centralized TEVA at the data center.
SNMP device discovery runs alongside the flow path. The Enterprise Agent polls the network device using SNMP to learn its hostname, interface names, interface utilization, and topology relationships via LLDP and CDP. This device discovery is what enables ThousandEyes to display the router by name in Traffic Insights views and, more importantly, to link it to the Path Visualization from synthetic tests. Without SNMP discovery, the device appears only by IP address, and the click-through from Path Visualization to Traffic Insights is not available. A Cisco Secure Router acting as an Enterprise Agent is fully capable of performing this device discovery and SNMP monitoring. Because the agent runs as a Docker container within the Cisco Application Framework, it has the necessary network reachability to poll other devices on the local LAN or across the WAN. This allows the router to function as a strategic local vantage point that not only runs synthetic tests and collects NetFlow but also acts as an SNMP poller for the surrounding infrastructure.
On the ThousandEyes platform side, all the data lands in the cloud Data Store where the correlation engine processes it. Flow data from the forwarder is matched with synthetic test results, SNMP device telemetry, and NBAR application classification. The ThousandEyes user interface provides configuration and activation controls for setting up forwarders, allowing traffic monitors, and managing SNMP credentials. On the operational side, the Views and Dashboards present the correlated data through stacked throughput charts, Sankey diagrams, conversation tables, and filterable application groupings. When a synthetic test detects degradation at a node that has been discovered via SNMP, operators can click through directly to Traffic Insights pre-filtered to that device and time window, seeing exactly what traffic was flowing through the affected interface at the moment the problem occurred.
Note: The configuration order is the reverse of the data flow. You set up the forwarder first, then SNMP device discovery, then the traffic monitor and flow records, and finally the interface assignments.
The following scenarios illustrate how Traffic Insights works alongside synthetic testing on Cisco 8000 Series Secure Routers. They are drawn from common operational situations that network teams encounter in branch, campus, and data center environments.
For details on dashboards, alerts, subnet tagging, and licensing: ThousandEyes Traffic Insights Documentation
#1: Troubleshooting issues with correlated application performance and network data
Traffic Insights on Cisco Secure Router operates through two data streams that together give a complete picture. The passive side collects NetFlow and SNMP data from the networks you own and manage. It measures interface utilization, traffic patterns, and application bandwidth consumption. This data is analyzed after flows are collected or terminated, so it tells you what happened on your infrastructure over a period of time. The typical use cases are infrastructure troubleshooting (which interface is congested), traffic engineering (how traffic distributes across links), trend analysis (how application usage changes over weeks), and capacity planning (which links need upgrades).
The active monitoring entails synthetic tests from the Enterprise Agent out across the full path, including ISP networks, cloud providers, and SaaS platforms that you do not own or control. It measures end-to-end performance symptoms like packet loss, latency, and jitter in near real-time.
The passive monitoring collects NetFlow/IPFIX and SNMP data from the network devices you own and manage. It captures interface utilization, traffic patterns, application bandwidth consumption, and conversation-level details. This data is analyzed after flow collection or termination, giving network teams a detailed view of what happened on their infrastructure over any given time period.
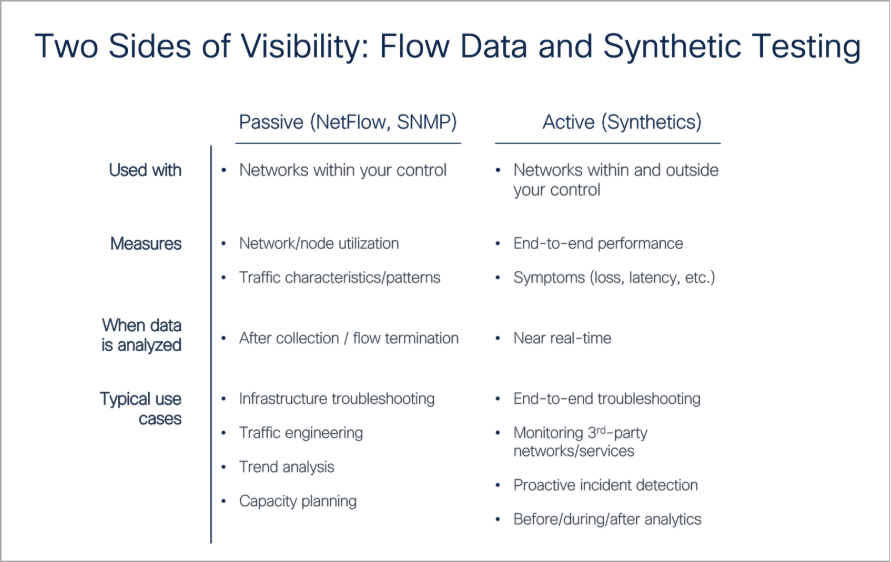
Neither side alone tells the full story. The passive data tells you that your WAN link was 85% utilized, and a file transfer was consuming most of the bandwidth, but it cannot tell you that a voice call was experiencing 10% packet loss at an ISP hop three networks away. The active data tells you that MOS dropped and loss appeared at a specific node, but it cannot tell you whether your own link congestion contributed to the problem or what applications were involved.
For an example, consider a branch office that’s runs an RTP Stream test from the embedded Enterprise Agent on a Cisco 8000 Series Secure Router to a Cloud Agent in Jersey City, NJ. The test sends EF-marked (DSCP 46) packets every minute, simulating a voice call and measuring MOS, jitter, loss, and latency continuously. For most of the day, MOS stays in the 4.0 to 5.0 range. But the timeline shows periodic dips that coincide with user complaints about call quality.
The operator clicks on a dip in the MOS chart and looks at the Path Visualization below it. The path from the branch router (RTP6-8161-G2-SL) exits through the local gateway at 172.16.1.1, enters the ISP network (AS 14593), and traverses several hops before reaching Jersey City. Two ECMP paths are visible through the ISP infrastructure. One node at 192.168.1.5 is flagged red with forwarding loss exceeding 10%.
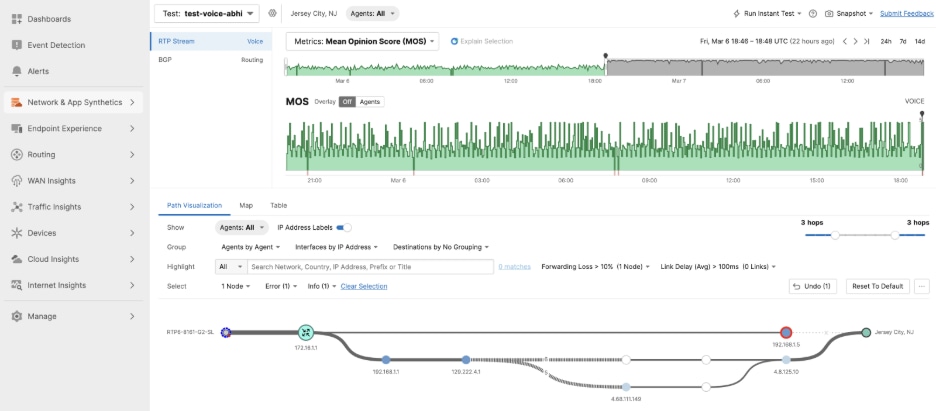
When call quality dips, the goal is to provide the ISP with proof rather than a request to 'investigate'. In this scenario, the operator switches to Traffic Insights and filters by the branch router and the same time window. The stacked throughput chart shows higher WAN utilization during the MOS dip, with a large file transfer consuming most of the bandwidth. The combination of a near-saturated uplink from the branch and a congested ISP node is amplifying packet loss for the RTP traffic.
Without the embedded agent on the Secure Router, the operator would have known that calls were bad but not where or why. The synthetic test identified the degraded hop, Path Visualization placed it in the network, and Traffic Insights showed that local congestion was making it worse. Three data sources from one platform, correlated automatically.
The use case we just described is where both sides come together. The RTP Stream test (active) detected the MOS degradation, and Path Visualization identified the node with forwarding loss. Traffic Insights (passive) showed that the WAN interface was near saturation with bulk downloads at the same moment. One side provided the symptom and location, the other provided the cause and context. Running both on the same Secure Router through a single Enterprise Agent is what makes the correlation immediate rather than manual exercise across separate tools.
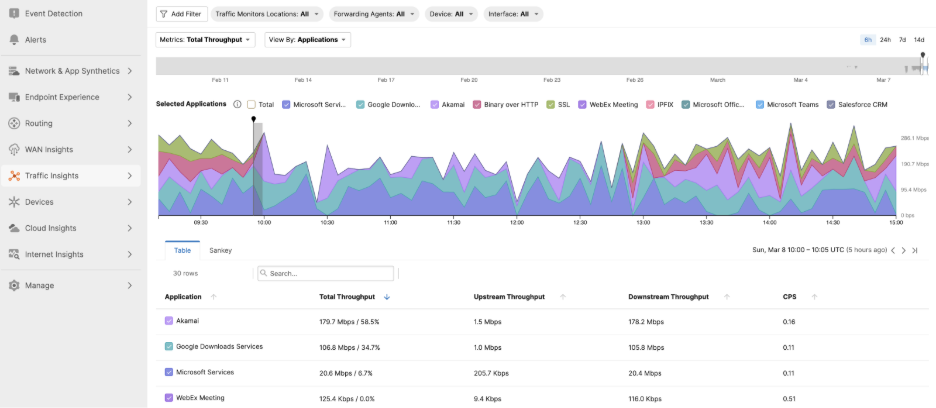
#2: Discovering bandwidth bottlenecks
At a 200-person branch, users reported consistent sluggishness in their CRM, yet the standard 5-minute SNMP averages showed the 1 Gbps WAN link was only 55% utilized. On paper, the circuit appeared healthy. Traffic Insights tells a different story. Filtering the WAN interface for 24hrs window, the stacked chart shows repeated bursts where utilization hits 98%. During those bursts, a cloud backup service and concurrent video meetings together consume nearly all available bandwidth. The CRM traffic, being TCP-based, backs off during congestion and then slowly recovers. That back-off is what users experience as sluggishness.
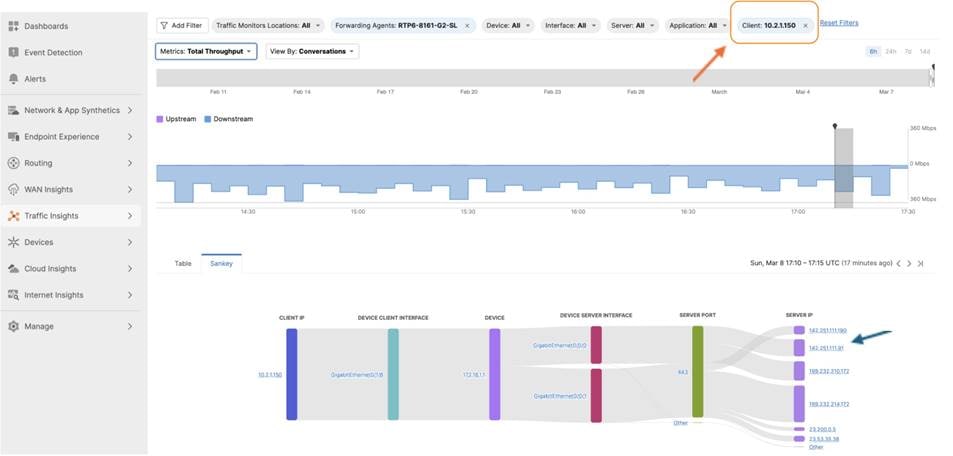
Drilling into the conversation view, the operator finds the backup traffic comes from a single NAS in the branch server closet, pushing 400 Mbps in periodic sync bursts. The fix is a QoS policy capping the backup to 200 Mbps during business hours and guaranteeing bandwidth for CRM. Over the following week, Traffic Insights trend views confirm the CRM dips are gone and help desk tickets from that branch drop to zero.
#3: Network forensics for a first-line security defense
The endpoint detection platform flags a workstation at a branch site as potentially compromised. Low-confidence alerts. The security team needs corroborating evidence before escalating.
In Traffic Insights, the operator filters by the endpoint’s source IP. Over the past 24 hours, it has made 4,200 connections to 380 unique destinations across 15 countries. Normal endpoints at that branch average fewer than 50 destinations per day. Most of the traffic is classified as “Unknown” by NBAR, meaning it does not match any known application signature. There is also a sustained 40 Mbps outbound flow to a single IP in an unusual geography, running for 6 hours straight.
The network team sends this data to the security team: timestamps, destination IPs, traffic volumes, application classifications. That is enough to confirm the compromise and isolate the endpoint. Traffic Insights is not a SIEM, but it serves as a fast first-line forensics tool that can accelerate the handoff to platforms like Cisco XDR.
#4: QoS policy audit and optimization while troubleshooting collaboration application issues
Traffic Insights shows which applications NBAR has classified on the router and how much bandwidth each one consumes throughout the day. When collaboration apps like Webex are getting squeezed during peak hours despite having QoS policies in place, the Traffic Insights throughput chart makes the contention visible. In this scenario, users at a branch office report choppy audio and frozen video on Webex calls. The complaints cluster around late morning, roughly the same time every day. The UC team confirms that the Webex cloud infrastructure is healthy. The network team checks SNMP utilization and sees the WAN link averaging 60%.
The NOC starts with the ThousandEyes RTP Stream test running from the embedded Enterprise Agent on the branch Secure Router to a Cloud Agent. The test simulates a voice call and continuously measures MOS (Mean Opinion Score), jitter, packet loss, and latency. The MOS chart shows a pattern where significant packet loss was detected for collab application at a specific time of the day.
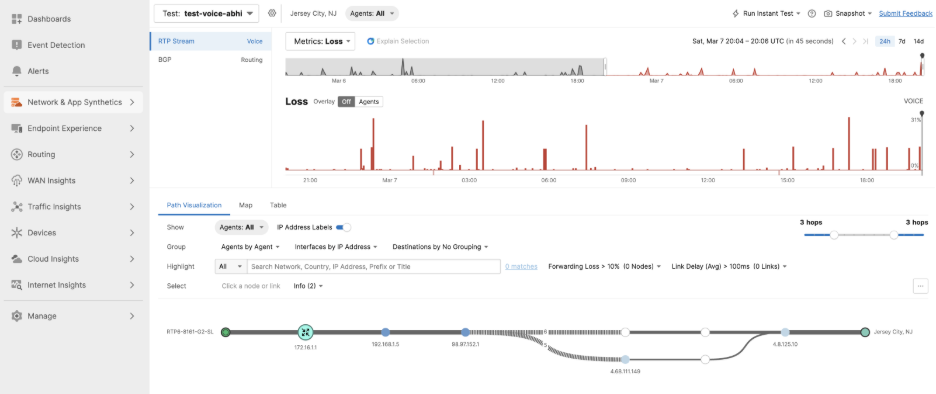
Traffic Insights pre-filtered to the same device and time window shows that a cloud backup service is pushing 800 Mbps through the same WAN interface, saturating the link. Webex Meeting traffic is clearly visible as a classified application thanks to NBAR running on the Secure Router, but it accounts for only 15 Mbps. When the backup and Webex traffic compete for the same link, Webex loses because TCP-based backup traffic aggressively fills the pipe while real-time voice and video packets get queued and dropped.
But the real finding will come from the router’s flow cache. In this case, the DSCP column for the Webex flows and every Webex flow was marked with DSCP 0x00, which is best-effort. The QoS policy deployed a few months ago was supposed to mark Webex as Expedited Forwarding (DSCP 46) and the class-map was built around destination IP ranges that have since expanded or shifted as the SaaS provider scales its infrastructure. Meanwhile, NBAR still recognizes the application correctly by name.
The fix has two parts. First, the QoS class map is updated to match on the NBAR application name rather than destination IP ranges, so it automatically adapts as Webex infrastructure changes. Second, the backup service is moved to a scavenger queue with a bandwidth ceiling during business hours. Matching on NBAR application name instead of destination IP ranges removes the operational overhead of tracking and updating SaaS provider IP lists across every branch router. NBAR classifies the traffic based on protocol behavior and deep packet inspection regardless of which IP the application resolves to, so the QoS policy stays effective without manual updates when the provider adds or changes infrastructure endpoints.
Note: Use command “show flow monitor <monitor-name> cache format table” to check DSCP column against the application name to reveal whether the QoS policy is actually marking the right traffic.
At its core, ThousandEyes Traffic Insights addresses a critical challenge: connecting “something is wrong” signal from synthetic testing with “here is exactly what was happening on the wire” from real-world flow data. For organizations leveraging Cisco 8000 Series Secure Routers, the integration is native - the router collects data flows, the hosted agent forwards these flows to ThousandEyes Cloud platform, and the Cloud platform correlates everything in one place.
The value of this integrated visibility is most evident while managing applications, such as Office365, Webex, Salesforce, and other customized applications, that drive critical business operations. As enterprises depend more heavily on SaaS platforms, and other cloud-delivered services, the ability to see exactly how these applications perform on the network becomes critical. When users complain about slow CRM responses, choppy video calls, or delayed emails, then the network teams can pull up application flow data and path visualization data to determine the exact time window and identify whether the issue lies with bandwidth contention, QoS misconfiguration, ISP network, or the application itself, in matter of minutes rather than days.
If you already have ThousandEyes Enterprise Agents running on your Cisco Secure Routers, then activating Traffic Insights capability is as simple as a single toggle, providing immediate, granular insights into your critical-business applications.
ThousandEyes Traffic Insights Documentation
Traffic Insights Configuration Guide
Cisco ThousandEyes Enterprise Agent Hosting on Cisco 8500 Series
Appendix A: Design options for deploying Traffic Insights
Traffic Insights needs an Enterprise Agent running as a forwarder. There are two supported design options, and which one you choose depends on the scale of your deployment and where the routers sit in your network.
Design with CAF (hosted on Cisco Secure Router)
The CAF agent runs natively on the Cisco 8000 Series Secure Router as a Docker container in the application hosting environment. Lower capacity than TEVA, but the advantage is that the router and the forwarder are the same box.
For a branch with a single Secure Router, the CAF approach is simpler. The router exports flows to its own embedded agent, and there is nothing else to deploy. For a data center or regional hub where many devices need flow analysis, or where flow volumes exceed 10,000 FPS, a centralized TEVA makes more sense. Many organizations end up using both: CAF at the branches and TEVA at the data center.
Design with TEVA (Virtual Appliance)
The ThousandEyes Virtual Appliance is a standalone VM deployed via OVA in a data center, private cloud, or public cloud. It is a high-capacity option.
End-users at the branch or campus generate network traffic that passes through a network device, typically a Cisco 8000 Series Secure Router. The Cisco 8000 Series Secure Router runs an embedded traffic monitor that captures user network traffic and generates NetFlow/IPFIX flow records. These records are forwarded to the ThousandEyes Enterprise Agent (EA) Virtual Appliance, where the Forwarder compresses and ships them to the ThousandEyes cloud Data Store.
| RAM |
Cores |
Max FPS |
Approx PPS |
Max Traffic Monitors |
| 32 GB |
16 |
200,000 |
20,000 |
1,000 |
| 8 GB |
4 |
50,000 |
5,000 |
1,000 |
One PPS roughly equals 10 FPS. These numbers assume records with all recommended fields.
Note: There are restrictions on clustering, shared account groups, and per-account FPS caps. The forwarder can also mirror raw flow data to an external collector if you already have one. Full restriction details: Forwarder Requirements
Appendix B: Enabling and verifying Traffic Insights on Cisco Secure Routers
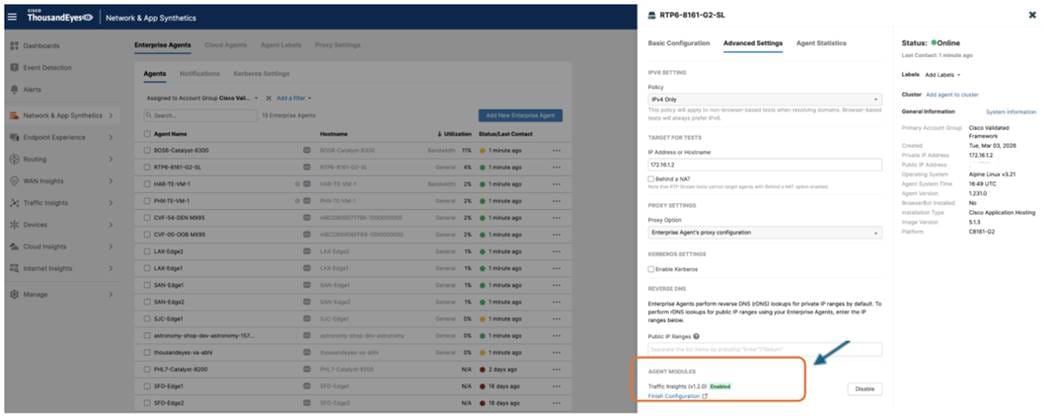
Enabling the forwarder is straightforward: go to Agent Settings in the ThousandEyes portal, select the agent, open Advanced Settings, and turn on the Traffic Insights module. The agent starts listening on UDP port 18089. You can verify that it is receiving flows at Traffic Insights > Settings > Forwarders, where the Dropped Events column tells you if the agent is at capacity.
![]()
Note: Refer to the configuration guide. The configuration order is the reverse of the data flow. You set up the forwarder first, then SNMP device discovery, then the traffic monitor and flow records, and finally the interface assignments. See also Workflow to Host the ThousandEyes Application on Cisco Secure Router.
Verifying the Data Path: A Guided Discovery
Once the initial configuration is applied, the focus shifts to ensuring the end-to-end data pipeline is secure and functional. This process follows the natural flow of telemetry, starting with the local hosting environment and ending with the final handshake in the ThousandEyes portal.
Phase 1: Validating the hosting environment
The first step is to confirm that the ThousandEyes agent is healthy and has the necessary "plumbing" to communicate. Using the show app-hosting list command on the router, you should verify the agent status is RUNNING. If the state is correct, a deeper look with “show app-hosting detail appid te” allows you to confirm that the VirtualPortGroup (VPG) mapping and IP assignments are correct. A successful environment is one where the container has a reachable gateway and a functional NAT rule on the WAN interface, providing it with a clear path to the internet.
Phase 2: Confirming cloud connectivity
Once the container is stable, you need to ensure the agent is talking to the ThousandEyes platform. By connecting to the container's shell and reviewing “cat /var/log/agent/te-agent.log | tail -20”, you are looking for an "Agent starting up" message accompanied by a unique Agent ID. If the logs instead show "connection timed out" or "couldn't resolve host," it indicates a fundamental networking or DNS issue that must be resolved before any telemetry can be uploaded.
Phase 3: Testing the flow pipeline
With the agent connected, the next logical check is on the router itself to see if it is successfully "pushing" traffic data to the container. The show flow exporter statistics command is the primary tool here; you want to see the packet and byte counters for the ThousandEyes exporter steadily incrementing. If these counters remain at zero, it typically points to a mismatch between the exporter's destination IP and the container’s actual VPG address.
Phase 4: Local processing check
After confirming the router is sending data, you must verify the agent is successfully "catching" and processing it. Inside the container, “cat /var/tmp/te-agent/logs/te-etm-agent.log | tail -30” shows whether the ETM agent is processing incoming flows. You are looking for a "Start packet processing" entry followed by "Traffic filter updated." If the logs show the process starting but then immediately stopping, it is often a signal that the portal-side configuration for that specific monitor has not yet been set to “Allowed.”
Phase 5: The Final Handshake in the Portal
The final confirmation happens in the ThousandEyes portal under Traffic Insights > Settings > Forwarders. Here, the "UDP Ingress" column confirms that packets are reaching the agent, while the "FPS" (Flows Per Second) metric confirms that valid, recognizable records are being forwarded to the cloud. If you see high ingress but zero FPS, it is a clear indicator that the NetFlow template is missing one of the mandatory fields required for Traffic Insights to build a conversation. Once the device status in the Traffic Monitors tab shows as "Allowed," the architecture is fully verified and ready for live analysis.
Appendix C: Architecture details at length
The Cisco 8000 Series Secure Router integrates the ThousandEyes Enterprise Agent natively through the Cisco Application Framework (CAF), also known as IOx. The agent is deployed as a Docker container on the router's application hosting environment, managed entirely through the IOS-XE CLI or the Local Manager web interface. This architecture enables two complementary monitoring capabilities from a single platform: synthetic testing for path quality measurement and Traffic Insights for real-time traffic flow analysis. The ThousandEyes Enterprise Agent runs as a Docker container within the CAF environment on top of the IOS-XE kernel.
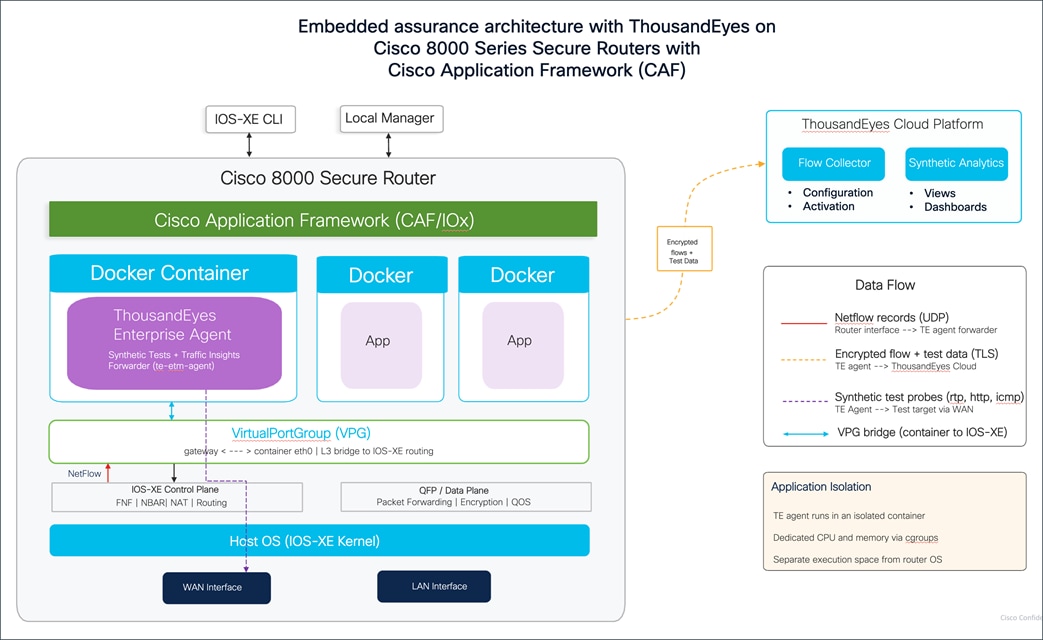
The Cisco Application Framework manages the container lifecycle, including installation, activation, resource allocation, and health monitoring. Dedicated CPU and memory resources are bounded using Linux control groups (cgroups), providing a separate execution space for the agent without compromising the integrity and performance of the router's forwarding operations. Additional containers for other applications can run alongside the ThousandEyes agent, each managed independently by CAF. The router's data plane, the QFP that handles all production packet forwarding, encryption, and QoS, operates independently of the container, so running the agent does not affect your production traffic.
The container connects to the IOS-XE routing domain through a VirtualPortGroup (VPG) interface. The VPG acts as a Layer 3 bridge between the container's internal eth0 interface and the routing domain. The router assigns a gateway IP address on the VPG interface (for example, 172.16.x.1), and the container receives a corresponding IP address on the same subnet (172.16.x.2). A NAT overload rule on the WAN interface translates the container's traffic for internet access. This connectivity allows the agent to reach the ThousandEyes cloud platform for check-in, data upload, and configuration updates over TLS on port 443.
The result is that every Secure Router becomes an active monitoring node. The Enterprise Agent generates active synthetic test probes, including RTP stream tests for voice quality (MOS, jitter, loss, latency), HTTP server tests for application response time, and agent-to-agent network tests for end-to-end path measurement. These probes originate from the container, traverse the VPG into the IOS-XE routing domain, and exit through the router's WAN interfaces toward test targets on the internet or at remote sites to measure path quality to your applications and remote sites. Cisco Secure router also acts as a Traffic Insights forwarder and generates NetFlow/IPFIX records on its WAN and LAN interfaces using Flexible NetFlow with NBAR application classification and exports those records to the agent on UDP port 18089 through the VirtualPortGroup. Inside the container, the “te-etm” agent process receives the flow data, compresses and encrypts it, and transmits it to the ThousandEyes cloud platform in real time. The Cisco 8000 Series Secure Routers support voice, collaboration, and unified communications workloads natively, making embedded traffic monitoring for these applications particularly relevant.
In the cloud, the ThousandEyes platform correlates these two data sources together, so when a synthetic test shows a latency spike or packet loss at a specific router interface, you can click directly into Traffic Insights and see exactly which applications were consuming bandwidth on that interface at that moment and whether a specific flow was causing the congestion.
The result is that every Cisco Secure Router in your network becomes both a routing and security platform and an active observability node, giving your operations team the ability to answer not just "is something wrong" but "what is causing it" from a single device.
Appendix D: System requirements and hardware platform support
| Platform |
Minimum IOS XE |
DRAM |
Agent Version |
| C8151-G2 C8161-G2 |
17.18.1a |
8 GB |
4.2.2 |
| C8231-G2 C8231-E-G2 |
17.18.1a |
8 GB |
4.0.2 |
| C8235-G2 C8235-E-G2 |
17.18.1a |
16 GB |
4.0.2 |
| C8355-G2 C8375-E-G2 |
17.18.1a 17.15.3a |
16 GB |
4.0.2 |
| C8475-G2 C8455-G2 |
17.15.3a |
32 GB |
4.2.2 |
| C8570-G2 C8550-G2 |
17.15.4a |
32 GB |
5.1 |
Cisco 8100 Series Secure Routers Software Configuration Guide