Experience Metrics Solution Overview
Available Languages
Bias-Free Language
The documentation set for this product strives to use bias-free language. For the purposes of this documentation set, bias-free is defined as language that does not imply discrimination based on age, disability, gender, racial identity, ethnic identity, sexual orientation, socioeconomic status, and intersectionality. Exceptions may be present in the documentation due to language that is hardcoded in the user interfaces of the product software, language used based on RFP documentation, or language that is used by a referenced third-party product. Learn more about how Cisco is using Inclusive Language.
Proactively assure user experience by resolving issues in seconds, not hours
Imagine a scenario in which your end user experiences a sudden spike in the amount of time it takes for a web page to load. What if you were able to diagnose and resolve the root cause even before the user files a ticket? That's the power of Experience Metrics, part of Cisco Assurance.
Struggling to resolve issues using siloed network management techniques like Simple Network Management Protocol (SNMP) or Internet Control Message Protocol (ICMP) is no fun, especially when your users are depending on applications to be fast and responsive. What's worse is that these traditional methods are purely reactive. By the time you receive the alert, your users have already been impacted. Furthermore, analyzing fragmented data collected from across multiple domains forces manual correlation, leading to slow resolution times and diminished business outcomes.
Experience Metrics addresses these challenges through an AI-driven, unified view that shifts operations from reactive monitoring to proactive, user-centric assurance. Transforming raw telemetry into real-time experience scores and actionable insights, Experience Metrics can automatically categorize connectivity failures and identify root cause before users are affected. This approach accelerates issue resolution, helps you prioritize issues based on actual user impact, and gives you the end-to-end visibility you need to rapidly get to a resolution. Experience Metrics simplifies network operations, allowing you to move beyond standard monitoring to optimize digital experiences for your end users.
Collapse thousands of signals into a single view.
● Save time and optimize end-user productivity with proactive issue resolution: By using AI-powered root-cause failure contributors, Experience Metrics helps initiate troubleshooting even before users report issues.
● Reduce console fatigue through unified visibility: Experience Metrics helps ensure continuity and fully contextualized analysis to provide a single, unified view of performance, trends, and metrics across network domains, eliminating the need to jump between multiple tools or tabs.
● Accelerate time to resolution: Experience Metrics significantly reduces resolution time by offering plain-language diagnostics that feed into Cisco's AgenticOps framework.
● Focus on business impacts rather than device statistics through a user-centric approach: Unlike tools that focus solely on device health, Experience Metrics quantifies performance from the user's perspective to help teams prioritize issues in alignment with business needs.
Traditional operations can't keep up
When user experience can significantly impact business success, traditional reactive monitoring is no longer sufficient for network operations teams facing growing complexity and cost pressures. Industry analysts, including those at Gartner, have emphasized that AIOps is essential for managing the scale of modern hybrid environments, noting that organizations leveraging AI-driven observability can reduce Mean Time to Repair (MTTR) by up to 50%.*
The shift to AgenticOps
Experience Metrics addresses the need to shift from monitoring device health to a model more holistically designed to optimize user experience. By leveraging the AI built into Experience Metrics, teams can correlate telemetry across multiple operational domains, quickly diagnose the root cause of failures, and begin to shift from "firefighting" to proactive optimization.
Solving fragmented visibility to reduce costs
Siloed tools create "blind spots" that ultimately inflate costs and slow down resolution. Experience Metrics unifies visibility into a single dashboard, providing a complete view of digital experience at the user level. This allows teams to prioritize activity based on actual user impact, which can help focus limited resources on the most important business outcomes.
Ultimately, Experience Metrics empowers NetOps teams to shift from being a reactive cost center to a strategic partner in the digital enterprise.
*Source: Gartner's Market Guide for AIOps Platforms, 2024.
Cisco Experience Metrics
Experience Metrics is an AI-driven assurance capability designed to shift network management from device-centric, reactive monitoring to proactive, user-centric troubleshooting and root cause analysis.
Experience Metrics collects and aggregates telemetry from across wireless and wired domains to present clear and actionable scoring and graphical representations of user experience, categorized to make it easy to identify elements within the network stack that are negatively impacting performance.
AI-generated insights provide summarized explanations that pinpoint the network entity or entities that need to be investigated and remediated.
Capabilities include:
Consolidated visibility
See what's affecting user experience in one flexible, simple-to-navigate display.
● Predefined or custom timeframes to narrow or broaden visibility.
● Filtering on specific access points, SSIDs, and Wi-Fi frequencies to fine-tune wireless troubleshooting.
● A sliding window that lets you zoom in to correlate trends and usage patterns with degraded performance.
● Easy-to-interpret scoring and color coding of graphs and data that make it easy to see where problems are occurring and why.

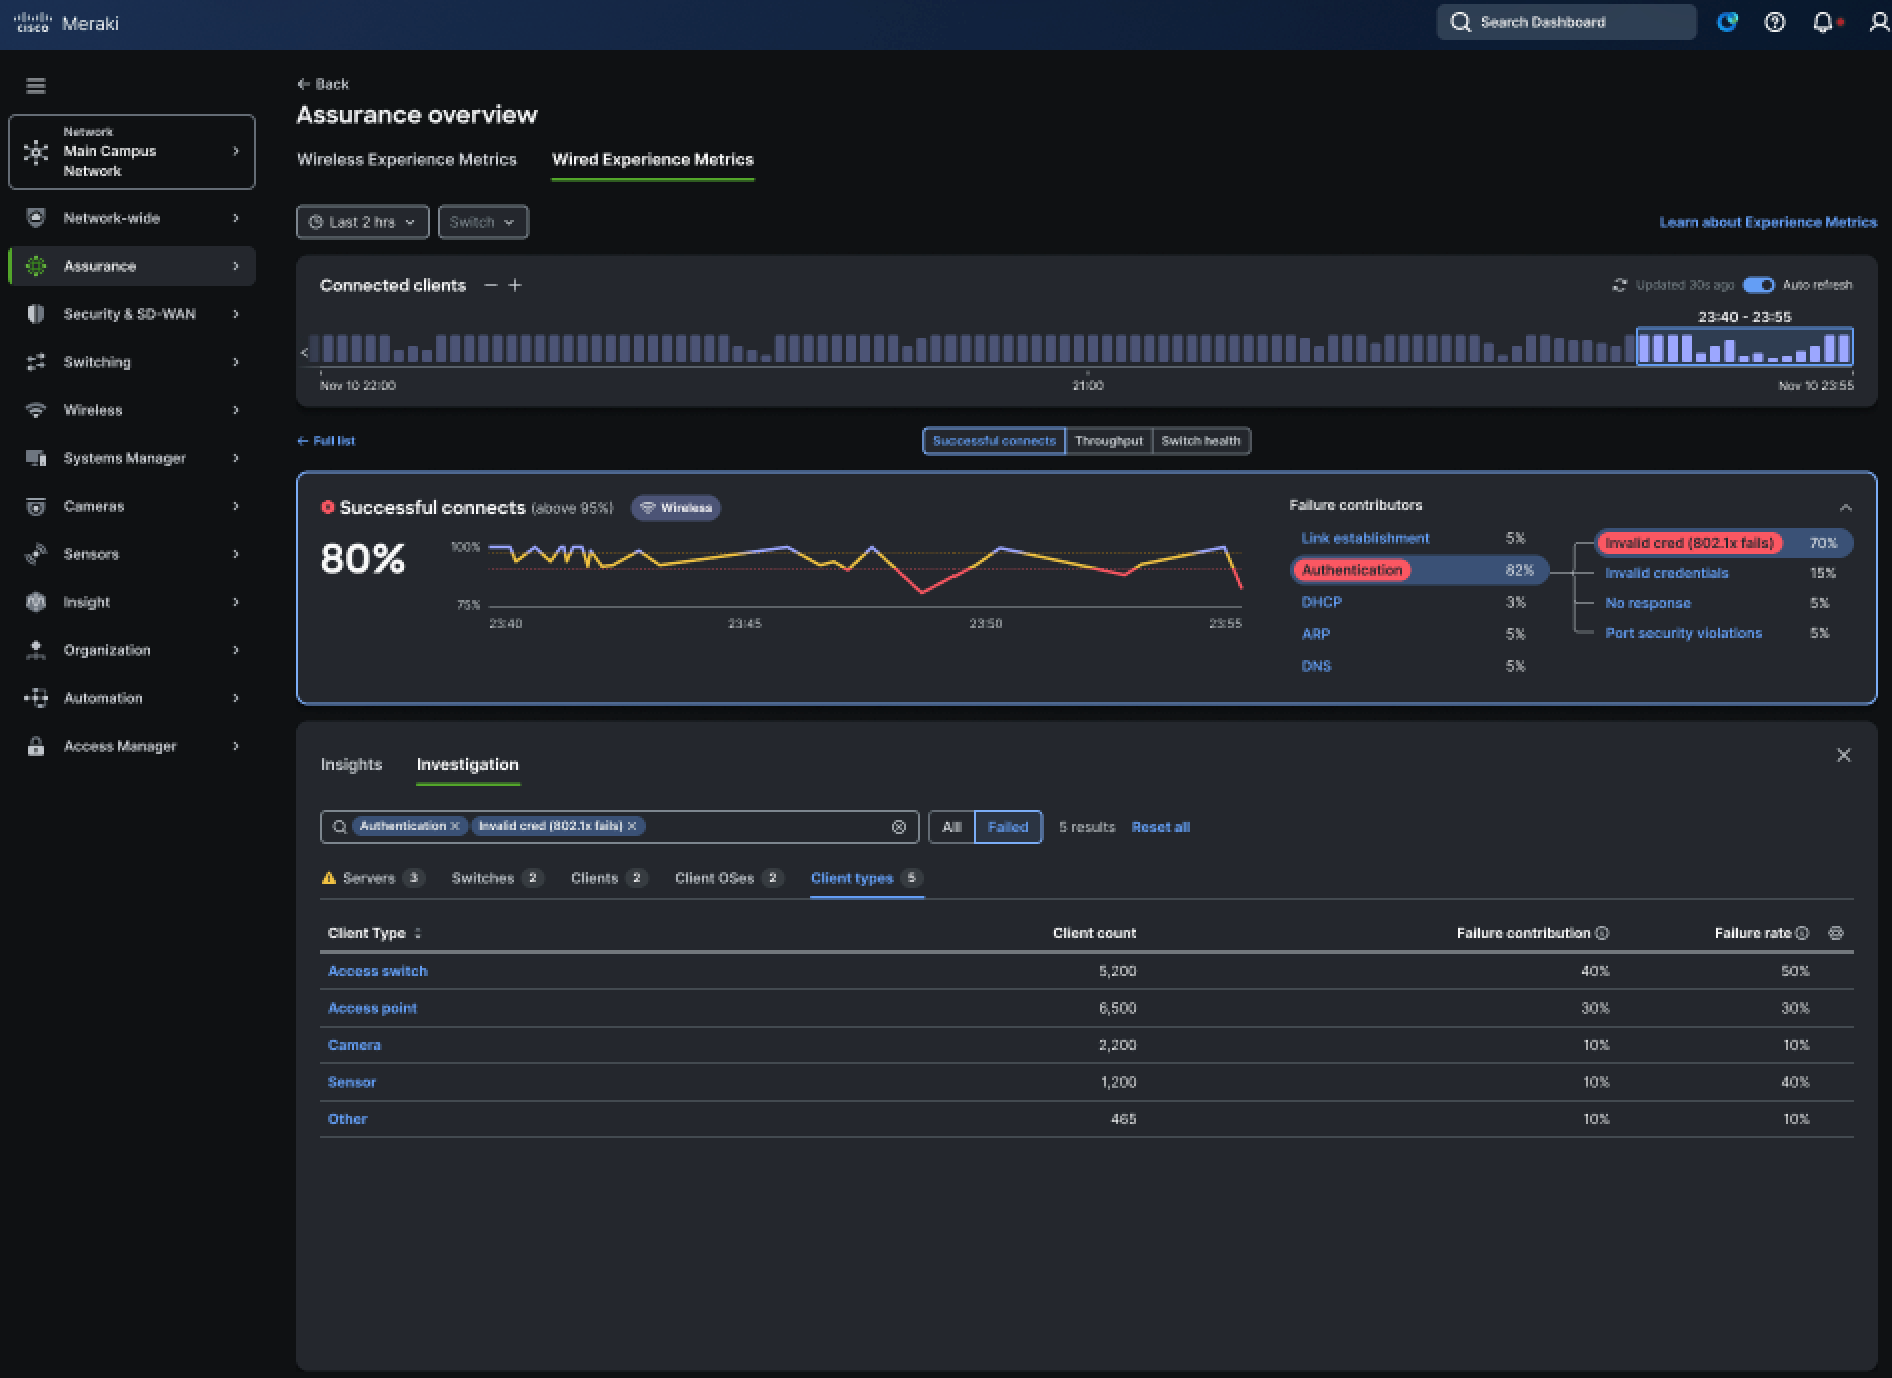
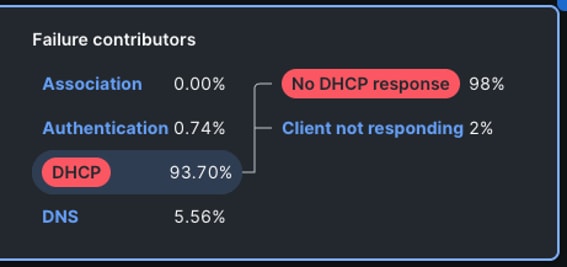
AI-powered failure analysis
Assess performance across network domains using defined thresholds for key metrics, including:
● Wired successful connections: Determine how issues with authentication, Dynamic Host Configuration Protocol (DHCP), or Power over Ethernet (PoE) are impacting the experience of Ethernet-connected users.
● Wireless successful connections: Identify whether failures are due to Wi-Fi handoff or are protocol related, including client authentication, DHCP response, or DNS.
● Time to connect: See if slow connect times are caused by Wi-Fi handoff issues, protocol-related issues, or something else.
● Channel availability: Learn whether user experience is impacted by wireless interference, contention, or congestion due to high traffic volumes.
● Wireless coverage: Attribute degraded performance to poor signal quality, insufficient access point density, power restrictions, or clients that "stick" persistently to less optimal access points.
Proactive AI-generated insights
Experience Metrics makes network performance predictable and reliable by continuously measuring performance against defined thresholds.
● Auto-refresh of data that keeps you current with changing network conditions.
● Contextualized visibility underneath a timeline showing connected clients.
● On-screen scores and graphics that adjust automatically within the selected time range as conditions change.
● AI-generated summaries that offer clear explanations and point directly to suggested remediation.
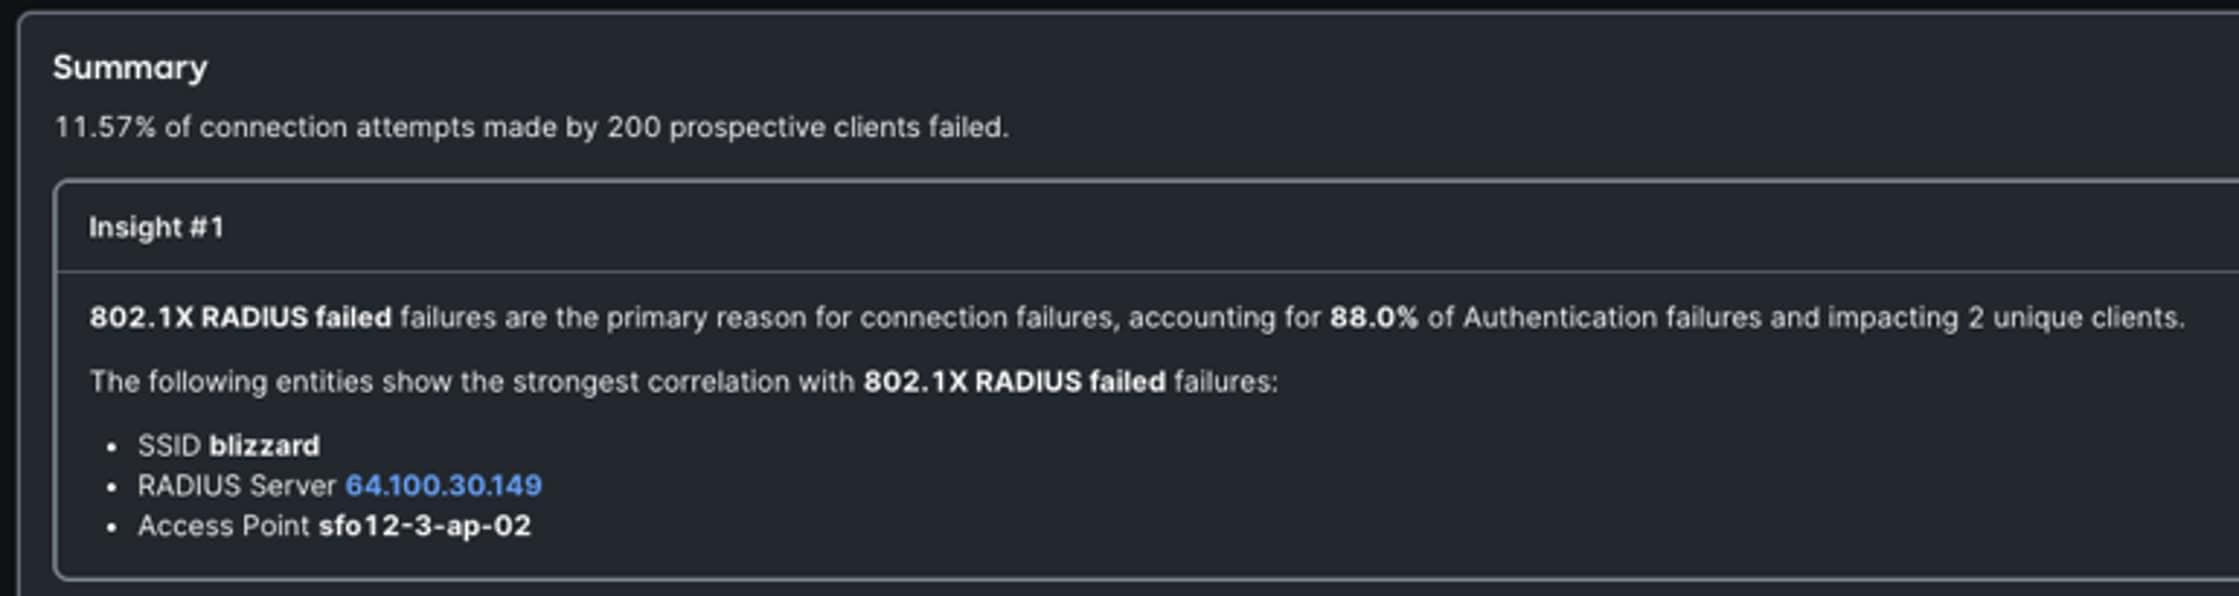
Table 1. Industry use cases
| Industry |
Experience Metrics use cases |
| Retail |
When successful connection rates drop for wired point-of-sale or Wi-Fi-connected handheld inventory scanners, Experience Metrics AI-powered classification can instantly determine if the failures are caused by physical (e.g., PoE, RF contention) or protocol-related (e.g., RADIUS or DHCP) problems. |
| Healthcare |
By monitoring time to connect for latency-sensitive applications such as real-time imaging or telehealth calls between doctors and patients, Experience Metrics can proactively identify and resolve potential bottlenecks, leading to better patient outcomes and reduced stress for both patients and providers. |
| Financial services |
Financial applications must be highly performant and reliable to maintain customer trust and regulatory compliance. Experience Metrics can help teams see right away if authentication timeouts or DNS latency is impacting bank employee productivity or customer transactions and move quickly to minimize disruptions. |
| Manufacturing/industrial |
Industrial, manufacturing, and other functions frequently rely on specialized Wi-Fi-connected client devices, such as handheld scanners or tablets. Experience Metrics factors native telemetry from device manufacturers such as Apple, Samsung, Intel, and Zebra to surface client-side issues that traditional network tools cannot see. |
| Public sector/ education |
Experience Metrics instantly surfaces disruptions in or across highly distributed campuses and government agencies that can prevent students, citizens, or officials from accessing critical services or websites. IT staff can then use Experience Metrics to quickly summarize the failure, using its AI-generated insights to rapidly isolate and resolve. |
Table 2. Operational use cases
| Use case |
Description |
| Proactive network optimization |
Continuously monitor key performance indicators to identify and address potential issues before they escalate and impact end-user or device experience. Intuitive color-coded graphs and scoring are updated in real time, helping operators maintain current visibility and see immediately when performance dips below thresholds. |
| Accelerated root cause analysis |
Use AI-driven classifiers to help pinpoint root cause by instantly identifying the primary failure contributor and sub-contributor when an experience metric falls below expectations. Plain language insights then point to specific elements associated with the failure, allowing for further investigation and leading to speedy resolution. |
| Unified visibility and operational simplicity |
Eliminate context switching and gain a consistent source of truth for troubleshooting through a single workflow that aggregates telemetry from across networks to display metrics at the organization, network, and client levels. Drill down at a specific point in time from organization-wide trend data to see specific clients or switches. |
Financing to Help You Achieve Your Objectives
Cisco Capital can help you acquire the technology you need to achieve your objectives and stay competitive. We can help you reduce CapEx. Accelerate your growth. Optimize your investment dollars and ROI. Cisco Capital financing gives you flexibility in acquiring hardware, software, services, and complementary third-party equipment. And there's just one predictable payment. Cisco Capital is available in more than 100 countries. Learn more.
Siloed network management is no longer effective for operating the increasingly complex networks your organization depends on to securely connect users to the applications they use for productivity, customer interaction, or collaboration.
As the world's leading supplier of networking solutions, Cisco is uniquely positioned to help customers assure optimal operation of their networks with an AgenticOps framework that eliminates blind spots across their entire digital estate, including networking, cybersecurity, physical security, observability, and collaboration in one AI-ready platform.
Looking to replace stressful device-centric troubleshooting with simplicity and proactive remediation?
Cisco Experience Metrics, operating within Cisco's AgenticOps framework, gives you a holistic approach to assuring user experiences across your networks and applications. Driven by AI-powered diagnostics that point you directly to what's impacting users, Experience Metrics provides the visibility and built-in intelligence you need to stay ahead of network issues and unhappy users.
To learn more, visit: Cisco Experience Metrics or Cisco AgenticOps, then get in touch with your Cisco account team or authorized partner.