Monitoring

This chapter contains the following sections:

About the Cisco Business Wireless AP Monitoring Service

The Cisco Business Wireless AP Monitoring service enables the Primary AP to monitor the WLANs and all the connected devices on the network.

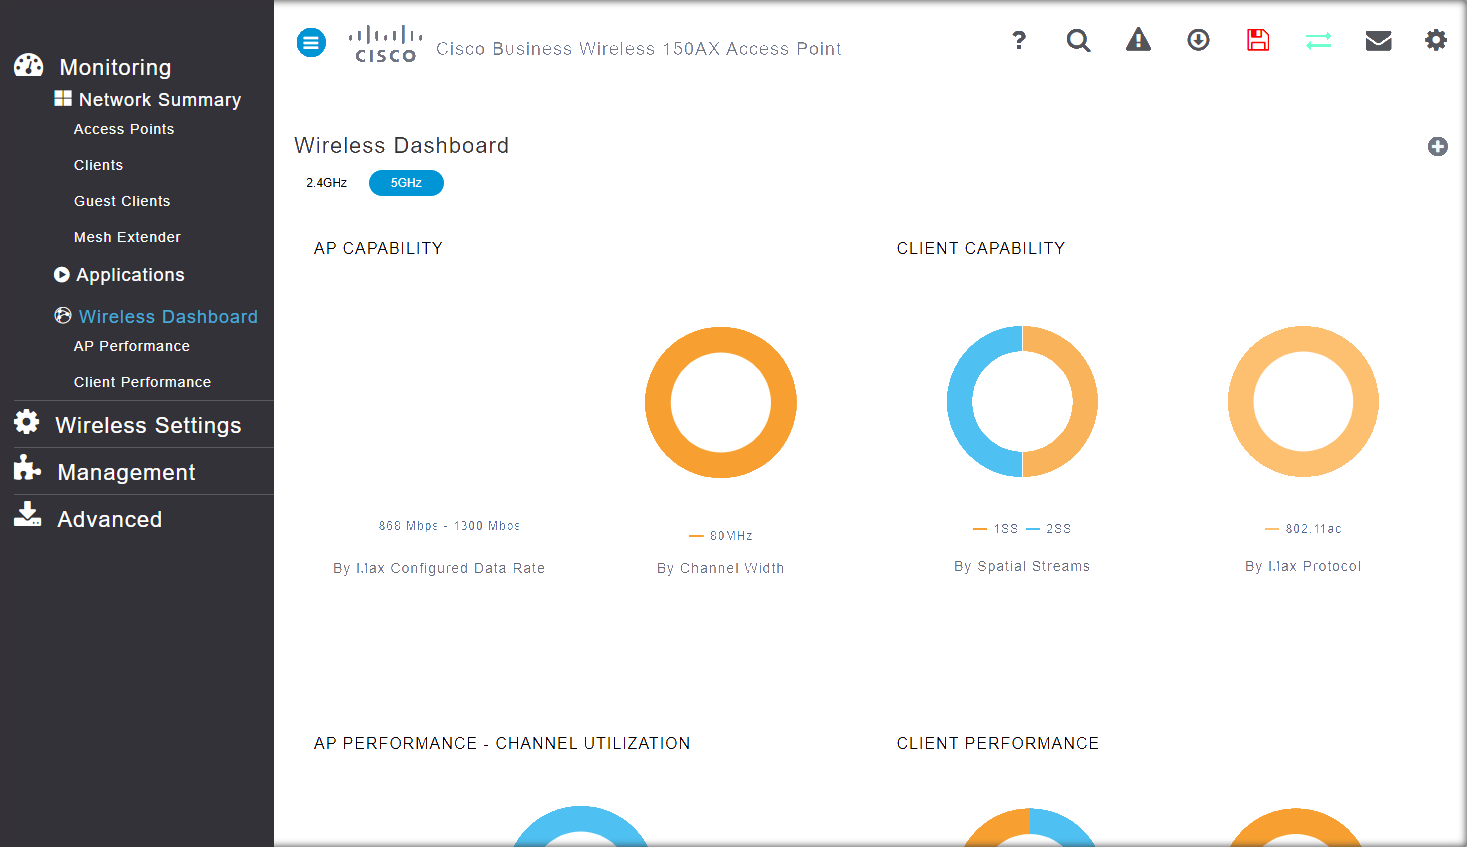
The Monitoring service offers the following capabilities through the Network Summary and Wireless Dashboard tabs:

  • View details of configured WLANs.

  • View list of top WLANs based on traffic and associated clients.

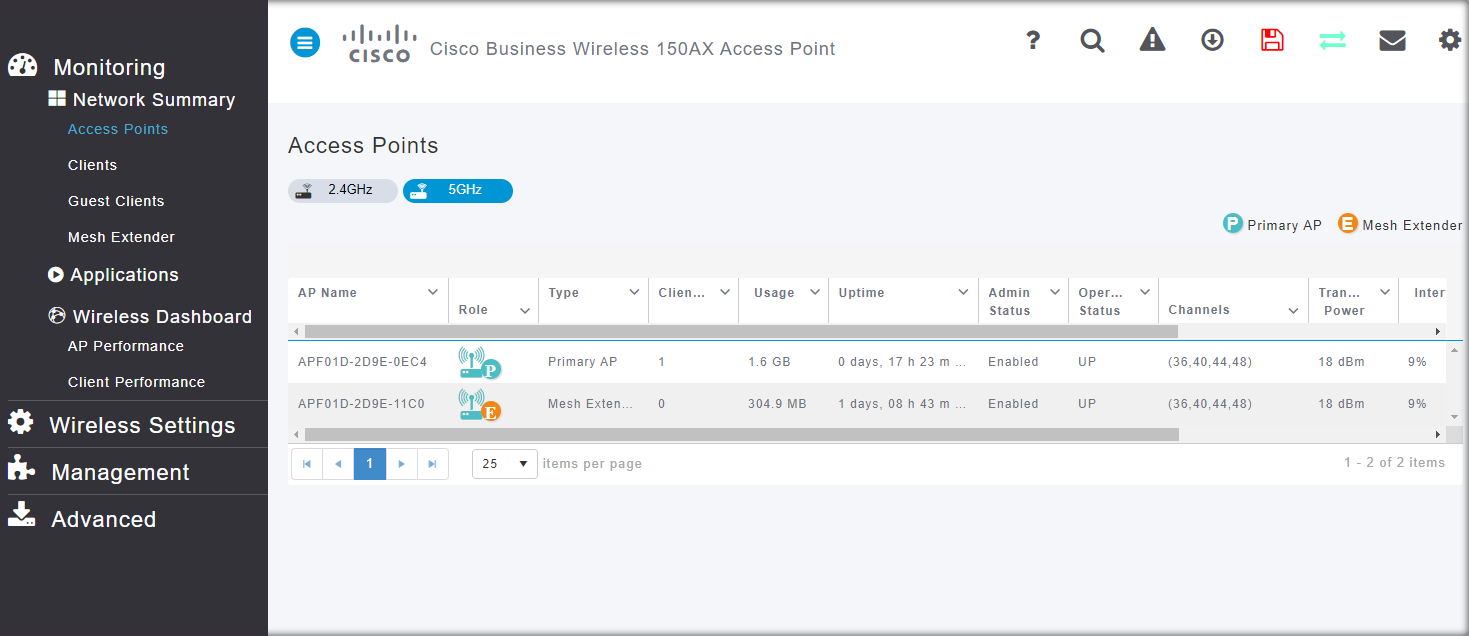
  • View details of APs in the network.

  • View details of clients operating actively at either 2.4GHz or 5GHz.

  • View summary of client device, guest client device, operating systems, and applications running on these devices.

  • View a detailed list of rogue clients and APs.

  • View details of various interferers in the network on the 2.4GHz and 5GHz radio frequencies.

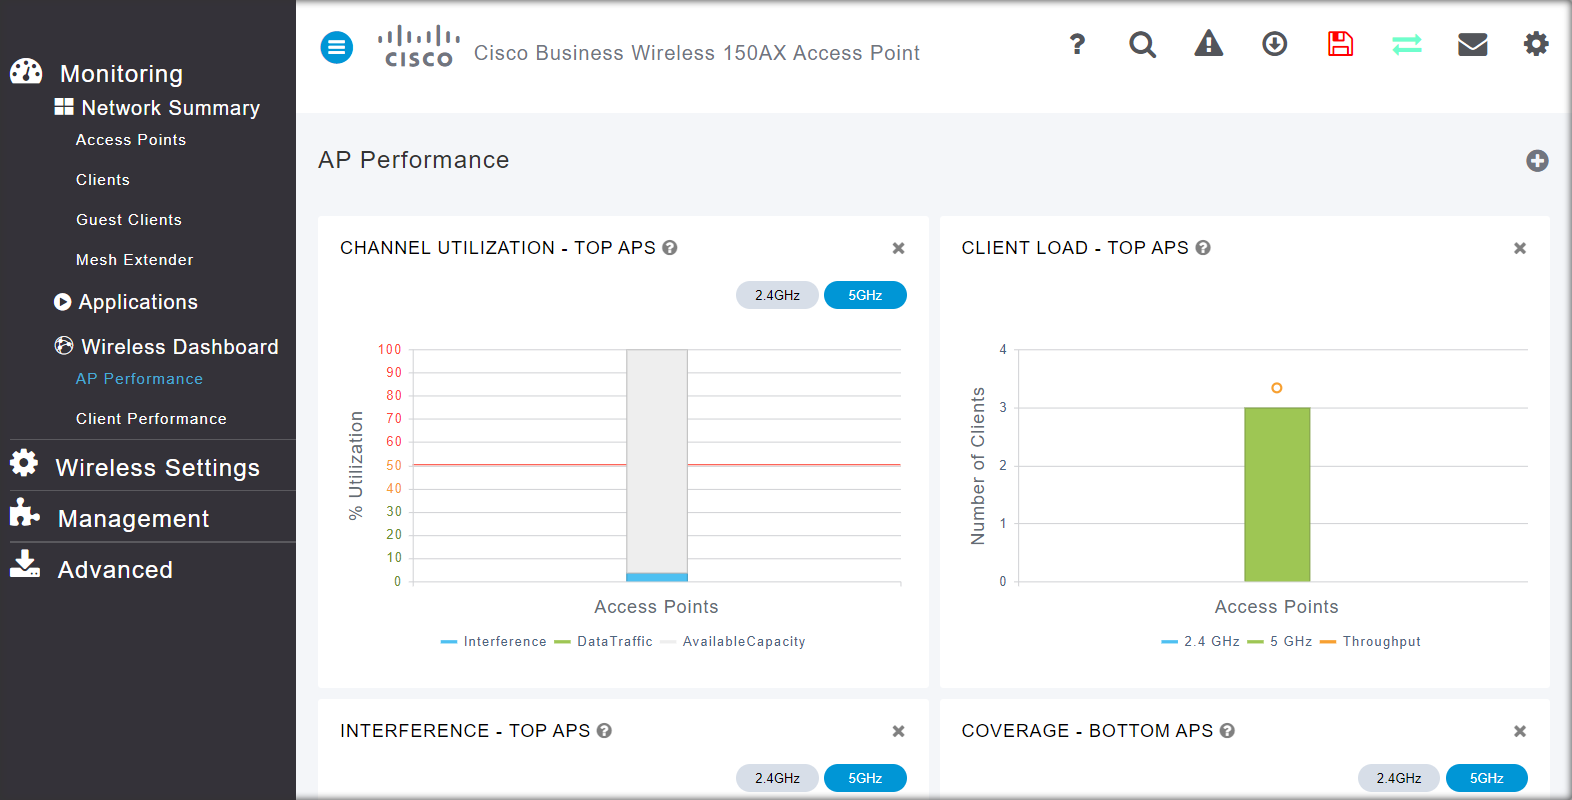
  • Monitor the performance of APs in the network.

  • Monitor the performance of clients and guest clients in the network.


Note


  • All the parameters on the Network Summary page are read-only parameters.

  • This page is automatically refreshed every 30 seconds.


Customizing the Network Summary View

The Network Summary page displays data in a graphical format. You can customize the Network Summary view by adding or removing the widgets. The data displayed in various widgets can be viewed either in the doughnut view format or in the tabular view format by toggling the display icon on the top right of the individual widgets.


Note


Each of the action icons available within the widget is described in the Customizing the Network Summary View section.


The following widgets are on the Network Summary page.

  • OPERATING SYSTEMS by clients

    Displays the OS information of the clients such as Linux and Android etc., that are connected to the WLAN. You have to enable Local Profiling in the WLAN to view this information.

  • GUESTS by usage.

    Displays the Top 10 guest clients in the network based on the throughput and usage.

  • ACCESS POINTS by usage

    Displays the Top 10 access points in the network based on the number of clients connected, usage, and throughput.

  • APPLICATIONS by usage

    Displays the Top 10 applications such as Gmail, YouTube, Facebook etc., based on the usage level of clients connected in the network. You must enable the Application Visibility Control (AVC) option in the WLAN to view this information.

  • TOP WLANS by usage

    Displays the top 10 WLANs in the network by usage and number of clients connected.

  • CLIENTS by usage

    Displays the top 10 clients in a network based on throughput and usage.

Using the icons

The following icons and options are available to customize and view data as needed.

Clear data This clears the usage data and resets it to zero.

Tabular Click this icon to change the display of data between tabular view or doughnut view.

Save This exports the top 10 entries locally in Excel format.

All entries are exported for the Guests widget.

This removes the widget from the Monitoring page.

This adds the widget in the Monitoring page.

Customizing Access Points Table View

This section describes how to customize the view of all the APs in your network.

  1. Navigate to Monitoring>Network Summary>Access Points.

    To see high level details of the AP, click on the count link in the Access Points summary section under Monitoring > Network Summary page.

  2. Toggle between the 2.4GHz and 5GHz tabs on the top of the page to view a tabular listing of the access points operating at the respective radio frequencies. The following fields of information are displayed:

    AP Name

    Displays the name of the AP.

    Role

    Pictorial representation of the type of AP.

    • A Primary AP is depicted with a (P) attached to the AP icon.

    • A Mesh Extender is represented by an (E) attached to the AP icon.

    • A Primary Capable AP has no letter attached to the AP icon.

    Type

    Specifies if the AP is a Primary AP, Primary Capable AP, or a Mesh Extender.

    IP Address

    The IPv4 address of the device. By default, this is not visible.

    Model

    Model of the CBW AP. By default, this is not visible.

    Clients

    Number of client devices connected to the AP.

    Usage

    The amount of data that has transferred between AP and the client devices.

    Uptime

    Duration of how long the AP has been powered up.

    Admin Status

    If this is enabled, it displays the configured status of the 2.4GHz / 5GHz Radio.

    Operational Status

    Displays the running status of the 2.4GHz / 5GHz Radio.

    Channel Utilization

    Level of traffic including data and interference over the channel that is assigned on the AP. Interference includes both Wi-Fi and non Wi-Fi signals. A high utilization of a channel, for example above 50%, suggests a high level of interference.

    This includes noise from nearby APs/clients/rogues on the same channel which results in poor client performance. The values are represented in % format.

    By default, this is not visible.

    Throughput (Avg)

    This represents the amount of data that can be transferred from the AP to the client device. By default, this is not visible.

    Channel

    The channel number at which the radio of the AP is broadcasting the signal.

    Transmit Power (Avg)

    The logarithmic power level at which the AP is broadcasting the signal. The values are displayed in decibel-milliwatt (dBm) units.

    Coverage Hole

    Coverage holes are areas where clients cannot receive a signal from the wireless network. A coverage hole is considered to have occurred when client SNRs falls below -80dBm of data RSSI. By default, this is not visible.

    Interference (Avg)

    RF interference involves unwanted, interference of RF signals that disrupt normal wireless operations, that creates potential network latency and poor client performance. Interfering RF signals includes both Wi-Fi and non-Wi-Fi signals. The values are represented in % format.

    Noise

    Noise refers to any energy interference that degrades the quality of a wireless signal. Noise can affect everything from radio transmissions to network speeds. The values are displayed in decibel-milliwatt (dBm) units.

    Rogues

    Any device that shares your channel and is not managed by your CBW network can be considered as a Rogue. By default, this is not visible.

    MAC Address

    The unique physical address of the device.

    Mode

    Displays if the device is in AP Only mode or Mesh mode. By default, this is not visible.

    BSS Color

    Displays the BSS color configured for the corresponding radio. By default, this column is not visible.

  3. Click the down arrow on the top right of the column headers to customize the details displayed in the table. You can choose to hide or show the desired columns, sort them in the order you wish, or filter the table contents based on the desired parameters.

Viewing Access Point Details

Navigate to Monitoring>Network Summary>Access Points.

Click on a specific AP on the Access Point screen to display the Access Point View page. The following details are displayed on the page.

GENERAL

AP Name

The name of the Access Point.

Location

If the physical location is configured, it will show the location. Otherwise, a default location will be shown.

MAC Address

The unique physical address of the device.

Base Radio MAC

The hardware (HW) address of the 2.4GHz and 5GHz radios. The address is the same for both the radios.

IP Address

The IPv4 address is a 32-bit number that uniquely identifies an Access Point.

CDP / LLDP

The name and the port of the switch the AP is connected to.

This field is applicable only for Primary Capable APs. (Those with wired uplinks).

Ethernet Speed

This displays the current link speed of the switch port.

Model / Domain

Model of the AP / radio domains.

Power Status

Indicates the power level and mode of power.

Parent MAC Address

Displays the Parent MAC address (AP to which it is connected wirelessly) This option is available only for Mesh Extenders.

Nearest APs

Displays the top 3 neighbor APs with high link SNR value. For more information see Link SNR (dBM) in Viewing Mesh Extender.

This field is helpful for determining the best location for APs and Mesh extenders during installation. It would also help to troubleshoot connectivity issues.

The nearest AP field also displays Wireless Mesh Extenders.

Serial Number

The unique number provided at the time of manufacturing.

Max Capabilities

The radio domains, spatial streams, and maximum data rates of the Access Point.

Tech Support
  1. Click Start to download the support bundle for individual APs, which includes the AP boot-up logs and configurations. By default, this button is enabled.

  2. Click Download to save the bundle locally. This button will be enabled only after the bundle is generated.

Disable any Pop-up blockers in your browser settings to download the tech support bundle for the AP.

Tech Support Status

View the status of the support bundle generation. The status values are one of the following:

  • Not started: The bundle generation has not been triggered. This is the default status.

  • In Progress: The bundle generation is in progress.

  • Completed: The bundle generation is complete. Download the bundle using Download.

PERFORMANCE SUMMARY

This table provides the following information about the performance of the radios:

Number of clients

The number of client devices connected to a specific AP.

Channels

Channel number from where the AP radio is broadcasting the signal.

Number of channels will be 1, 2 and 4 for 20MHz, 40MHz and 80MHz respectively.

Configured Rate

The default minimum and maximum data rates of the AP.

Usage Traffic

The amount of data that has transferred between APs and the client devices.

Throughput

This shows the amount of data that can be transferred from the AP to the client device.

Transmit Power

The logarithmic power level at which the Access Point is broadcasting the signal.

Noise

Noise refers to any energy interference that degrades the quality of a wireless signal. Noise can affect everything from radio transmissions to network speeds.

Channel Utilization

This is the level of traffic including data and interference over the assigned channel on the AP. Interference includes both Wi-Fi and non Wi-Fi signals.

The high utilization of a channel, for example above 50%, suggests high level of interference including noise from nearby APs/clients/rogues on the same channel which results in poor client performance.

Interference

RF interference disrupts normal wireless operations and can cause network latency and poor performance. Interfering RF signals includes both Wi-Fi and non Wi-Fi signals.

Traffic

Shows the percentage of channel utilization traffic in 2.4GHz and 5GHz radios.

Admin Status

Status of the Radios for 2.4GHz and 5GHz.

Interferer Detection

Status of interferer detection for 2.4GHz and 5GHz radios.

AP {Name} DETAILS

This table provides the following details specific to the Access Point.

CLIENTS

This table shows details about the clients that are connected to the AP. For field details, refer to Viewing Client Details.

RF TROUBLESHOOT

Displays a visual representation of parameters that can affect the radio performance of the AP, such as:

  • NEIGHBOR AND ROGUE APS: Displays the Neighbor and Rogue APs on the current and adjacent channels for a given radio and the signal strength they are heard. This visualization allows you to quickly identify neighbor and rogue APs that are causing interference and reducing the overall RF performance for the cell.

  • CLEAN AIR INTERFERERS: Displays the sources of non Wi-Fi interferers and their severity on the current and adjacent channels for a given radio. This visualization allows you to quickly identify non Wi-Fi sources of interference that are reducing the overall RF performance for the cell.

  • CLIENT DISTRIBUTION ON TOP NEIGHBOR APS: Displays the top 5 neighbor AP with signal strength greater than −70dBm on the APs current client serving channel (2.4GHz and 5GHz). Tx power and number of clients associated to this AP and its neighbor APs are shown. Number of clients is not available for neighbor APs on different Primary AP.

  • CLIENT DISTRIBUTION BY DATA RATES: Each client's throughput varies depending on the data rate it is using (802.11 a/b/n/ac) at any given point in time, and this data rate may vary every second. Various factors such as RSSI values, RF interference, etc. may affect a client device's instantaneous data rate.

SPECTRUM INTELLIGENCE

By default, Spectrum Intelligence (SI) is disabled in order to reduce the CPU cycles and increase the performance.

Ensure that you enable the Interferer detection globally under Advanced>RF Optimization in Expert View.

Enable the SI for the radio with the following steps:

  1. Navigate to Wireless Settings >Access Points and select an AP.

  2. Click Edit and choose either 2.4GHz or 5GHz radio.

ACTIVE INTERFERERS

Displays the Active Interferers of the Access Point for the selected radio. For further details of the table refer Viewing Details of Interferers under Viewing Interferers.

NON WI-FI CHANNEL UTILIZATION

Displays the Non Wi-fi Channel Utilization for the Access point of the selected radio.

INTERFERENCE POWER

Shows the interference power for the AP on the selected radio.

TOOLS

This section of the UI consists of options to configure the LED states of the access points and also provides details of the image in the description table.

AP LED DISABLE

Use this tool to disable the LED on the AP. For more information, refer to LED Display Settings.

BLINK AP LED

This tool changes the AP LED to blink Red/Green for 60 seconds. This is used to identify the AP. For more information refer to LED Display Settings.

RESTART AP

You can reload AP if needed. The Primary AP does not have this option.

INTERCHANGE IMAGE

You can swap the primary version and backup version of the image. This will take effect only after the AP reloads.

FACTORY DEFAULT

You can reset the AP to factory default settings if required. The AP that currently acts as the Primary AP does not have this option.

To reset Primary AP to factory defaults refer to Clearing the Primary AP Configuration and Resetting to Factory Defaults.

EXPORT CONFIG

You can download the running configuration of the AP to .TXT file format. By default the file is saved as AP<macaddress>_config.txt in your downloads folder. This option is available for the Primary AP and all the APs associated with the Primary AP. See below for a sample AP Configuration file.

Sample AP Config file

APModel: CBW150AX-E
APLocation: default location
APMode: 7
APRole: Root
IPConfigMode: 0
IsBridgeAP: 1
NextPrimaryAP: 00:00:00:00:00:00
IsPreferredPrimary: 0
RogueDetectionStatus: 0
Radio0_AdminStatus: 1
Radio0_ChannelWidth: 20 MHz
Radio0_Channel: Automatic
Radio0_TransmitPower: 100
Radio0_InterfererDetection: 0
Radio1_AdminStatus: 1
Radio1_ChannelWidth: 80 MHz
Radio1_Channel: Automatic
Radio1_TransmitPower: 100
Radio1_InterfererDetection: 0
MeshRole: 1
MeshBackhaulSlot: 1
InstallMapping: 1
BridgeType: Indoor
BridgeGroupName: 00_sasi
BackhaulInterface: 802.11a/n/ac
StrictMatchBGN: 0
EthernetBridge: 1
EthernetLinkStatus: UP

For more AP Config file details see: Access Point Configuration Files.

IMPORT CONFIG

Select this option to upload the configuration file (in .TXT file format) of the AP. The configuration should match the AP model. This option is available for the Primary AP and all associated APs.

You can also track the status of the configuration file uploaded in the TOOLS section above.

  • Non-mesh configuration files should not be imported to Mesh deployment APs.

  • After uploading the configurations to the AP, it normally takes 1-2 minutes to take effect. You can also see the LED of the AP change from solid/blinking green to blinking green while applying the configurations. It will change back to blinking blue once the upload is complete.


Note


The Export/Import Config options in the Access Points page is specific to a particular AP. If you want to change the configuration for the entire CBW network, refer to Export and Import Primary AP Configuration.

PACKET CAPTURE

Using this option, you can capture the packets in the specified interface and for the specified protocol. Packet capture is supported on Wired Interfaces as well as the internal Primary AP interface responsible for communication between management functions and access points. Supported protocols are IP, TCP, and UDP. This option is available only in Expert View.

The following are the configurations required for starting the capture.

  • INTERFACE – Choose the whether the capture should be taken in Wired interface or Primary AP interface.


    Note


    Primary AP interface is available only for the AP acting as Primary AP.


  • WIRED INTERFACE – Select the required Ethernet port. Based on the AP model, supported wired interfaces will be populated automatically.

    CBW Model

    No. of Ethernet Ports

    CBW150AX

    1

    CBW151AXM

    0

  • PROTOCOL – Select the required protocol for starting the capture. Supported protocols are IP, UDP, TCP.

  • START/STOP – Button to Start/Stop the capture for the configured Interface and protocol

  • DOWNLOAD – Once the capture is stopped, the pcap file will be ready for download. By clicking on the Download button, the PCAP file will be saved to the local machine. By default, the PCAP file is saved as AP<macaddress>_capture.pcap

You can also view the status of capture on top of the pane.


Note


  • CBW151AXM does not support packet capture feature as it does not have ethernet ports.

  • The “Primary AP” capture will be visible only for AP which is currently acting as the Primary AP.


Limitations:

  • The maximum allowed pcap size is 5MB, after which the ongoing capture automatically stops and the pcap file can be downloaded locally by clicking on the Download button.

  • Only one capture is allowed to run in single point of time. If the user is attempting to start the capture in one AP while the capture is in progress on other AP, a warning message will be displayed in CBW UI.

SYSLOG

Using this option, you can collect per AP logs by configuring the Syslog server IP, logging level for individual APs.

  • SYSLOG SERVER IP – IP Address of the Syslog Server running in the network.

  • LOG SYSLOG LEVEL – Sets the Logging level up to which the logs would be sent to the Syslog Server. By default, the log syslog level is set to Notifications (5).

    The available logging levels:

    • Emergencies (0)

    • Alerts (1)

    • Critical (2)

    • Errors (3)

    • Warnings (4)

    • Notifications (5) (Default)

    • International (6)

    • Debugging (7)

    Messages with a severity equal to or less than the set level are sent to the syslog server.

  • LOGGING – Option to Enable/disable the Logging for individual AP. By default, the logging is Disabled. If the logging is enabled, the syslog messages will be sent to the configured Syslog server else the messages will not be sent to the Syslog Server.


Note


  • This configuration is available for all APs (Mesh Extenders, Primary AP, Primary Capable APs).

  • Syslog Server IP configured for each AP can be same/different.

  • By default, Syslog Server IP would be configured as broadcast (255.255.255.255), Level will be set to Notifications

  • To capture the Primary AP logs:

    • Configure the Syslog Server details under Advanced > Logging > Add Syslog Server.

    • Set the Logging level under Advanced > Logging > Log Syslog Level.


Viewing Client Details

To open and view information about a specific client follow the steps below.

Information about all the active clients is displayed in the Active Clients summary section. These clients are either 802.11b/g/n clients operating at 2.4GHz, or 802.11a/n/ac clients operating at 5GHz.

  1. Navigate to Monitoring>Network Summary.

    You can also view this page by navigating via Monitoring>Network SummaryClients.

  2. In the Active Clients summary section, click the count display icon to view high-level details of the client device or navigate to Monitoring>Network Summary>Clients. This section will give you an overview of the connected clients and its parameters.

In the Clients page, there are three blocks that list the following information.

Clients

This tile shows the number of clients currently connected.

Wireless

This tile displays the number of clients for the 2.4GHz and 5GHz radio.

Apple

This tile displays the number of clients that are connected to Apple clients. It also includes more information as defined below.

  • Fastlane: This tile displays the number of clients using Fastlane. Fastlane allows iOS apps connected to CBW access points to be prioritized.

    This means your voice, video, and real-time data gets to be first in line. To enable Fastlane go to Wireless Settings>WLANs>Add/edit WLAN>Traffic Shaping>Fastlane.

  • Analytics: This tile displays the number of analytics-capable clients.

Client Details Table

Click the down-arrow on the top right of the column headers to customize the details displayed in the table. You can choose to hide, show, or rearrange columns, sort, or filter the table contents based on the desired parameters.

User Name

The user name of the client connected to the Primary AP (Default: Unknown).

IPv4 Address

The IPv4 address is a 32-bit number that uniquely identifies the client device.

AP Name

The configured AP name to which the client associated will be displayed in this column.

Protocol

The Wi-Fi standard through which the client is connected. It can be 802.11a/b/g/n/ac.

Hostname

The MAC address of the client is displayed by default. Enable Wireless Settings > Add/Edit WLAN > Local Profiling to view the hostname of the supported clients.

Client Type

The client’s operating systems will be displayed in this column as Android or an Apple Device.

Connection Speed

The maximum data rate strength of the client connected to the access point. The values are displayed in units of Mbps.

Status

The active status of the client.

Signal Quality

Signal quality is a value ranging from 0 to 100dB. This includes the noise generated by interference sources and the signal strength.

Signal Strength

Signal strength is the wireless signal power level received by the wireless client. Strong signal strength results in more reliable connections and higher speeds. Signal strength is represented in -dBm format, ranges from 0 to -100dBm. The closer the value to 0, the stronger the signal.

Usage

The amount of data consumed by the client.

WLAN SSID

Shows to which SSID the client has connected.

Uptime

The duration of how long the client is connected to the access point.

MAC Address

The MAC hardware address of the connected client.

Frequency Bandwidth

The radio on which the client is connected 2.4GHz or 5GHz.

WLAN Profile

The profile name of the configured WLAN connected to the client.

AP MAC

Radio MAC address of the corresponding access point to which the client is connected.

AP Group

This column shows the access points groups to which it is configured.

IPv6 Address

The IPv6 address of the client device.

Client View

Select a client from the list to display the following details.

User Name

The user name of the client connected to the Primary AP (Default: Unknown).

Hostname

The MAC address of the client is displayed by default. Enable Wireless Settings>Add/Edit WLAN>Local Profiling to view the hostname of the clients supported.

MAC Address

The MAC hardware address of the connected client.

Deauthenticate

Click this green button next to the MAC address to disconnect the client.

Deauthenticating the client removes a client from the WLAN, but that client will be able to rejoin unless their MAC address is added to the Blocklist.

To block the client permanently do the following:

  1. Navigate to Wireless Settings>WLAN UsersLocal MAC Addresses.

  2. Click Add MAC address.

  3. Select the type Blocklist.

  4. Click Apply & Save.

Uptime

The duration of how long the client is connected to the access point.

SSID

Shows the SSID connected to the client.

AP Name

The configured AP name associated to the client. To configure the AP name and location, navigate to Wireless Settings>Access Points.

Nearest APs

List of APs near the client based on signal strength.

Device Type

The client’s operating systems is displayed in this column as an Android or Apple Device.

Performance

This shows the performance by Signal Strength, Signal Quality, Connection Speed, and Channel Width.

Capabilities

This gives information on which domain the client is associated to the AP and its Spatial Stream.

Cisco Compatible

Cisco Compatible state changes only when a Cisco client (which supports CCX extensions of the IEEE standards) is associated to your AP.

Client connection score

Connection score is the connection quality between client and the access point displayed as a percentage. It indicates the current client data transfer speed. The higher the percentage, the faster the data is being transferred. This value is based on the Client Actual Rate divided by either the Client Max Capability or Max AP Configured (whichever is lower).

CONNECTIVITY

This line graph represents the stages and current status of the associated client as in the Start, Association, Authentication, DHCP, and Online stages.

TOP APPLICATIONS

The top applications that are being used by the client device are presented in a graphical or tabular format. To use this, enable AVC in Wireless Settings > WLANs>Add/Edit WLAN>Traffic ShapingApplication Visibility Control.

To view this data make sure the Application Visibility Control (AVC) is active.

MOBILITY STATE

This shows the graphical flowchart of stages on how the client is connected to the Primary AP. You can open the graph or table to view the following information:

  • Name of the Primary AP, with its IP address and the model number of the AP on which it is running.

  • Name of the AP client connected to the Primary AP, including the IP address, and model number.

  • Nature of the connection between the AP and the client. (For example, a wireless 802.11n 5GHz connection.)

  • Name and type of client (such as Microsoft Workstation), VLAN ID and IP Address of the client.

NETWORK AND QOS

This shows client capability of some IEEE standards and user-configured parameters such as:

  • IP address

  • VLAN

  • Source Group Tag

  • Fastlane Client

  • Mobility Role

  • WMM

  • U-APSD

  • QoS Level

SECURITY & POLICY

This table shows the encryption type and security policies on the client associated to the access point such as:

  • Policy (WPA2 or WPA3)

  • Cipher

  • Key Management

  • EAP Type

  • ACL (IP/IPv6)

  • mDNS

  • AAA Role

  • User Authenticated by

Viewing Guest Client Details

The clients that are connected to the Guest WLANs are known as Guest Clients. To obtain Guest WLANs, the Primary AP provides guest user access on WLANs specifically designated for use by guest users. For details on creating a guest client refer to Creating a Guest User Account.

  1. Navigate to Monitoring > Network Summary > Guest Clients to display a summary of all active guest clients.

    These clients are either 802.11b/g/n clients operating at 2.4GHz or 802.11a/n/ac clients operating at 5GHz.

  2. Click on the guest client from the list in the table to view the guest client details. For a description of the parameters displayed for a guest client, refer to Viewing Client Details.

Two tiles display a summary of the number of guest clients and recently connected clients to the Primary AP. Each guest client detail can be viewed by clicking the specific client record.

Guest Clients / Recent Clients

Displays the number of guest clients and recent clients connected to the network.

Wireless

Specifies the number of 802.11b/g/n guest clients connected and operating either at 2.4GHz or 5GHz.

Click the down-arrow on the top right of the column headers to customize the details displayed in the table. You can choose to hide, show, or rearrange columns, sort, or filter the table contents based on the desired parameters.


Note


You can export CBW connected guest details and download them in Excel format using the Save icon in the Guest Widget.


Troubleshooting a Client

This section describes in detail how to perform a client ping test and a connection test. These help to effectively investigate and troubleshoot connection issues.

To troubleshoot wireless client joining issues:

  • Set the Logging level as Notifications to (5).

  • Check the logs in the Primary AP UI under Management > Logging.

Perform a Client Ping Test

Perform a ping test on the client to determine the latency, or delay between the Primary AP and the client. This is an Internet Control Message Protocol (ICMP) based test. Using the ping test will tell you the connectivity as well as the latency between the Primary AP and the client.

To start the ping test follow the steps below.

  1. Navigate to Monitoring>Network Summary>Clients.

  2. Select the name of the client from the table.

  3. Scroll down to the bottom of the Client View screen, and click the Ping tab.

  4. Click Start to begin the test. The latency in milliseconds is represented graphically.

Perform a Connection Test

Perform a connection test when the client fails to connect to a particular WLAN. This test takes about three minutes. Attempting to connect during the three minute test period will generates diagnostic information to aid in troubleshooting connection issues.

The results of the client connection establishment with the WLAN is displayed at each stage.

Procedure


Step 1

Navigate to Monitoring>Network Summary>Clients.

Step 2

Click on the client MAC address that you want to debug.

Step 3

Scroll down to the Client Test and click Start in the Connection tab.

Step 4

Now disconnect the client from the WLAN and try re-connecting.


Generate an Event Log

Perform a complete debug session by enabling the Event Log feature that is available in the per client view tab. The Event Log testing contains the time-stamp and message details that are exchanged between the client and the Access Point. The message type helps to analyze and conclude if a client is able to successfully join a WLAN or a reason for its failure.

Following is a sample output of a generated event log.

Procedure


Step 1

Navigate to Monitoring > Network Summary > Clients.

Step 2

Click on the MAC address of the client that you want to debug.

Step 3

Scroll down to Client Test, and in the Event Log tab click the Start option.

Step 4

Now disconnect the client from the WLAN, and try to re-connect it again.

Step 5

Save the results by selecting the Save to Disk option in the Primary AP UI.


Viewing Mesh Extender

When you need to look at the details of a particular Mesh Extender, navigate to Monitoring > Network Summary > Mesh Extender > > .

In the Mesh Extender page, you can view the following details.

AP name

The name of the Mesh Extender.

AP Model

The model of Mesh Extender.

Ethernet MAC

The hardware MAC address of the Mesh Extender.

Parent AP Name

The AP name to which the Mesh Extender has joined wirelessly.

Hop

The count of how far the Mesh Extender is operating from the Primary AP.

Link SNR (dBM)

The signal to noise ratio calculated between the Mesh Extender and the Primary AP.

Channel Utilization (%)

Level of traffic including data and interference over the channel that is assigned on the AP. The values are represented in % format.

Channel

Channel number where the Mesh Extender’s radio is operating.

Clients

Number of clients connected to this Mesh Extender.

Viewing Applications

Click the Applications menu to view the Top 10 applications used in client traffic. To see the usage, enable the Application Visibility Control (AVC) option in at least one WLAN.

  1. Navigate to Wireless Settings > WLANs > Add/Edit WLAN > Traffic Shaping > Application visibility Control.

  2. Select Enabled in the Application Visibility Control drop-down menu.

Viewing Rogue Access Points

Any device that shares your channel and is not managed by you is considered a Rogue. This includes Rogue Access Points, Wireless Routers, and Rogue clients. CBW APs have the built-in intelligence to detect rogue devices in both 2.4GHz and 5GHz radios.

The Rogue AP and Rogue Client Detection is Disabled on CBW APs by default. To enable Rogue Client Detection:

  1. Navigate to Wireless Settings > Access Points.

  2. Click the edit icon next to the AP you want change.

  3. Click the Rogue Detection toggle button in the General tab.

  4. Click Apply to save and exit.

After applying the changes, Rogue detection will be enabled, and any Rogue APs will be reported to the Primary AP.

To see any Rogue APs on your network, navigate to Monitoring > Rogues > Access Points. The screen displays the following details of rogue devices which includes unmanaged neighboring Clients and Access Points.

Click on the tiles at the top of the page to filter the list of Rogue Access Points by:

  • 2.4GHz / 5GHz

  • Unclassified

  • Friendly

  • Malicious

MAC Address

MAC address of the Rogue AP.

SSID

The name of the SSID, using which the Rogue AP is broadcasting.

Channels

The channel in which the Rogue AP is operating.

Detecting APs Count

Displays the number of APs where the Rogue AP is detected.

Clients

Number of clients connected to the Rogue AP.

State

Displays the state of the Rogue AP. If the Rogue AP class is friendly, the state will be Internal or External, or the state will be Alert.

Class

The class of the Rogue AP. By default, all the Rogue APs are unclassified. You can change the class of Rogue APs to Friendly, or Malicious.

Following are the classes that are supported by the CBW:

Unclassified

The CBW AP discovers all the Rogue APs and marks them under the Unclassified class by default. Also, the status of the Rogue AP remains as Alert since it remains unknown to the CBW network.

Friendly

You can move the Rogue AP to a Friendly state if you know the MAC address of the Rogue AP.

Following are the options that are configurable:

  • Internal—If the unknown Access Point is inside the network and poses no threat to WLAN security, you would manually configure it as Friendly, Internal.

    Example: An Access Point that exists within your premises.

  • External—If the unknown Access Point is outside the network and poses no threat to WLAN security, you would manually configure it as Friendly, External.

    Example: An Access Point that belongs to a neighboring coffee shop.

Malicious

You can move the Rogue AP to Malicious class when you do not know the particulars of the AP. By default, the status remains as Alert since it remains unknown to the CBW network.

Configuring the Rogue AP States

Procedure


Step 1

Click Monitoring > Network Summary.

Step 2

Click on the Access Points in the Rogues tab.

Step 3

Click on one of the available Rogue APs that is detected by the CBW.

Step 4

Select the appropriate class in the Update class drop-down list box.

Step 5

Select the class as Friendly to configure the status as Internal or External. If you specify the AP as Malicious class, then the status of the AP remains as Alert

Step 6

You can also move an AP from one state (such as Friendly) to another (such as Malicious) by selecting the AP from the specific tabs.

Step 7

Click Apply to save the changes.


Viewing Rogue Client Details

Navigate to Monitoring > Rogues > Clients in Expert View.

Clients that are associated to Rogue APs are displayed along with the following details:

MAC address

Rogue client’s MAC address.

AP MAC

MAC address of the AP to which the Rogue client is connected.

SSID

Displays the SSID connected to the client.

Radios

Displays the number of radios in the Rogue client.

Last Seen

Shows the time the Rogue client was detected.

State

Displays the state of the Rogue client.

Wired

Specifies if the detected Rogue client is Wired or Wireless.

Viewing Interferer Details

Interferers are non Wi-Fi devices that cause disruption to your wireless network. They may either be operating at 2.4GHz or at 5GHz. To view these devices, do the following:

Procedure


Step 1

Click Monitoring > Network Summary > Interferers.

A summary of all non Wi-Fi interfering devices is displayed in the Interferers summary window. These interferers may either be operating at 2.4GHz or at 5GHz.

Step 2

In the Interferers summary window, click the count display icon. The following details are displayed.

  • AP Name: The name of the Access Point where the interference device is detected.

  • Radio Slot: Slot where the radio is installed.

  • Interferer Type: Type of the interferers such as Microwave Oven, Jammer, WiMax Mobile, and so on

  • Affected Channel: Channel that the device affects.

  • Detected Time: Time at which the interference was detected.

  • Severity: Severity index of the interfering device.

  • Duty Cycle (%): Proportion of time during which the interfering device was active.

  • RSSI: Receive signal strength indicator (RSSI) of the Access Point.

  • Dev ID: Device identification number that uniquely identified the interfering device.

  • Cluster ID: Cluster identification number that is unique which identifies the type of the device.

Note


Ensure that you enable the Interferer detection globally under Advanced > RF Optimization (in Expert View).

Navigate to Wireless Settings > Access Points and select an AP. Click Edit and choose either 2.4GHz or 5GHz radio.


Wireless Dashboard

This page displays the capabilities of AP and the Client for 2.4GHz and 5GHz. Click the Close widget icon on the top right of the widgets that you want to remove. To add the widget click the icon.

AP CAPABILITY

Displays the capability details for the APs managed by the Primary AP:

Max Configured Connection Rates

Displays the graph and table for maximum configured connection rate in Mbps.

These are mapped to different ranges for both the radios (2.4GHz and 5GHz) for all APs configured by the Primary AP.

AP Distribution by Channel Width

Displays the maximum configured Channel Width for all the APs configured by the Primary AP.

CLIENT CAPABILITY

Displays the capability data for the clients managed by the Primary AP:

Client Capability by Spatial Stream

Displays the graph and table for the number of clients capable of a particular spatial stream for all the clients connected to the Primary AP.

Client Capability by Max Protocol

Displays the graph and table for the number of clients based on the maximum data rate protocol supported for all the clients connected to the Primary AP.

AP PERFORMANCE-CHANNEL UTILISATION

Display the Performance details for the APs managed by the Primary AP:

Channel Utilization

Displays a graph and table for channel utilization as a percentage on all APs configured by the Primary AP. This is mapped to different ranges for each of the 2.4GHz and 5GHz radios.

CLIENT PERFORMANCE

Displays the connected characteristic for the clients managed by the Primary AP:

Client by Connection Score

Displays the connection score percentages ranges for all clients connected to the Primary AP. The Connection Score is calculated as a percentage value based on the Client Actual Rate divided by either Client Max Capability or Max AP Configured (whichever is lower).

This ensures the Connection Score is always calculated based on the maximum possible rate and the maximum rate capability of each device.

Client by Connected Protocol

Displays the graph and table for the number of clients based on the connected protocol for all the clients connected to the Primary AP.

AP DISTRIBUTION

Displays the distribution of APs managed by the Primary AP:

AP distribution by Model

Displays the graph and table for all APs configured by the Primary AP. The graph and table is updated based on the Model name of the AP to the radios (2.4GHz and 5GHz).

AP distribution by SpatialStream

Displays the graph and table for all APs configured by Primary AP. The graph and table is updated based on the SpatialStream that is connected for each of the radios (2.4GHz and 5GHz). The center of the donut displays the maximum number of APs with the particular SpatialStream.

Customizing the Access Point Performance View

You can customize the AP Performance view by adding or removing the widgets.

You can view the statistics below in both 2.4GHz and 5GHz type of radios by clicking directly on them.

Widgets Description

CHANNEL UTILIZATION

-TOP APS

This shows the level of traffic including data and interference over the channel that is assigned on the AP. Interference includes both Wi-Fi and non Wi-Fi signals.

High utilization of a channel, for example above 50% suggests a high level of interference including noise from nearby APs/clients/rogues on the same channel. This causes poor client performance.

Click to view the AP detail.

INTERFERENCE

-TOP APS

RF interference involves unwanted, interference of RF signals that disrupt normal wireless operations which creates potential network latency and poor client performance. Interfering RF signals includes both Wi-Fi and non Wi-Fi signals.

Click to view the AP detail.

CLIENT LOAD

-TOP APS

Load indicator displays the current number of connected clients on each access point. A higher load may impact performance. Use client load balancing to improve client distribution on the wireless network.

COVERAGE

-BOTTOM APS

Coverage holes are areas where clients cannot receive a signal from the wireless network. A coverage hole is considered to have occurred when client SNRs fall below a predetermined level. A coverage hole event is when several clients are stuck in the same coverage hole.

AP Join Failure Status

This widget shows the number of APs that failed to join the Primary AP and the associated error types during a specific day, week or month. Click a specific join error to see the APs that have failed to join the Primary AP with the associated error type.

Click the setting to clear the AP Join statistics.

Adding or Removing a Widget

Procedure


Step 1

Open Monitoring > Wireless Dashboard > AP Performance.

Step 2

To add a widget, click the icon on the top right of the AP Performance window.

Step 3

To remove a widget, click the icon on the top right of the widgets that you want to remove.

Step 4

Select from the widgets shown below:

  • Channel Utilization: Top APs

  • Interference: Top APs

  • Client Load: Top APs

  • Coverage: Bottom APs

  • AP Join Failure Status: Bottom APs

Note

 
  • Top APs are APs with the maximum client load.

  • Bottom APs are APs with low SNR values for the client.

Step 5

Click Close. The AP Performance window is refreshed with your changes.


Customizing the Client Performance View

You can customize the Client Performance view by adding or removing the widgets.

Table 1. Client Performance
Numbers & Labels Description

Signal Strength

Strong signal strength results in more reliable connections and higher speeds. Signal strength is represented in -dBm format, ranges from 0 to -100dBm. The closer the value to 0, the stronger the signal. Click to get a summary of clients.

Connection Rate

Each client's throughput varies depending on the data rate used (802.11 a/b/n/ac) at any time, and this data rate may vary every second. Various factors such as RSSI values, RF interference, and so on, may affect a client device's instantaneous data rate.

Signal Quality

Signal quality is a value ranging from 0 to 100dB. This includes the noise generated by interference sources and the signal strength.

Client Connections

Displays clients associated with the access points of any connectivity types.

Adding or Removing a Client Widget

Procedure


Step 1

Open Monitoring > Wireless Dashboard > Client Performance.

Step 2

Click the icon on the top right of the Client Performance window.

Step 3

To remove a widget, click the icon on the top right of the widgets that you want to remove.

Step 4

Select the widgets you want to add:

  • Signal Strength

  • Signal Quality

  • Connection Rate

  • Client Connections

Step 5

Click Close. The Client Performance window is refreshed with the new widgets.