Cisco Unified CDR Analysis and Reporting Administration Guide, Release 10.0(1)
Bias-Free Language
The documentation set for this product strives to use bias-free language. For the purposes of this documentation set, bias-free is defined as language that does not imply discrimination based on age, disability, gender, racial identity, ethnic identity, sexual orientation, socioeconomic status, and intersectionality. Exceptions may be present in the documentation due to language that is hardcoded in the user interfaces of the product software, language used based on RFP documentation, or language that is used by a referenced third-party product. Learn more about how Cisco is using Inclusive Language.
- Updated:
- November 27, 2013
Chapter: CAR device reports results
- Gateway detail report results
- Gateway summary report results
- Gateway and route utilization report results
- Hunt pilot summary report results
- Hunt pilot detail report results
- Conference call detail report results
- Conference bridge utilization report results
- Voice messaging utilization report results
- Trunk utilization report results
- Related topics
- Additional documentation
CAR device reports results
This chapter describes report output information for each device report. The chapter contains the following topics:
- Gateway detail report results
- Gateway summary report results
- Gateway and route utilization report results
- Hunt pilot summary report results
- Hunt pilot detail report results
- Conference call detail report results
- Conference bridge utilization report results
- Voice messaging utilization report results
- Trunk utilization report results
- Related topics
- Additional documentation
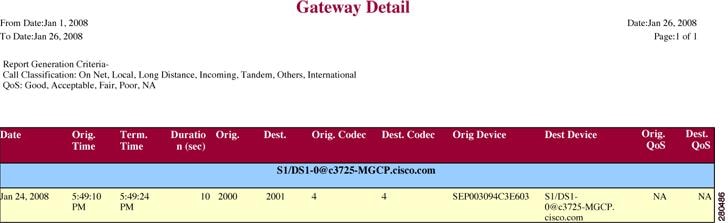
Gateway detail report results
The Gateway Detail report includes the following fields. See the table.
Figure 1 displays sample output of the Gateway Detail Report in PDF format.
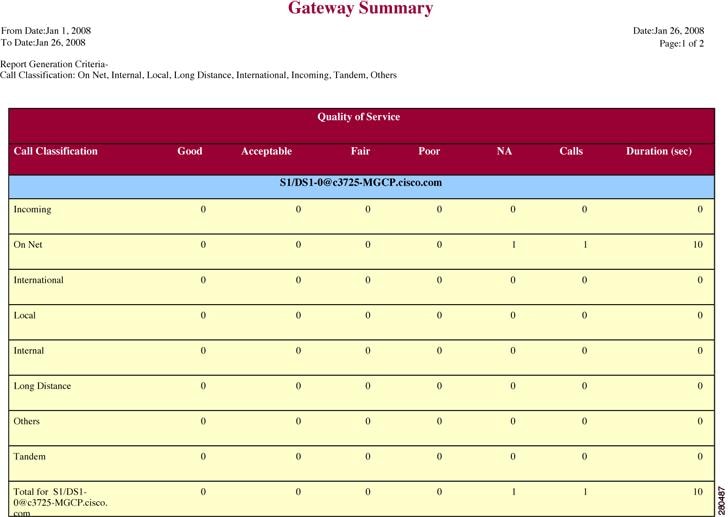
Gateway summary report results
The Gateway Summary report includes the following fields. See the following table.
 Note |
The Gateway Summary report segregates calls for each call classification that the user selects and divides the calls based on QoS type. |
| Shows a summary of the performance of the various gateways with the total number of calls for each voice-quality category. The parameters set in the Define QoS Values provide the basis for all voice-quality categories.
|
|
| Shows the total calls for the particular call classification. |
|
| Shows the total duration for all the calls for the particular call classification. |
The following figure displays sample output of the Gateway Summary Report in PDF format.
Gateway and route utilization report results
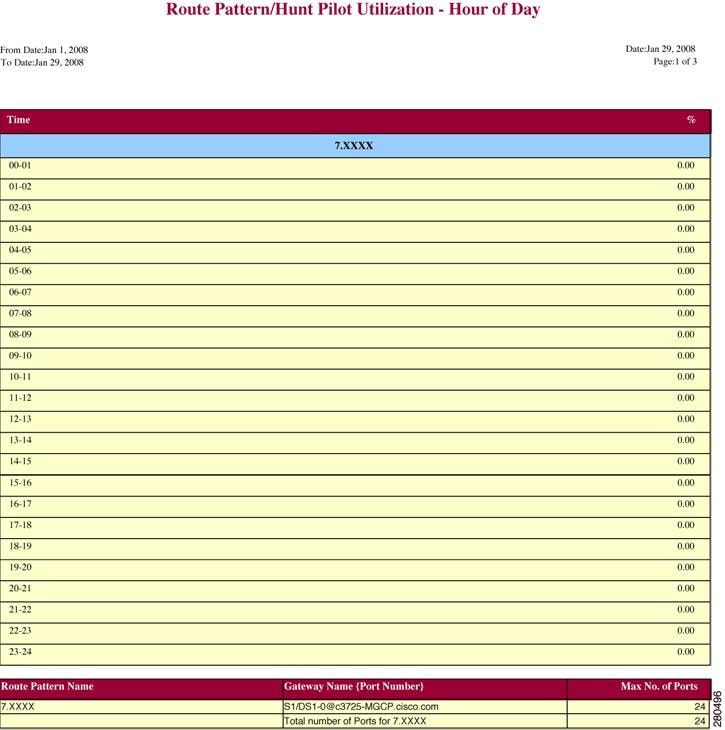
The Gateway, Route Group, Route List, and Route Pattern Utilization reports provide similar output. If you choose to display the report in PDF format, the report shows the utilization as a bar chart. A graph displays for each selected gateway or route group. See the table.
Figure 1 displays sample output of the Gateway Utilization Report in PDF format.

Figure 2 displays sample output of the Route/Hunt List Utilization report in PDF format.
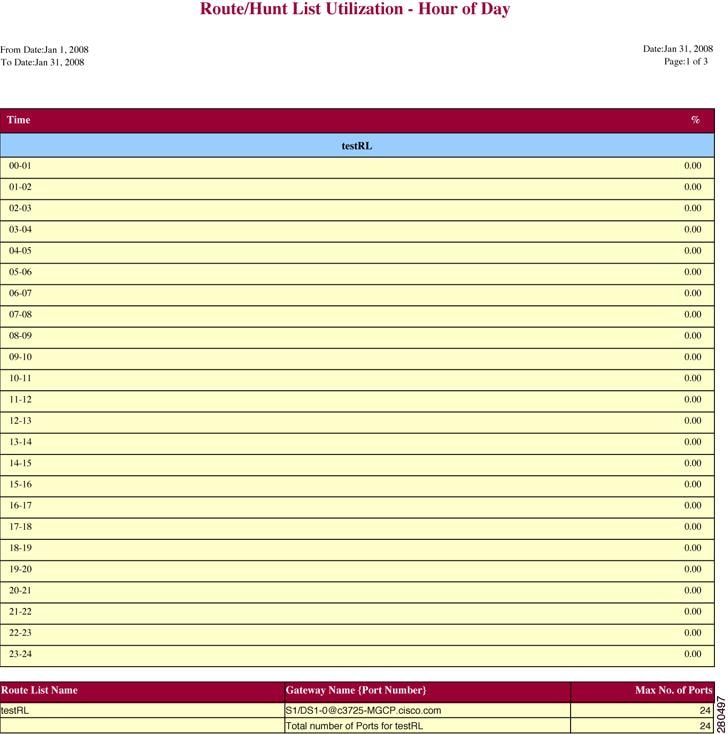
Figure 3 displays sample output from the Route and Line Group Utilization report in PDF format.
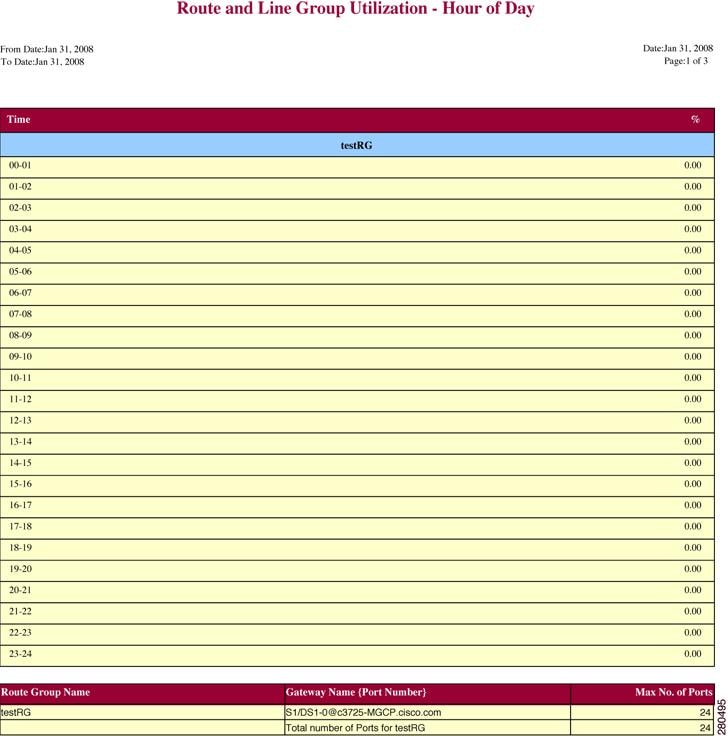
Figure 4 displays sample output of the Route Pattern/Hunt Path Utilization report in PDF format.
Hunt pilot summary report results
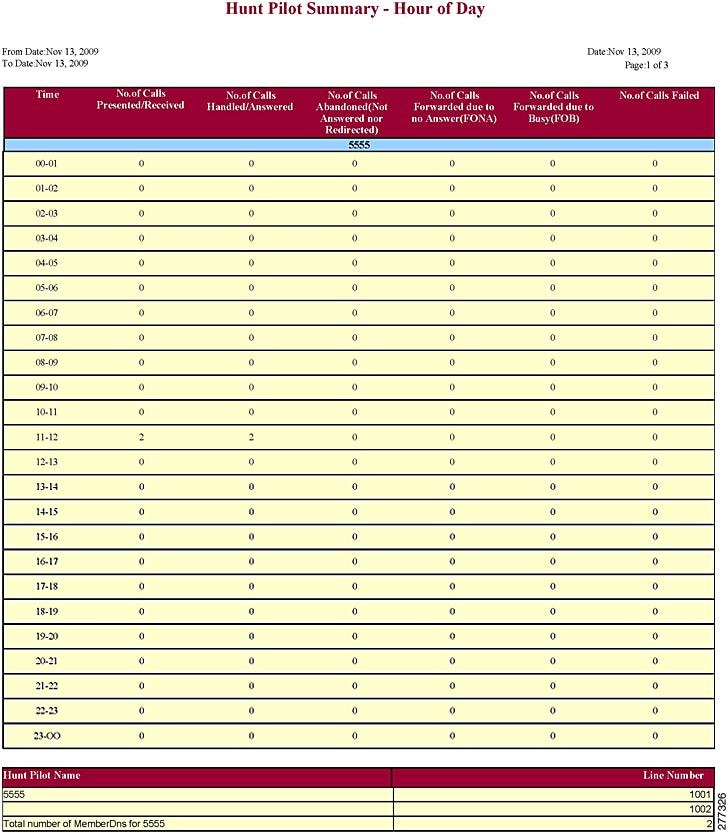
The Hunt Pilot Summary report includes the following fields. See the table.
Figure 1 displays sample output of the Hunt Pilot Summary report in PDF format.
Hunt pilot detail report results
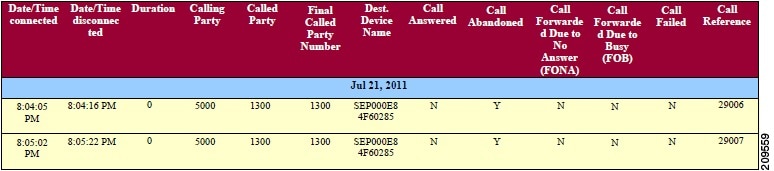
The Hunt Pilot Detail report includes the following fields. See the table.
Figure 1 displays sample output of the Hunt Pilot Details report in the PDF format.
Conference call detail report results
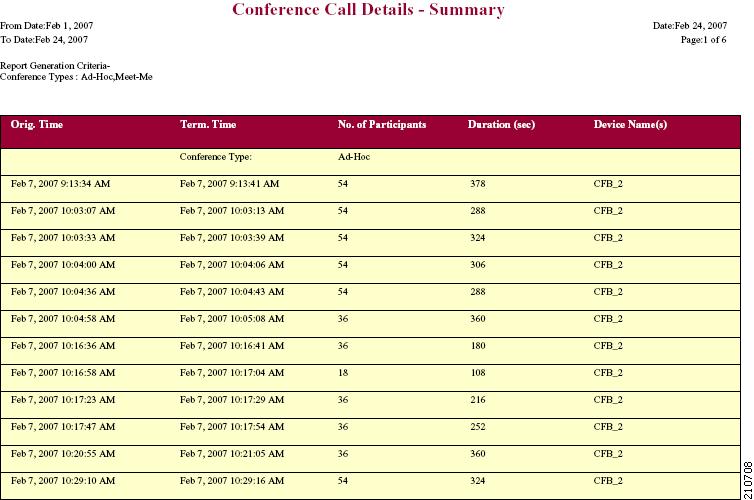
You can choose to generate Conference Call information in either a summary or a detailed report. The reports display the call details in a table when you generate the report in PDF format. The following tables show the fields in the Conference Call Detail and Summary reports. See the tables.
Note |
The report criteria include the type of conference (ad hoc and/or meet-me) and the From and To date range. |
| Sum of the duration of individual participants in the conference in seconds. |
|
| Time at which conference participants connected to conference. |
|
| Time at which conference participants disconnected from conference. |
|
Figure 1 displays sample output of the Conference Call Details Summary report in PDF format.
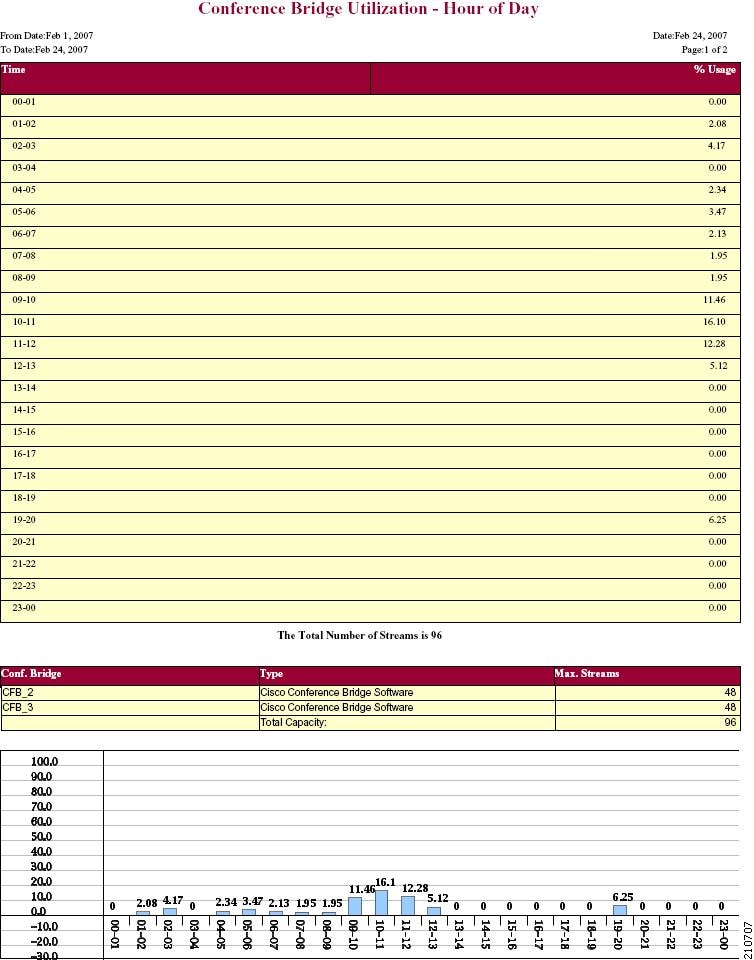
Conference bridge utilization report results
The Conference Bridge Utilization report provides the following fields. If you choose PDF format, the report shows the utilization as a table. See the table.
Figure 1 displays sample output of the Conference Bridge Utilization report in PDF format.
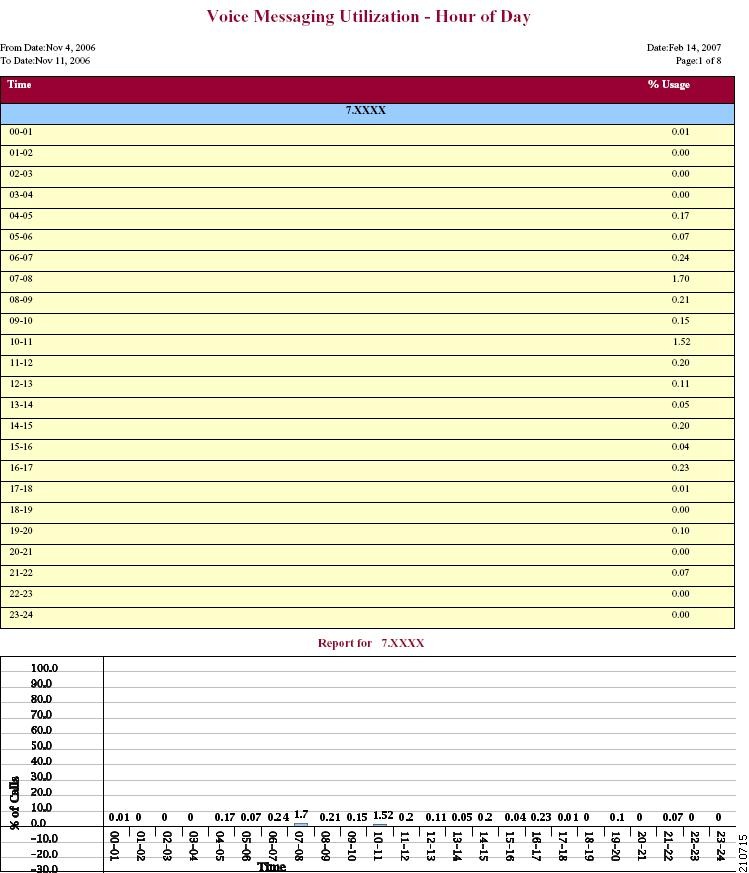
Voice messaging utilization report results
The Voice Messaging Utilization report provides the following fields. See the table.
Figure 1 displays sample output of the Voice Messaging Utilization report in PDF format.
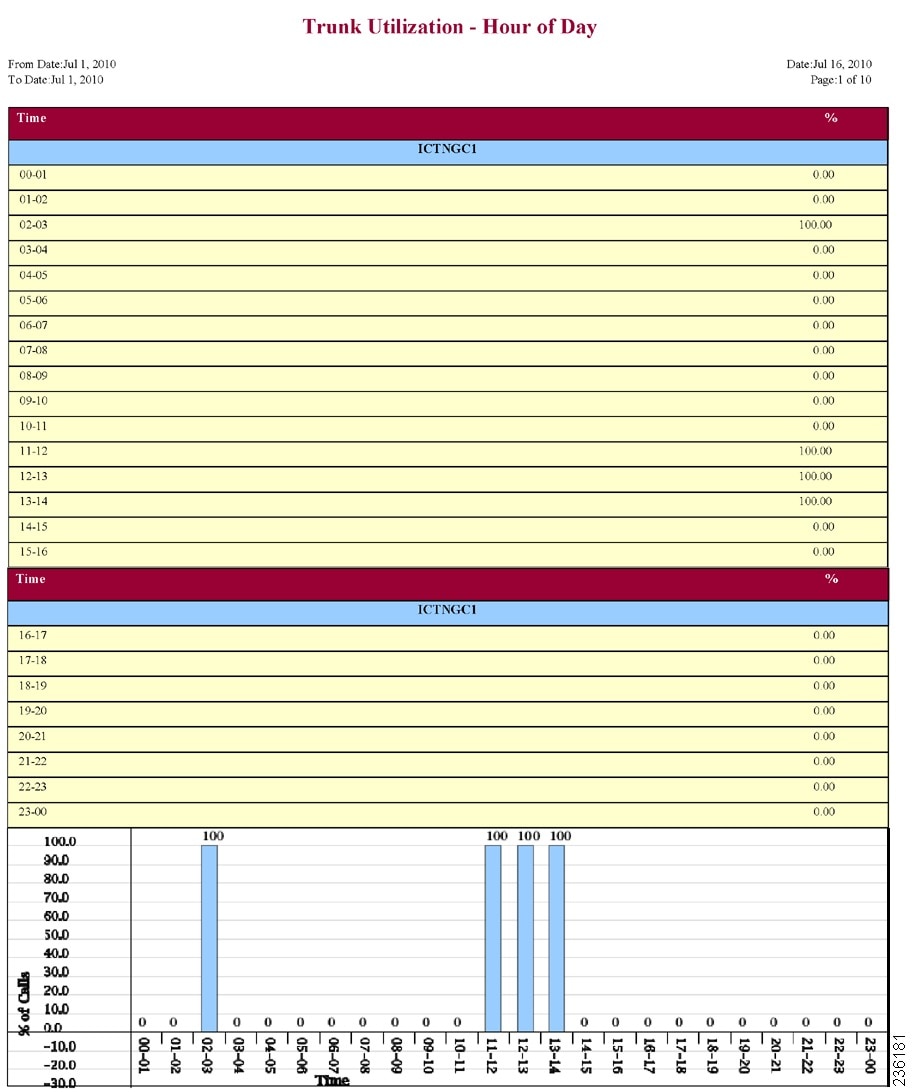
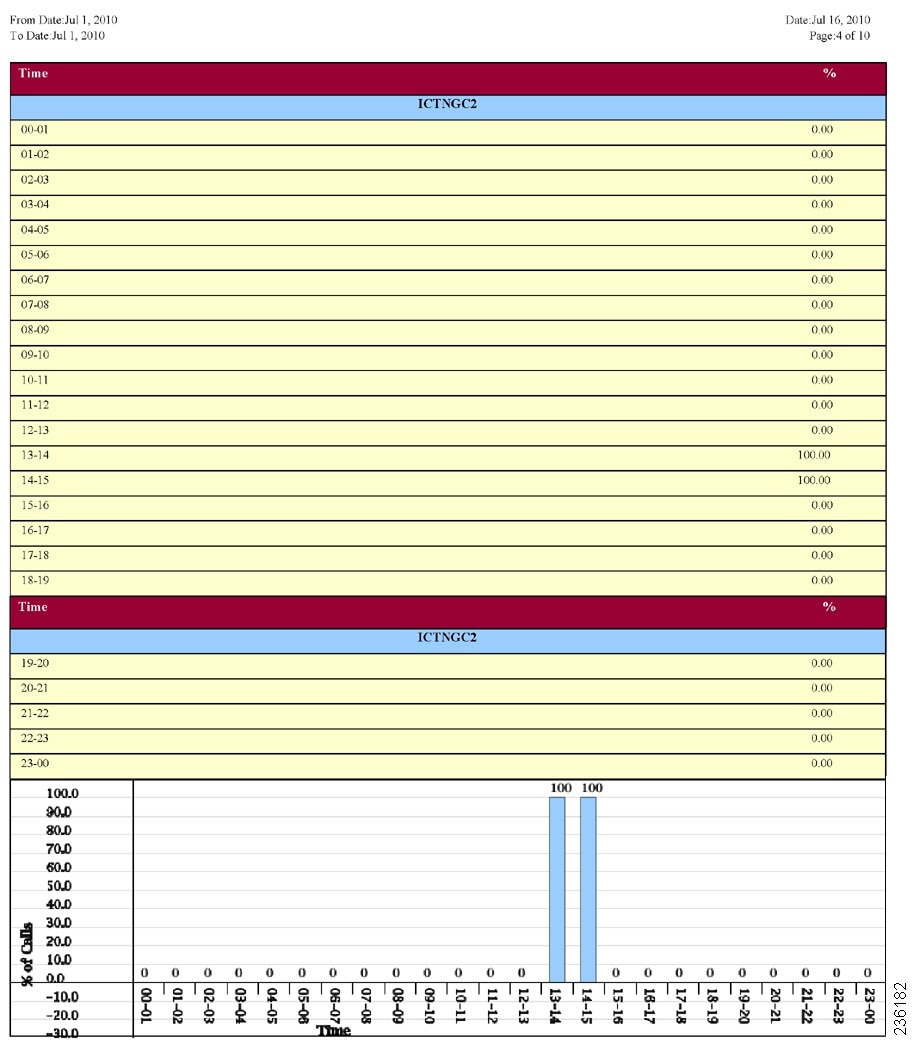
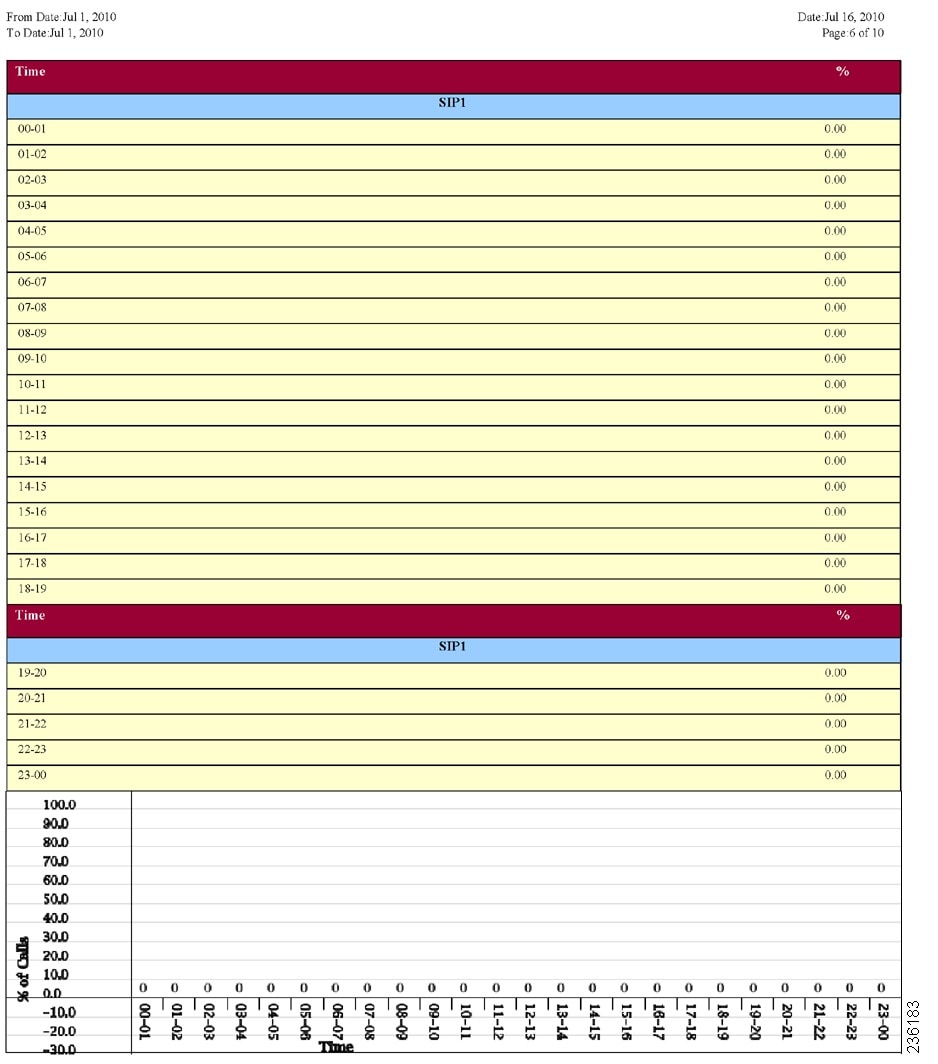
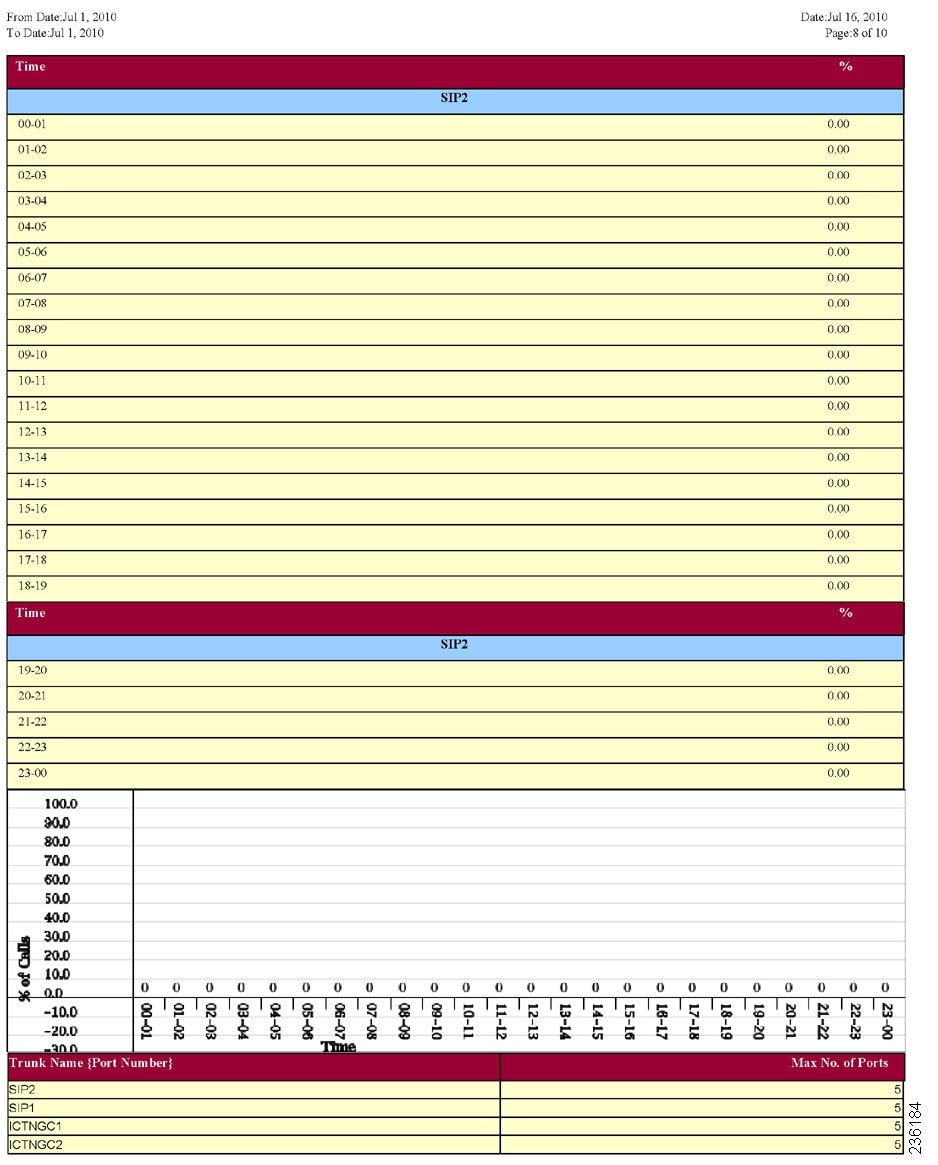
Trunk utilization report results
The Trunk Utilization report provides the following fields. If you choose to display the report in PDF format, the report shows the utilization as a bar chart. A graph displays for each selected trunk. See the table.
Figure 1 to Figure 4 display sample output pages of the Trunk Utilization Report in PDF format.
 Feedback