Monitoring the Device

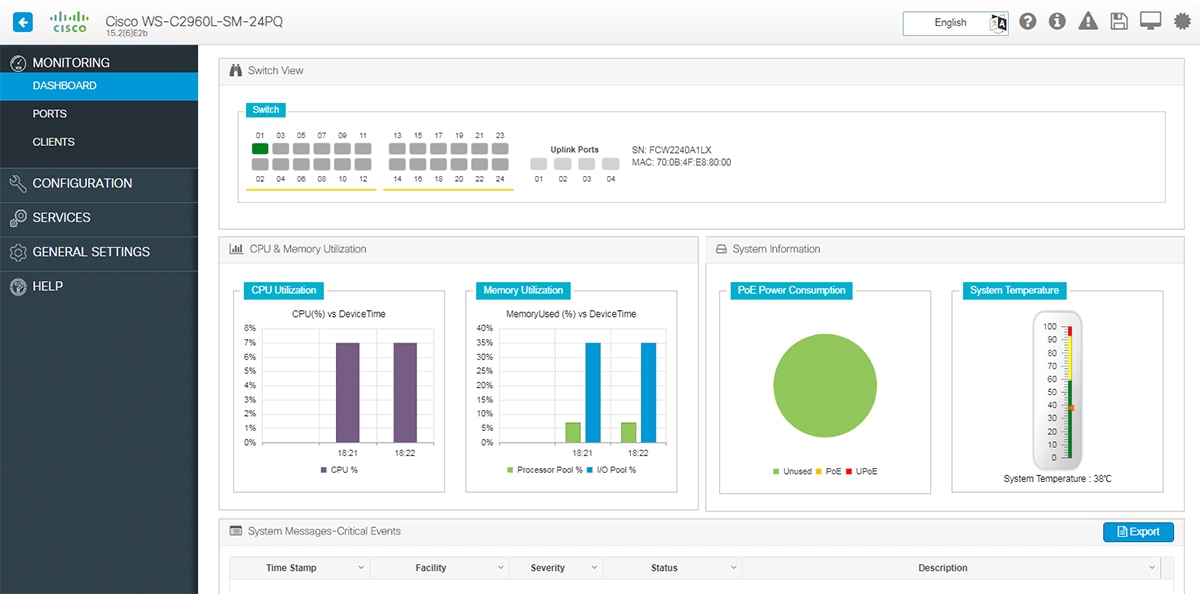
Understanding the Dashboard

The Monitoring > Dashboard page displays a snapshot of the overall status and statistics for your device.

This image is not available in preview/cisco.com

Figure 1. Dashboard
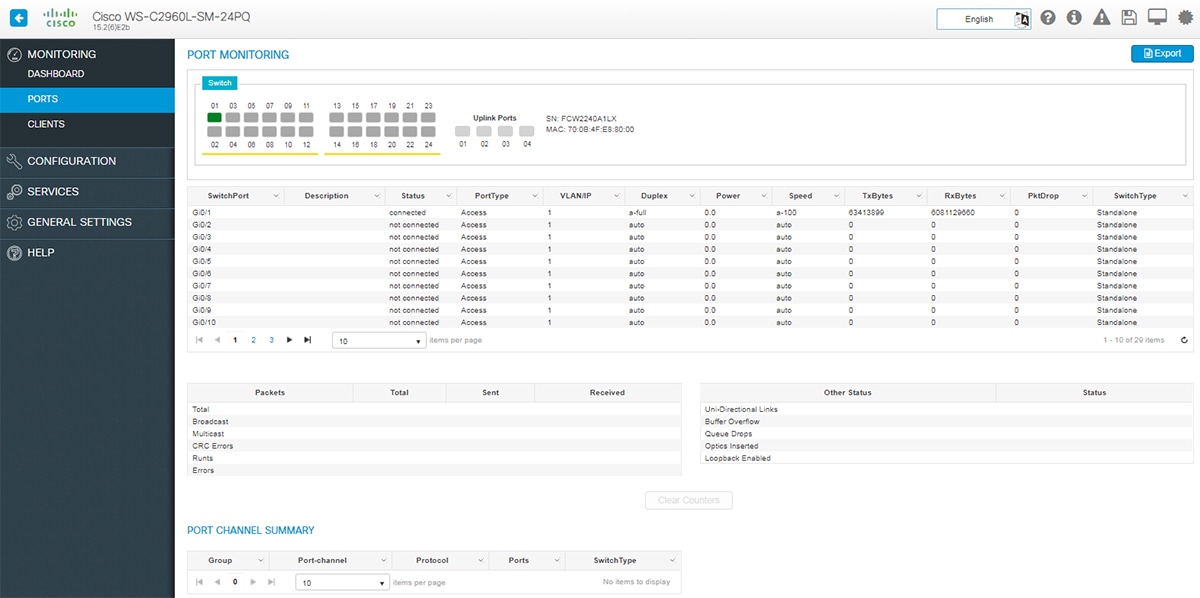
  • Switch View - Displays a snapshot of the ports on the device.

  • CPU and Memory Utilization - Displays CPU usage on the processors on each core, every 5 minutes, every 1 minute and every 5 seconds. The Memory Utilization section displays a chart of the device memory usage. Hover over the graph to view the processor pool and the I/O pool percentage.

  • System Information - The PoE Power Consumption section displays a pie-chart showing the total Power over Ethernet (PoE), Universal Power over Ethernet (UPoE) on the device, the power used by the device and the current power available. The System Temperature section displays the temperature of the device. If the temperature is yellow or red, your device needs attention.

  • System Messages-Critical Events - Displays high severity, critical alerts that require your attention. Displays the system messages or any critical events regarding the switch in a tabular format that can also be downloaded using the Export button.

Monitoring Ports

The Monitoring > Ports > Port Monitoring page enables you to track and monitor the port parameters (interface details) like type of interface, description, port status, port type of the switch. The logical representation of the ports at the top provides an easy-to-understand snapshot of all ports on the device.

Figure 2. Port Monitoring

You can get additional details associated with the port by clicking on the port in the logical view at the top or in the table.

Parameter

Description

Switch Port

The type of interface.

  • Gigabit Ethernet—Displays the Gigabit Ethernet for 10/100/1000 Mb/s Ethernet ports.

  • 10 Gigabit Ethernet—Displays the 10-Gigabit Ethernet for 10,000 Mb/s Ethernet ports.

  • SFP—Displays the small form-factor pluggable (SFP) module Gigabit Ethernet interfaces.

  • Unknown—Displays unknown when no interface is configured.

  • SVI port

  • Port-channel

Description

The description associated with the port.

Status

The connection status of the port.

Port Type

The type of port—Access, Trunk, Routed.

VLAN/IP

The VLAN connection link associated with the port. Values are as follows:

  • Trunk Mode—Displays the VLAN ID of the VLAN associated with this port.

  • Access Mode—Displays the VLAN ID of the VLAN associated with this port.

Duplex

The duplex mode of the interface.

Power

The power (in Watts) of the interface.

Speed

The speed of the interface.

PktDrop

Number of dropped packets.

SwitchType

Displays the type of Switch—Standalone.

Monitoring Clients

The Monitor > Clients page lists the information about the clients connected to the device. Click the client in the table to view properties and statistics for each client.

Parameter

Description

MAC

The MAC address of the client.

Switch Port

The interface used for communication between the client and the switch.

Client Name

Name of the client.

OS

Software version of the client.

Manufacturer

Client manufacturer details.

IP

IP address of the client.

VLAN

The VLAN on which the client resides.

POE Drawn

Determines power drawn(wattage) by this client.

Images

An icon to help you identify the device.