Monitor

This chapter contains the following topics:

Inventory

This chapter contains the following topics:

Viewing Inventory Information for Switches

To view the inventory information for switches from the Cisco DCNM Web UI, perform the following steps:

Procedure


Step 1

Choose Monitor > Inventory > Switches.

The Switches window with a list of all the switches for a selected Scope is displayed.

Step 2

You can also view the following information.

  • Group column displays the switch group to which the switch belongs.

  • In the Device Name column, select a switch to display the Switch Dashboard.

  • IP Address column displays the IP address of the switch.

  • WWN/Chassis ID displays the Worldwide Name (WWN) if available or chassis ID.

  • Health displays the health situation of the switch.

    Note 

    To refresh and recalculate the latest health data for all the switches on Cisco DCNM, click the Recalculate Health button above the switches table.

  • Status column displays the status of the switch.

  • # Ports column displays the number of ports.

  • Model column displays the model name of the switch.

  • Serial No. column displays the serial number of the switch.

  • Release column displays the switch version.

  • License column displays the DCNM license that is installed on the switch.

  • Up Time column displays the time period for which the switch is active.

Step 3

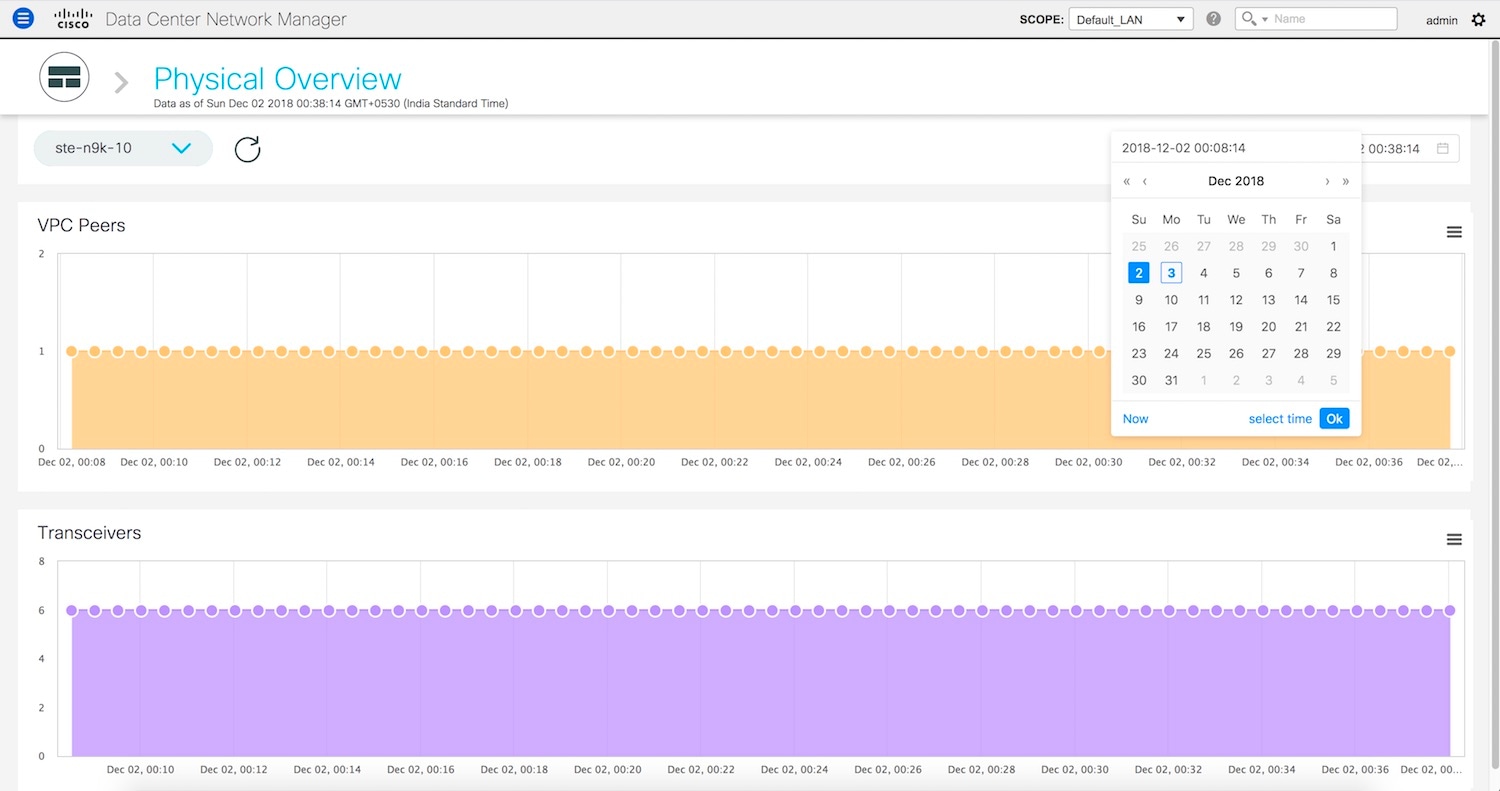
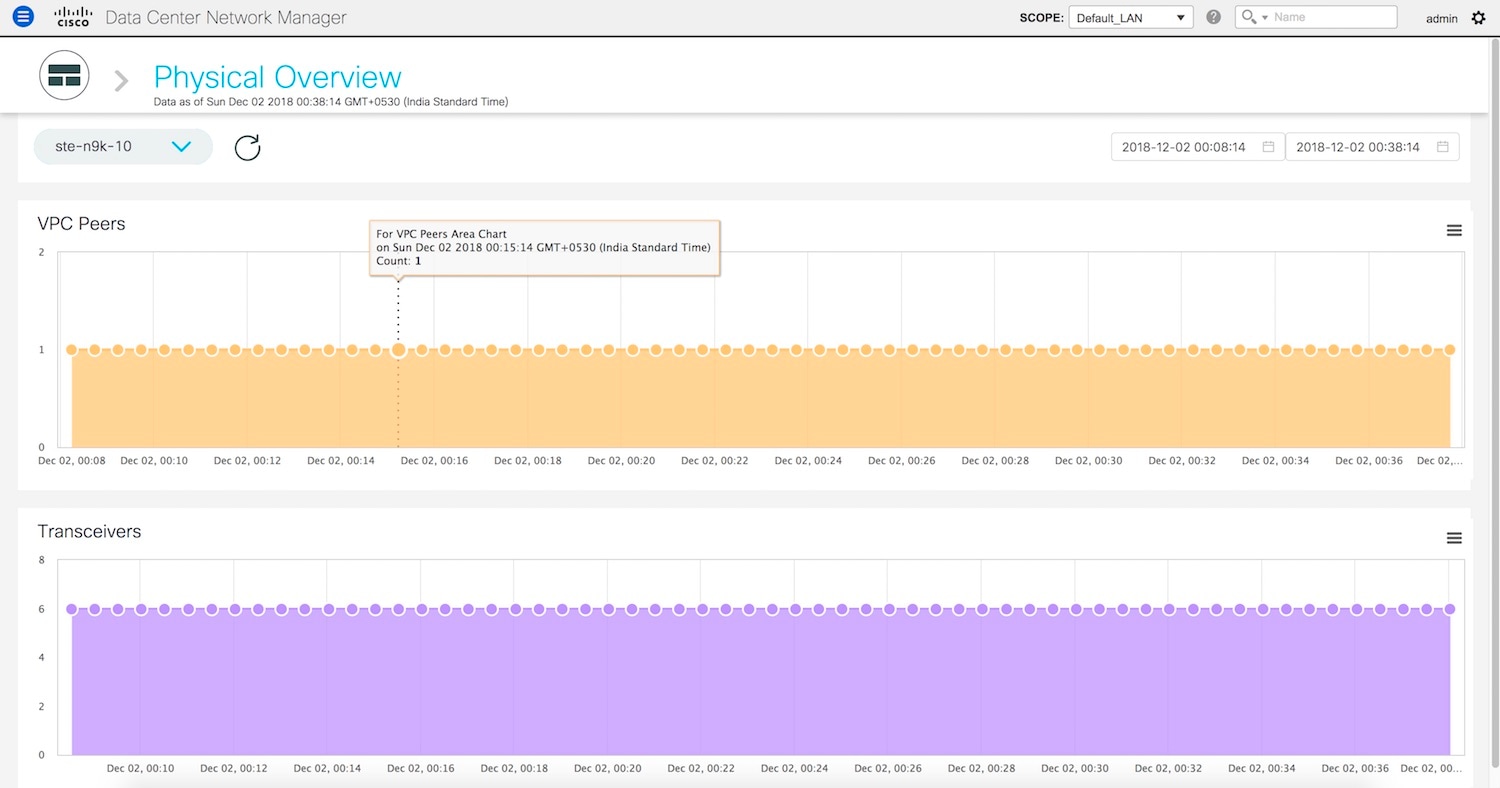
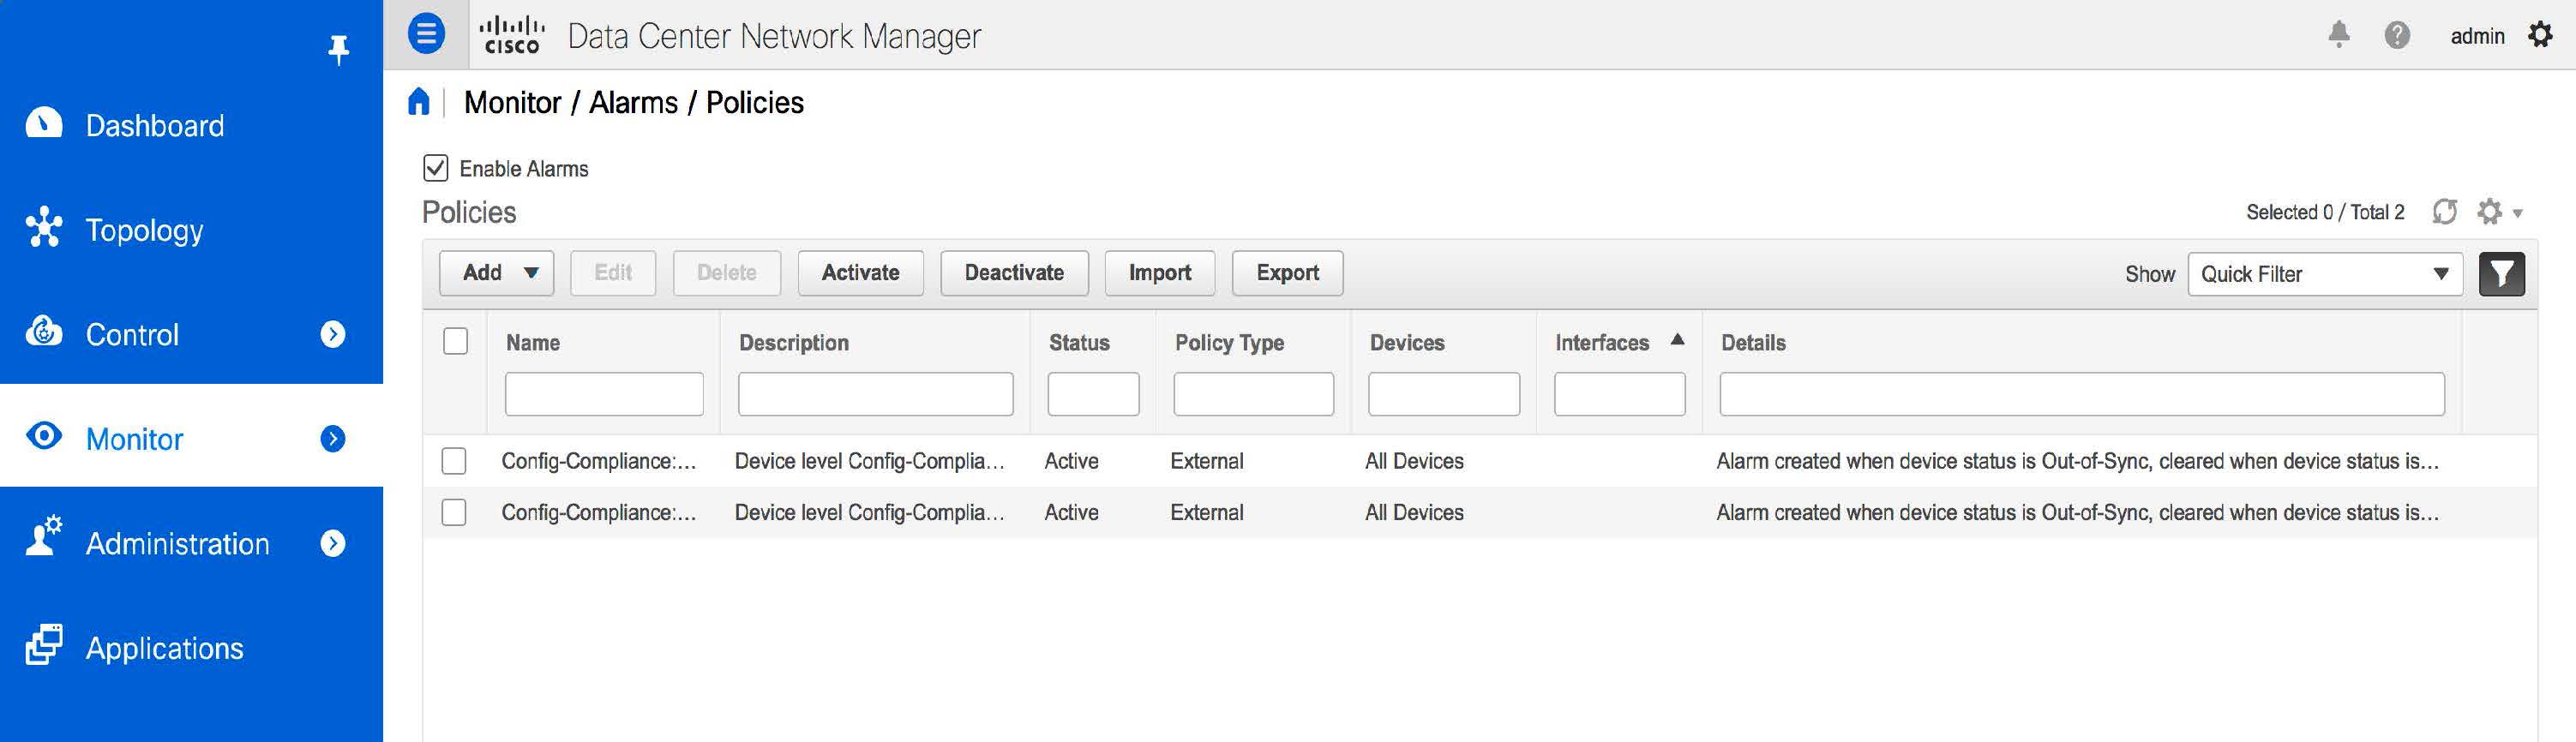
Click Health to access the Health score window for a device. The Health score window includes health score calculation and health trend. The Overview tab displays the overall health score. All the modules, switch ports and alarms are taken into consideration while calculating the health score. Hover over the graph under Health Trend for detailed information on specific dates. Hover over the info icon next to Alarms to display the number of Critical, Major, Minor, and Warning alarms that have been generated.

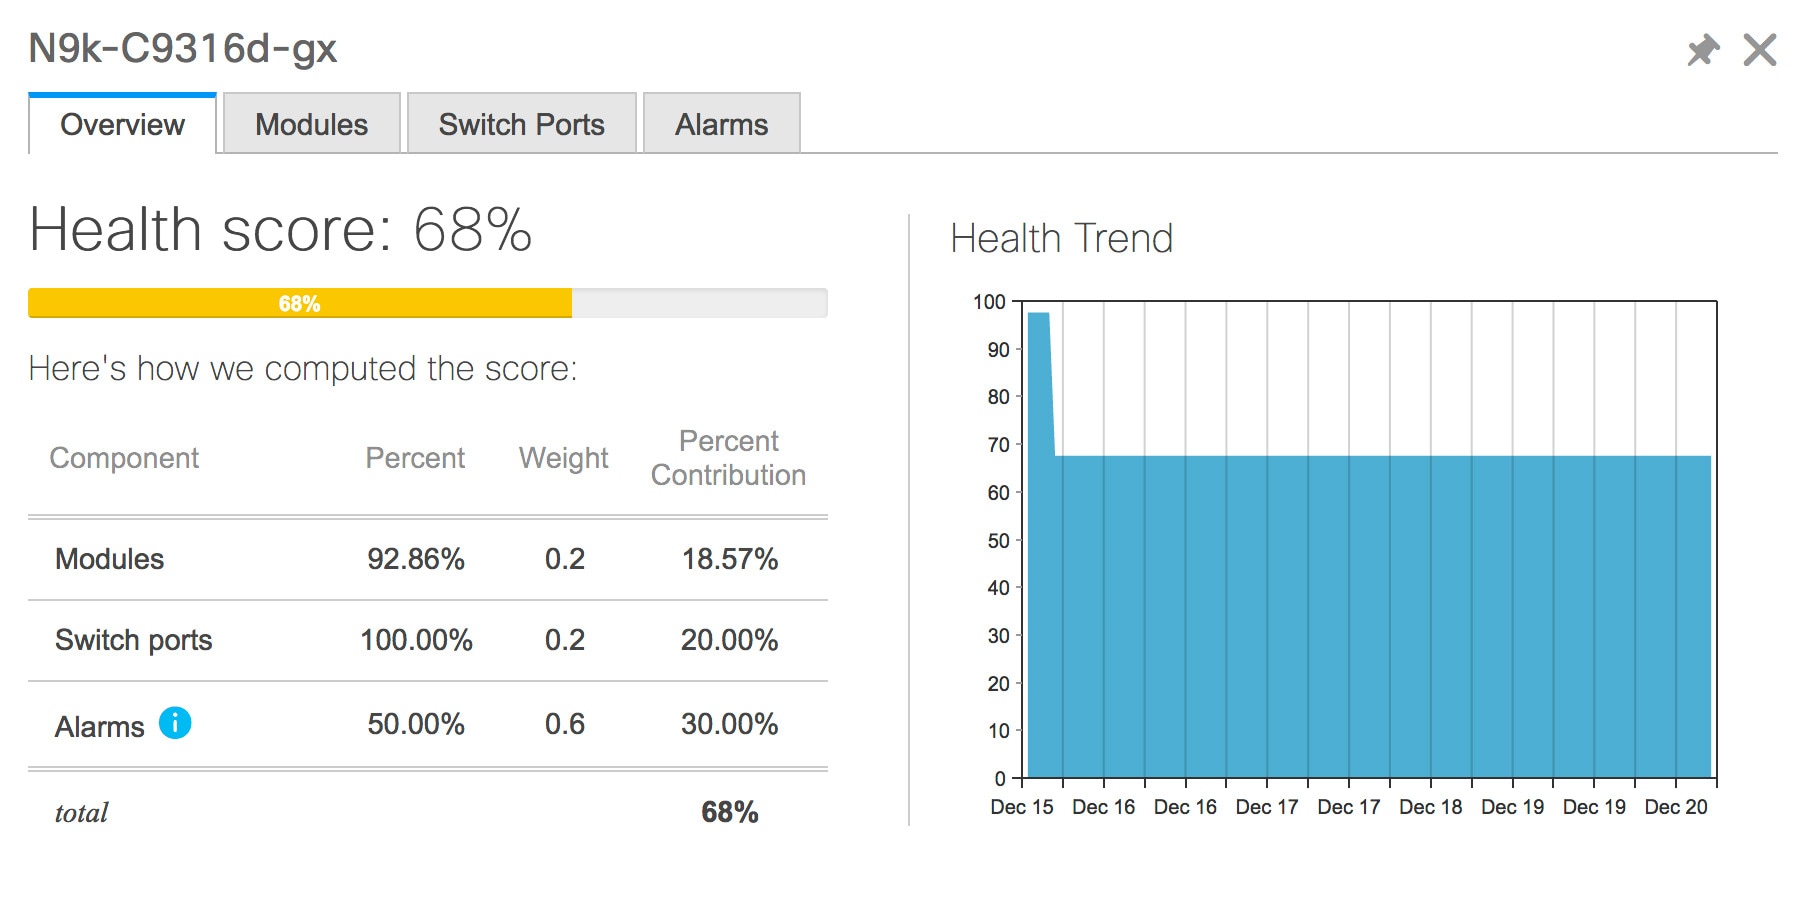
Click the Modules tab to display information about the various modules in the device. This tab displays information such as Name, Model name, Serial number, Status, Type, Slot, Hardware revision and Software revision.

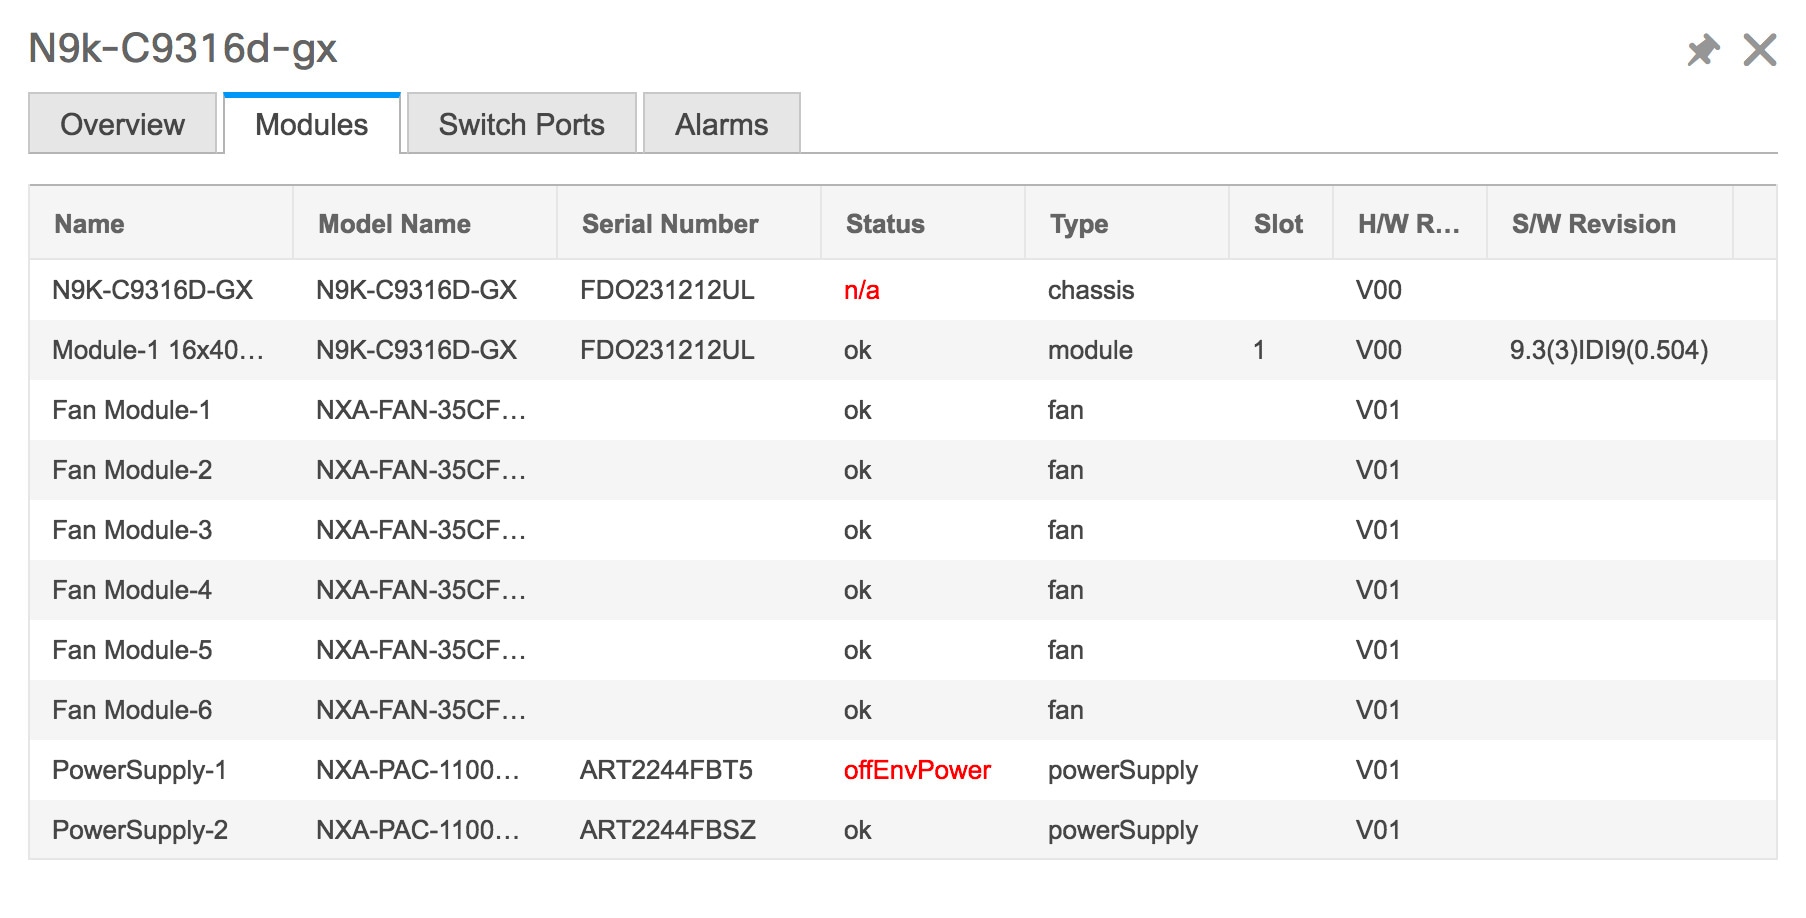
Click the Switch Ports tab to display information about the device ports. This tab displays information such as Name, Description, Status, Speed, and the device to which a port is connected .

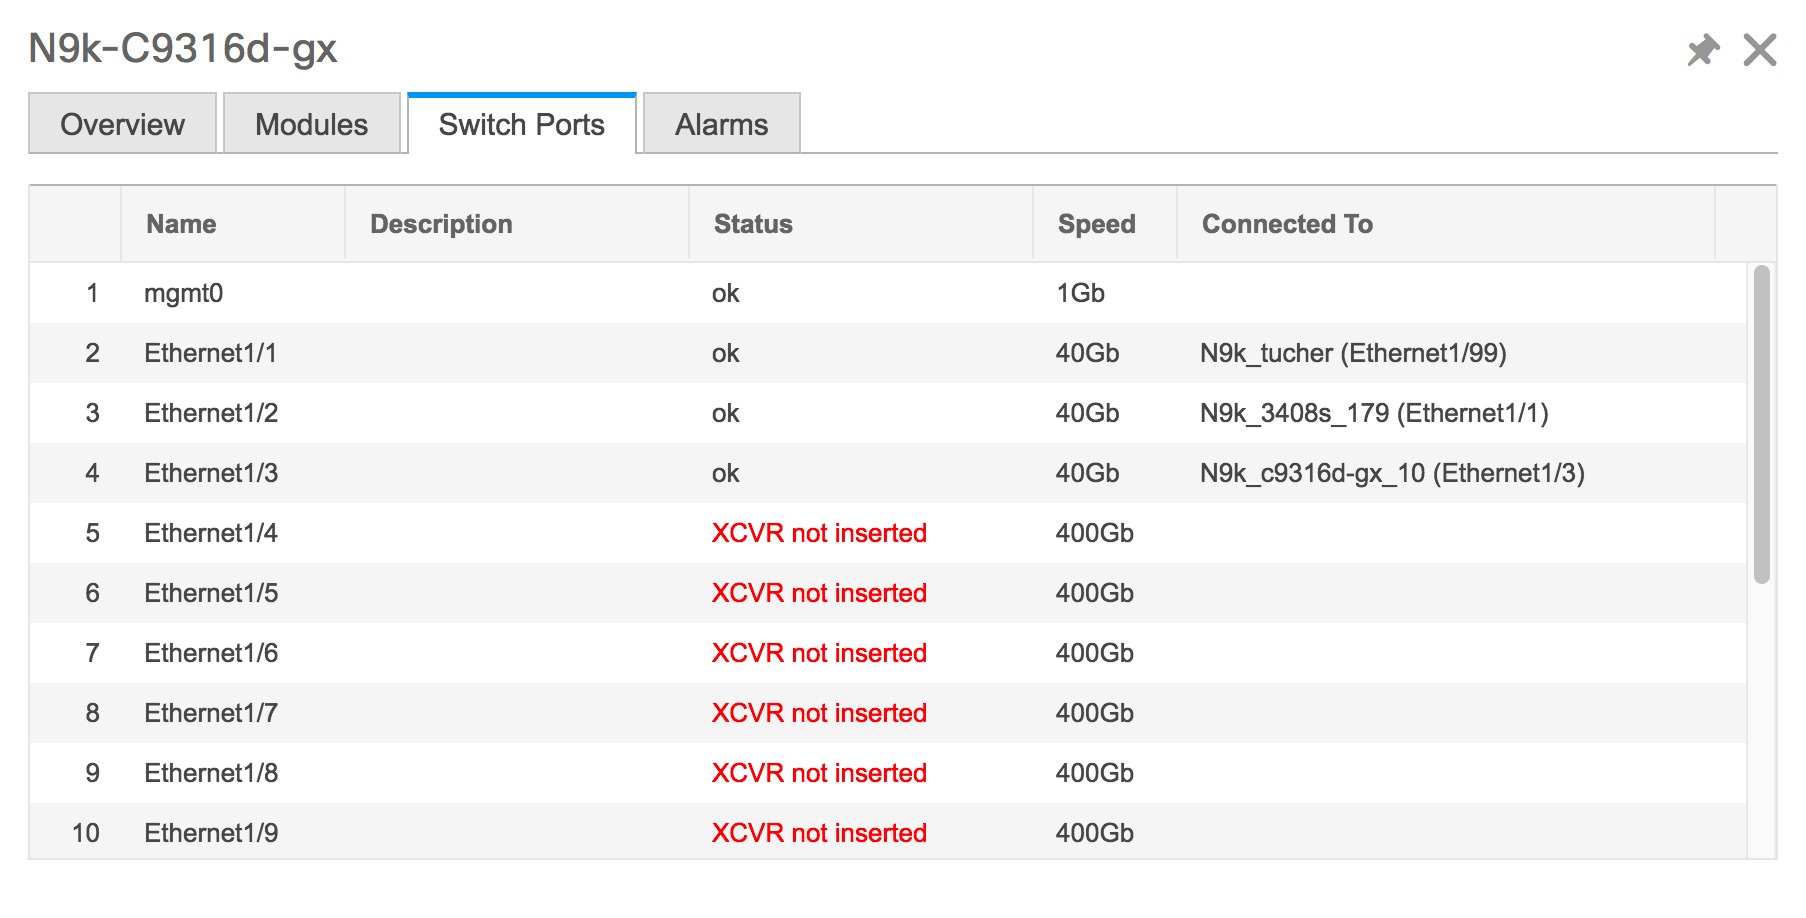
Click the Alarms tab to display information about the alarms that have been generated. This tab displays information such as alarm Severity, Message, Category, and the Policy that has been activated due to which the alarm is generated.

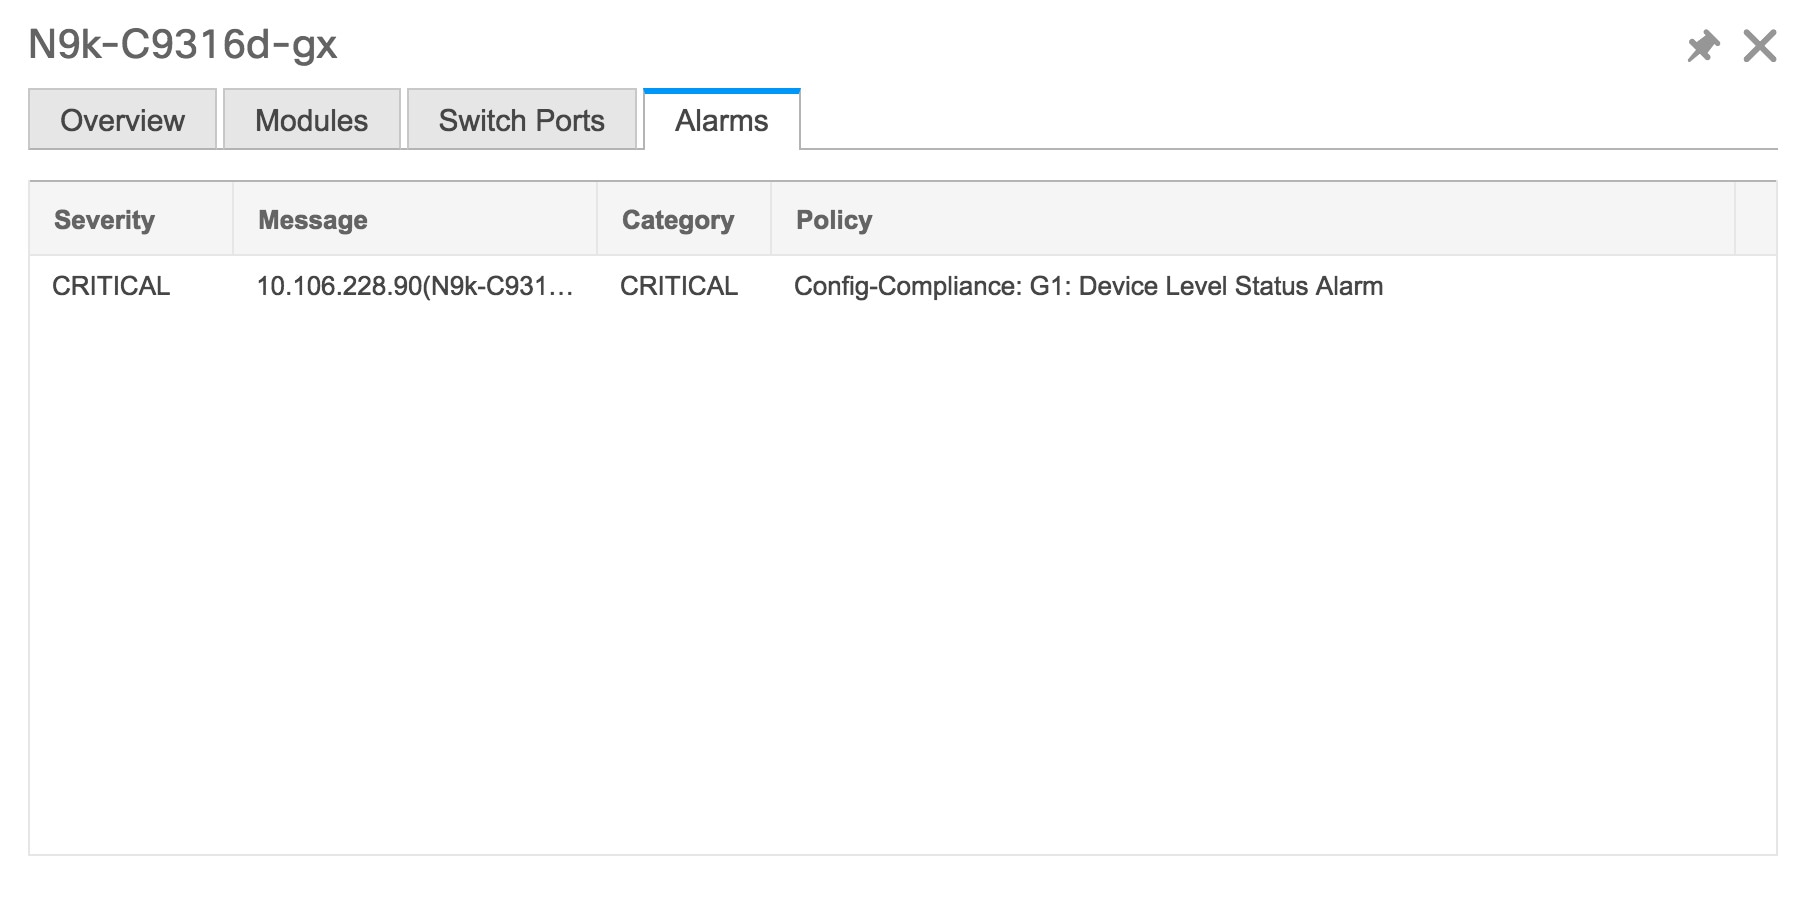
In the Health column, the switch health is calculated by the capacity manager based on the following parameters:

  • Total number of modules

  • Total number of modules impacted by the warning

  • Total number of switch ports

  • Total number of switch ports impacted by the warning

  • Total number of critical severity alarms

  • Total number of warning severity alarms

  • Total number of major severity alarms

  • Total number of minor severity alarms

Step 4

The value in the Health column is calculated based on the following:

  • Percentage of modules impacted by warnings (Contributes 20% of the total health).

  • Percentage of ports impacted by warnings (Contributes 20% of the total health).

  • Percentage of alarms (Contributes 60% of the total health). The critical alarms contribute the highest value to this percentage followed by major alarms, minor alarms and warning alarms.

You may also have your own health calculation formula by implementing the common interface class: com.cisco.dcbu.sm.common.rif.HealthCalculatorRif.

The default Java class is defined as: health.calculator=com.cisco.dcbu.sm.common.util.HealthCalculatorAlarms.

  • Capacity Manager calculates health only for the license switches. If the health column does not display a value, the switch either does not have a license or it has missed the capacity manager daily cycle.

  • If the switch is unlicensed, click Unlicensed in the DCNM License column. The Administration > License window appears which allows you to assign a license to the user.

  • The capacity manager runs two hours after the DCNM server starts. So, if you discover a device after two hours of the DCNM start time, the health will be calculated 24 hours after this DCNM start time

Starting from Cisco DCNM 11.3(1) Release, you can view information about switch health along with the switch summary by clicking on a switch in the Topology window or by choosing Control>Fabrics>Fabric Builder, selecting a fabric and clicking on a switch in the Fabric Builder window.


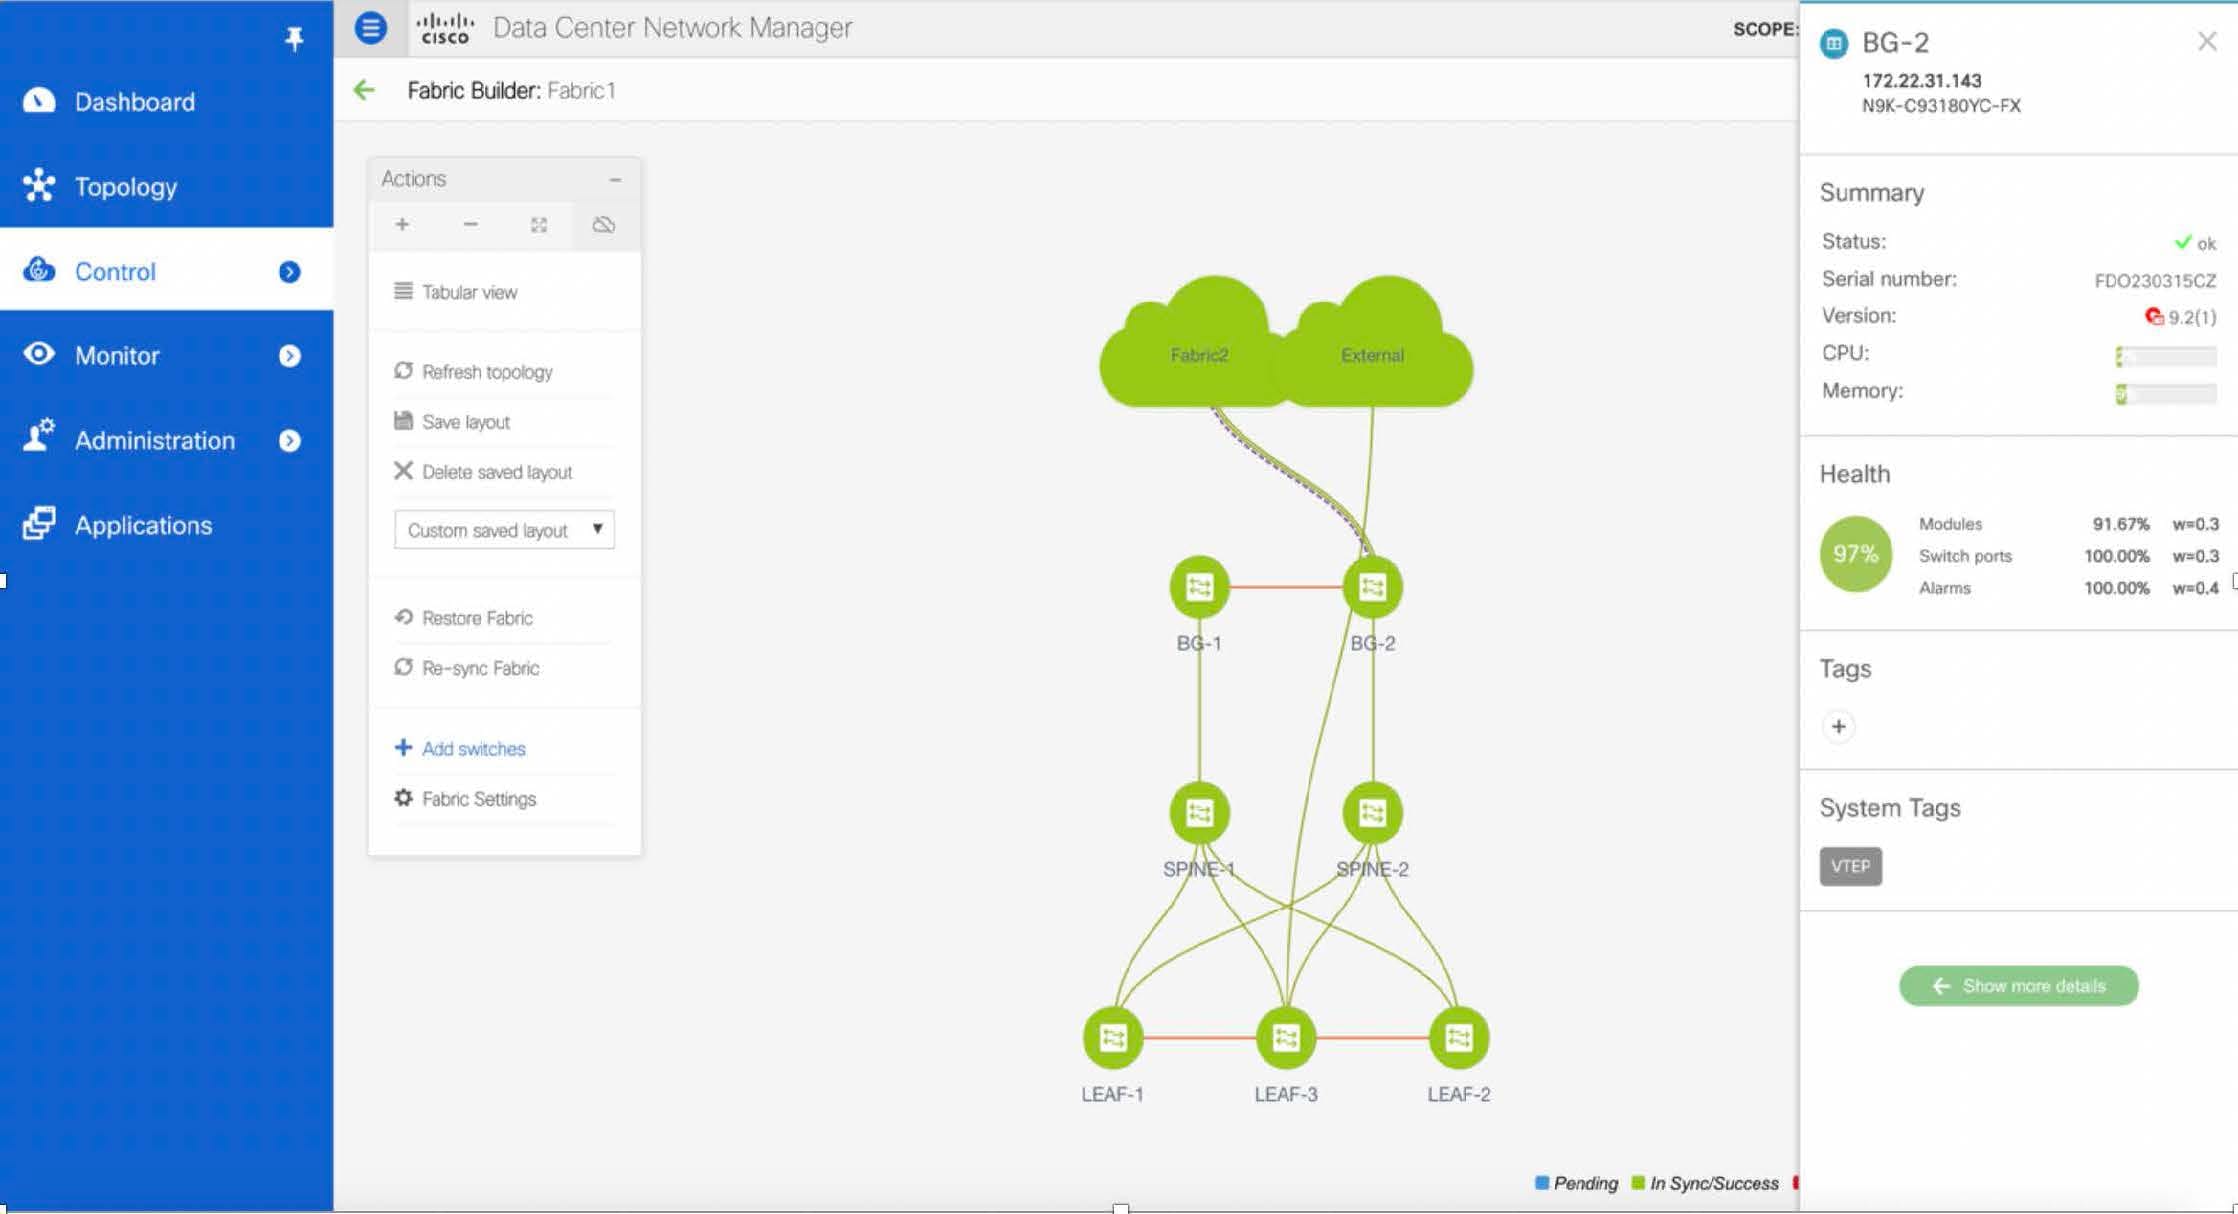
Viewing System Information

The switch dashboard displays the details of the selected switch.

Procedure

Step 1

From the Cisco DCNM home page, choose Monitor > Inventory > Switches.

An inventory of all the switches that are discovered by Cisco DCNM Web UI is displayed.

Step 2

Click a switch in the Device Name column.

The Switch dashboard that corresponds to that switch is displayed along with the following information:

Step 3

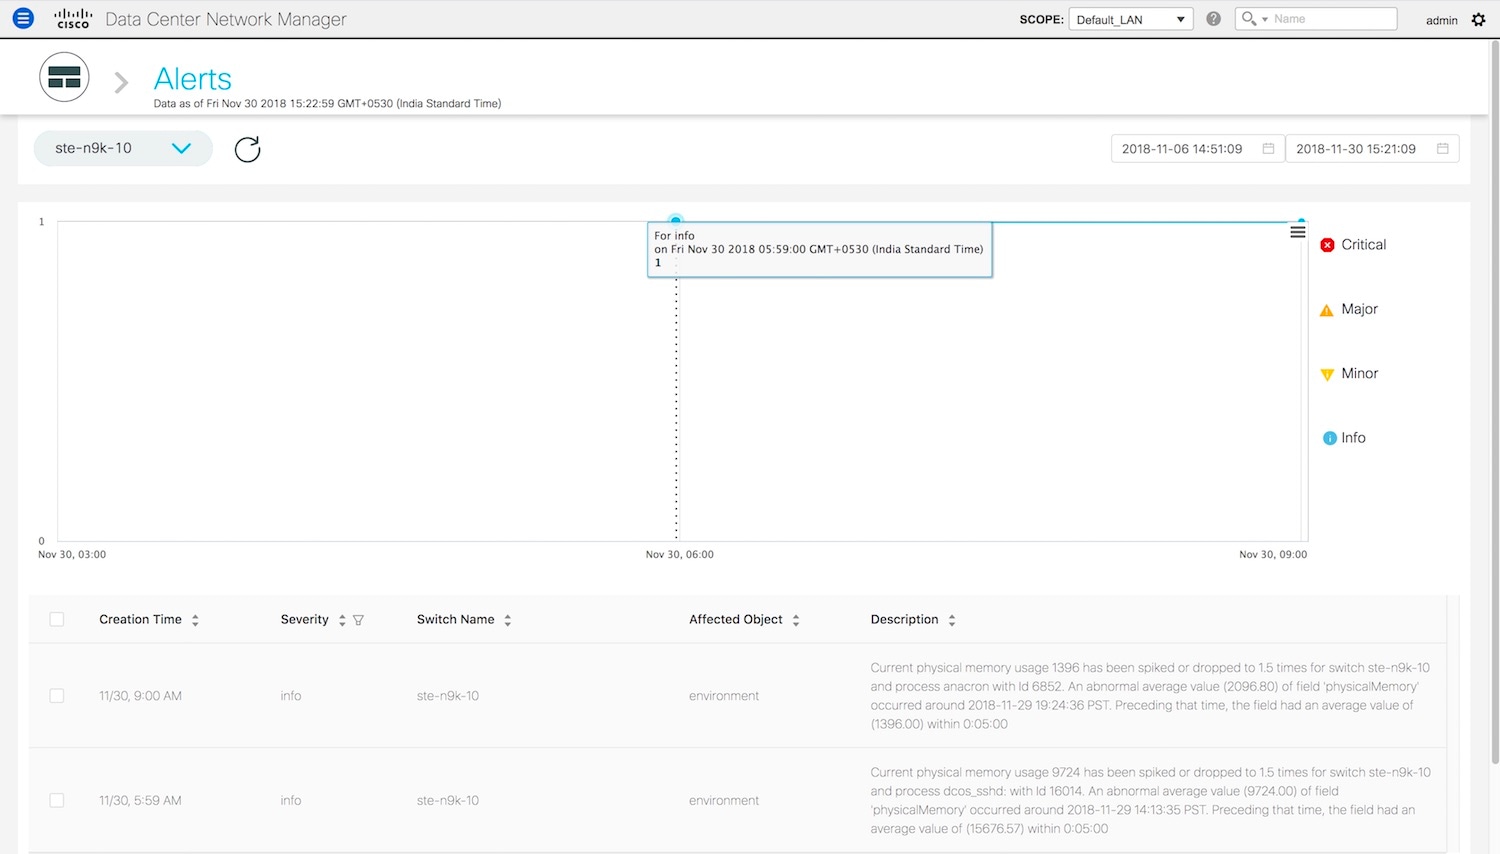
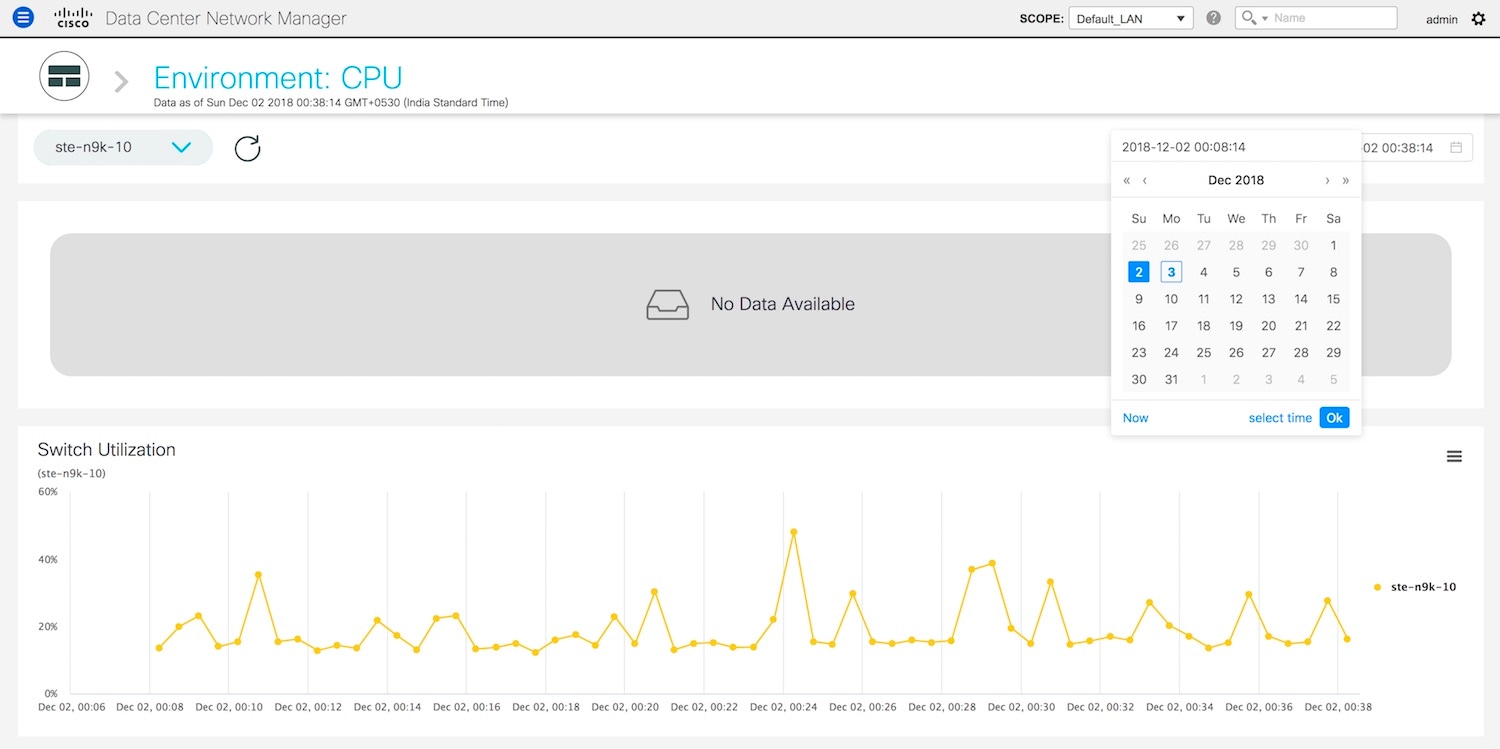
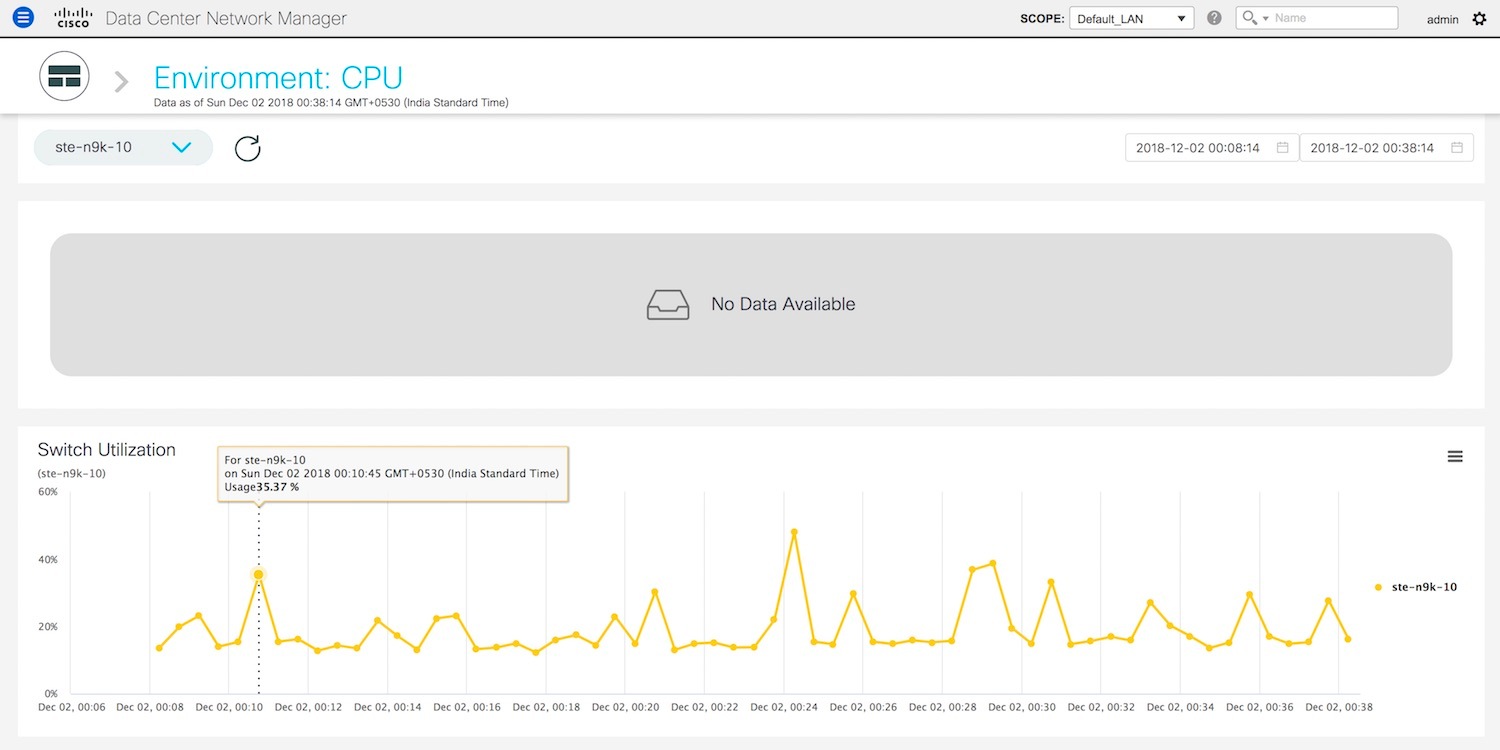
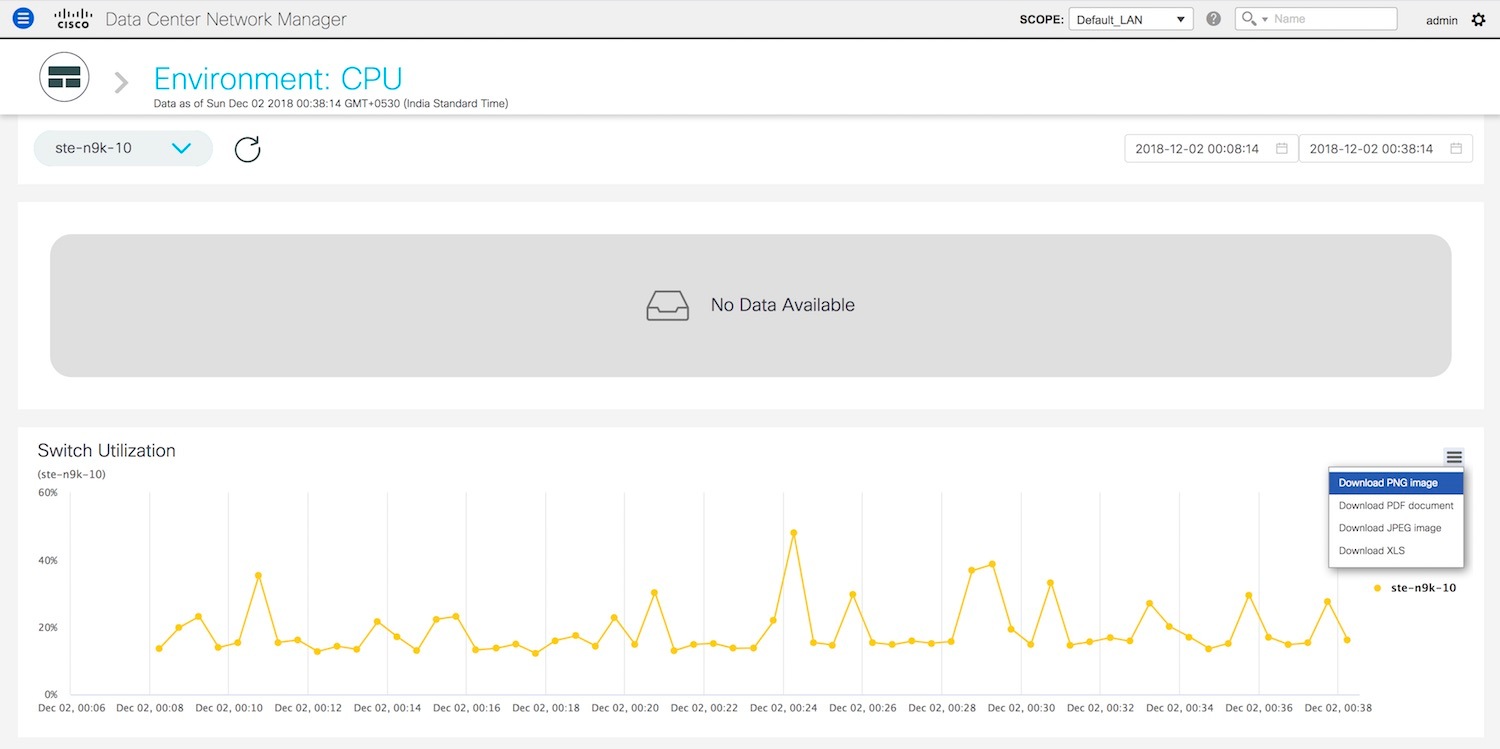
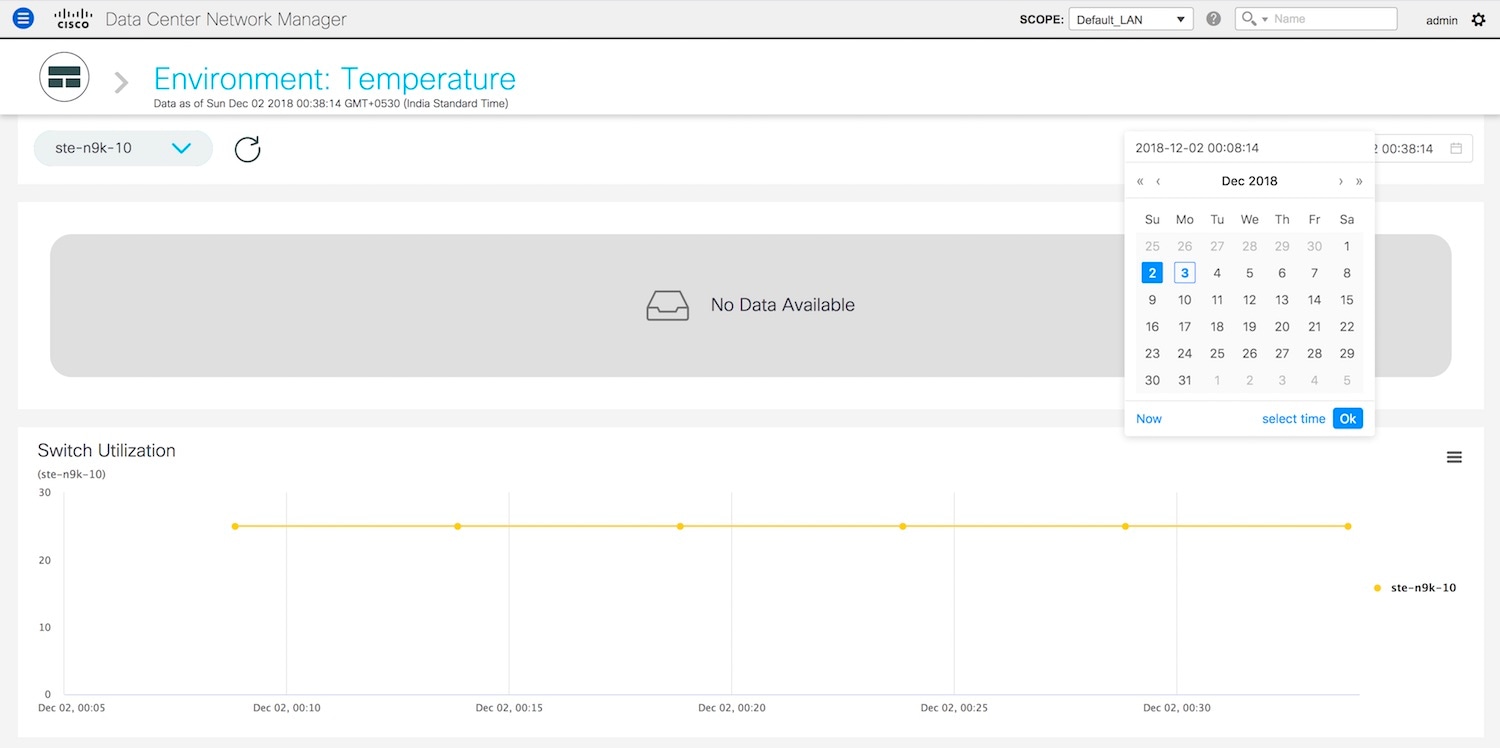
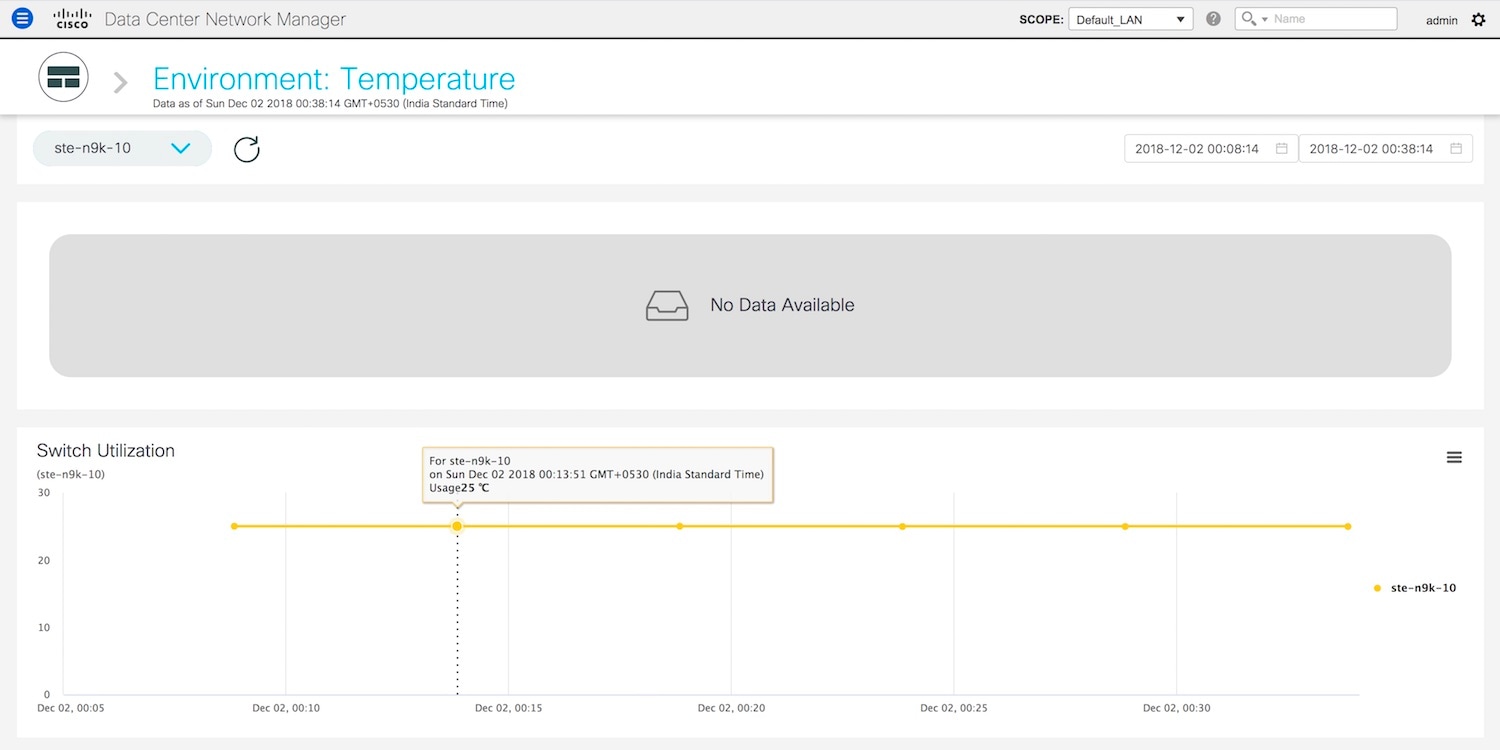
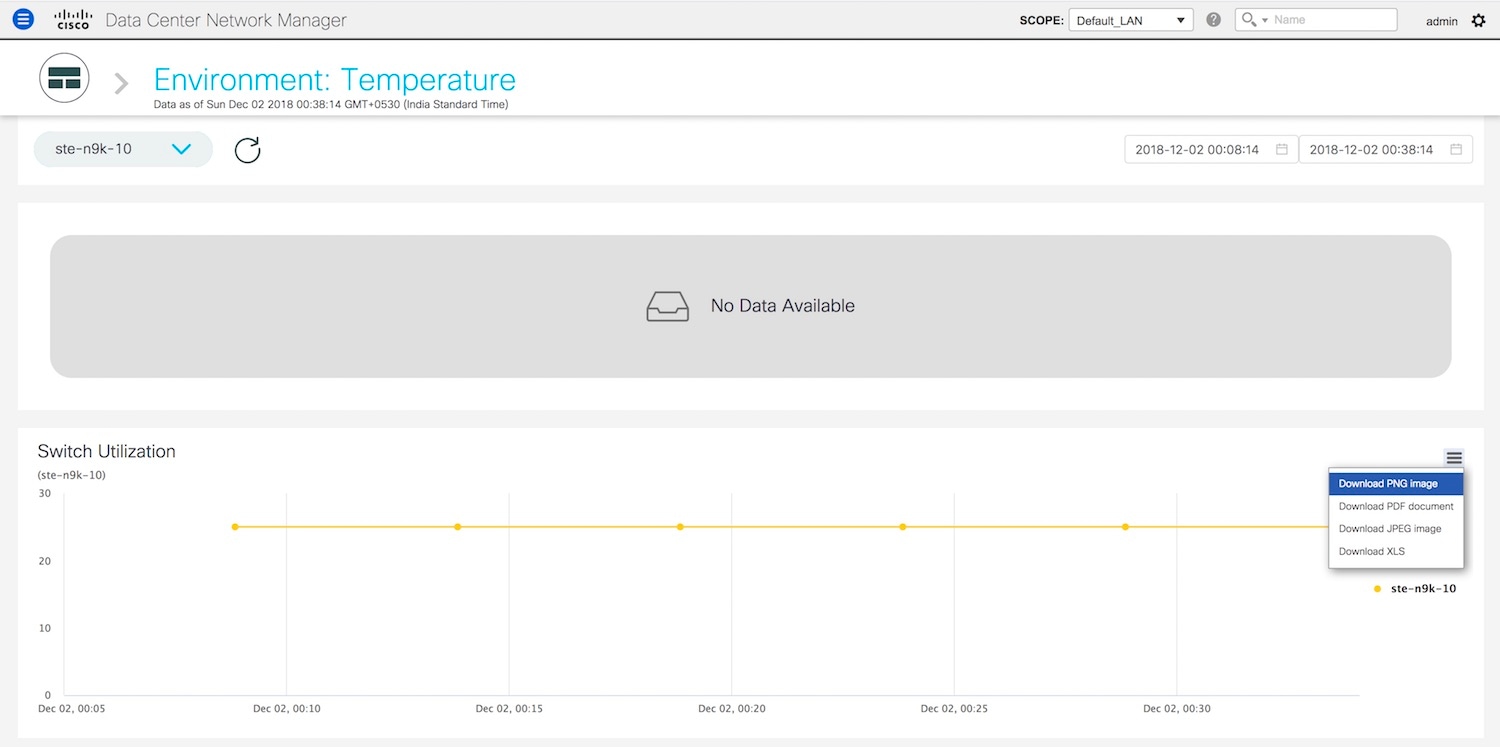
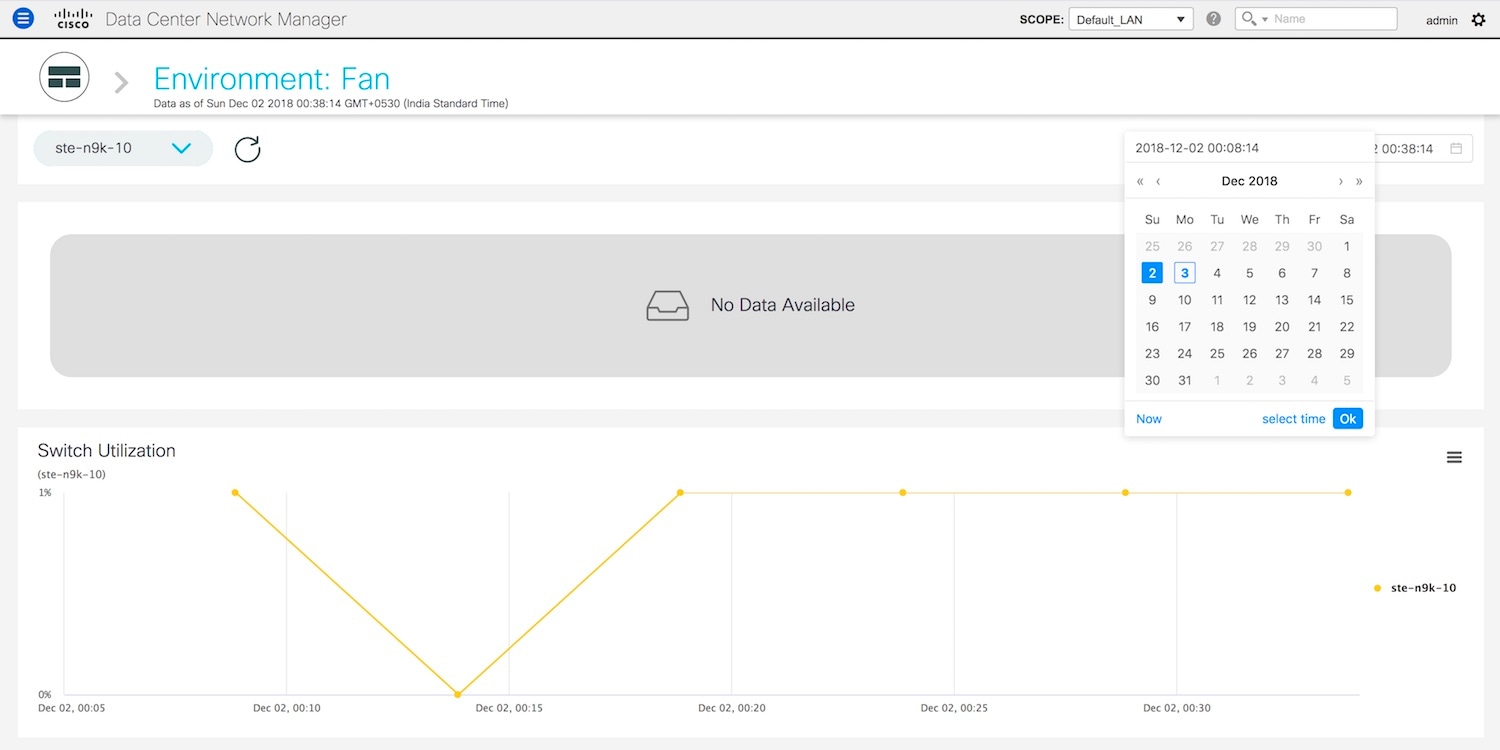
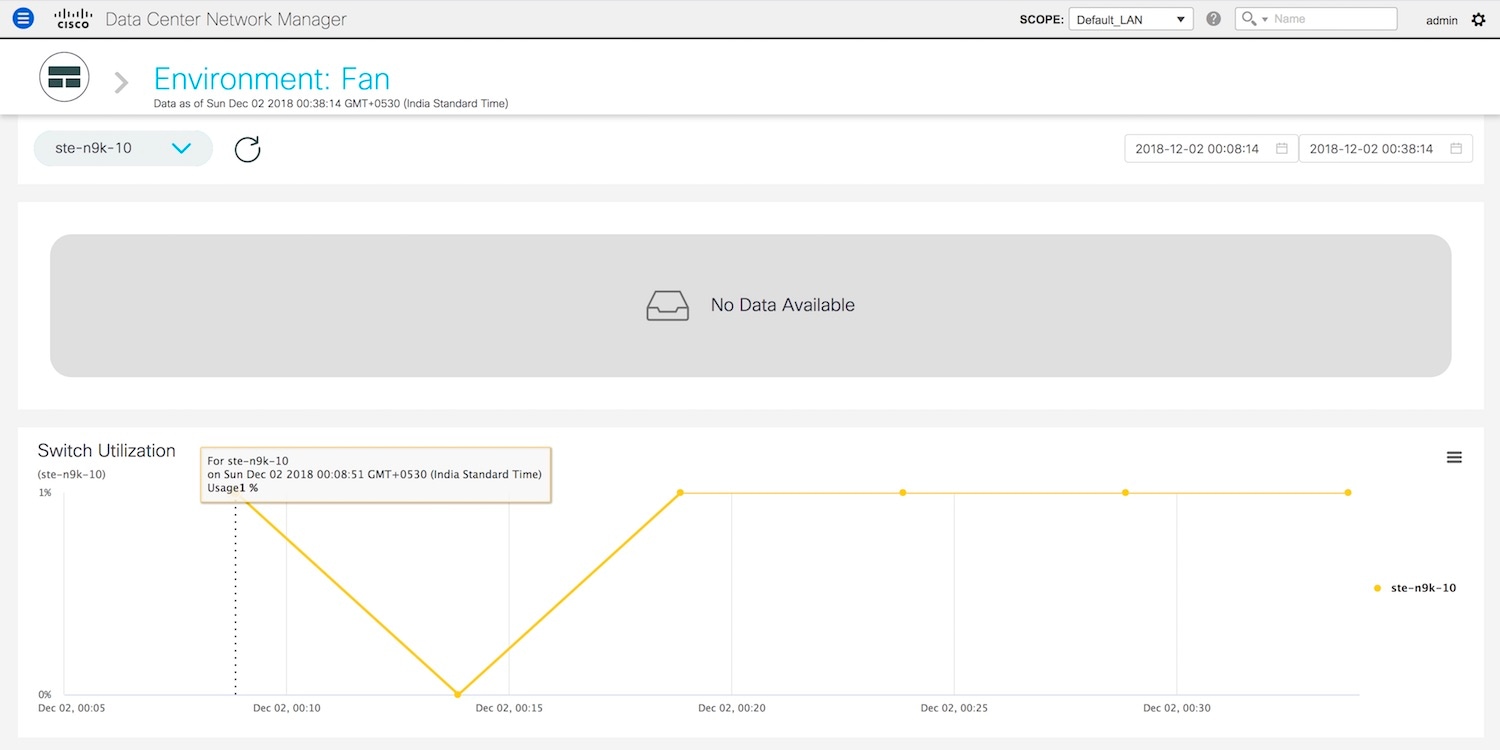
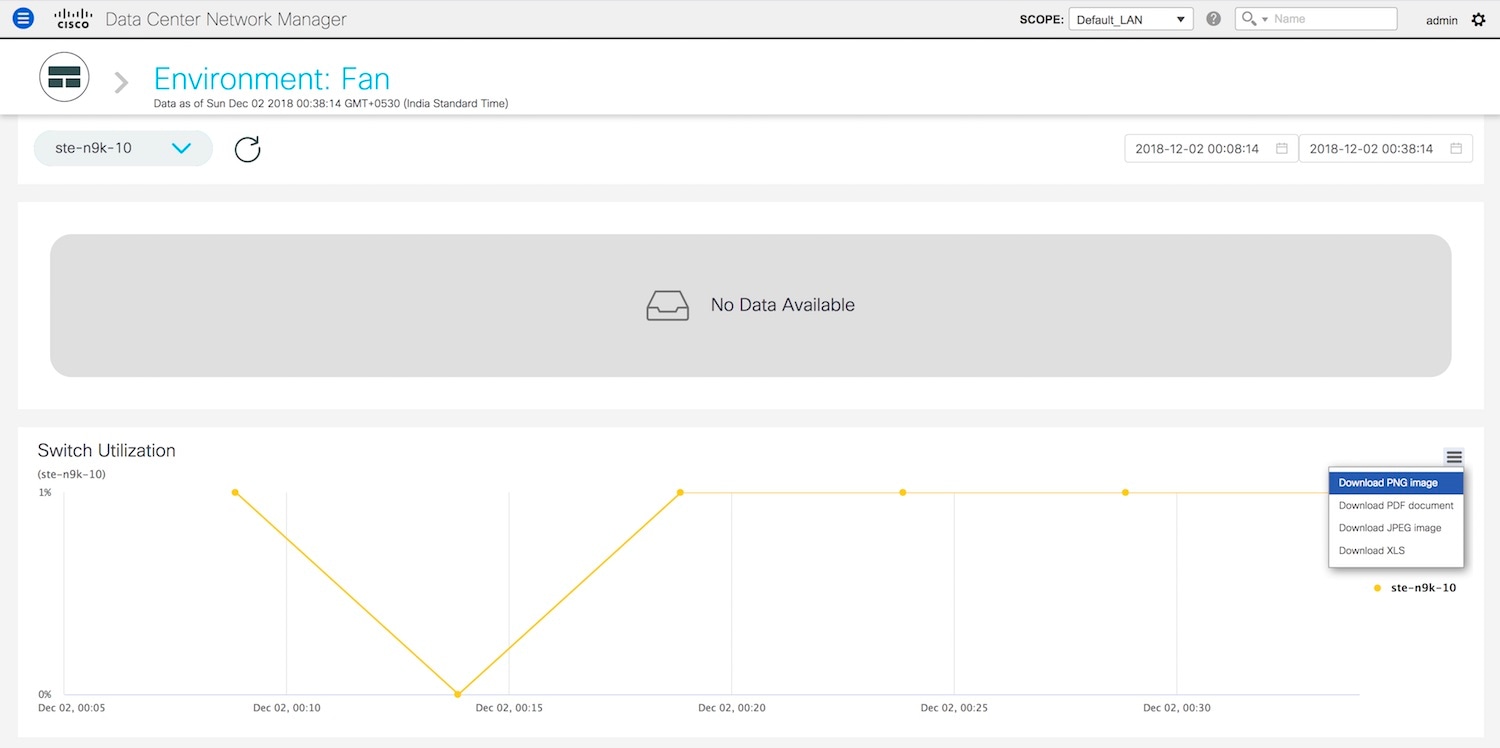
Click the System Information tab. This tab displays detailed system information such as group name, health, module, time when system is up, serial number, the version number, contact, location, DCNM license, status, system log sending status, CPU and memory utilization, and VTEP IP address are displayed. Click Health to access the Health score screen, which includes health score calculation and health trend. The popup contains Overview, Modules, Switch Ports, and Events tabs.

  • (Optional) Click SSH to access the switch through Secure Shell (SSH).

  • (Optional) Click Device Manager to view a graphical representation of a Cisco MDS 9000 Family switch chassis, a Cisco Nexus 5000 Series switch chassis, a Cisco Nexus 7000 Series switch chassis, or a Cisco Nexus 9000 Series switch chassis including the installed switching modules, the supervisor modules, the status of each port within each module, the power supplies, and the fan assemblies.

  • (Optional) Click HTTP to access the switch through Hypertext Transfer Protocol (HTTP) for that switch.

  • (Optional) Click Accounting to go to the Viewing Accounting Information window pertaining to this switch.

  • (Optional) Click Backup to go to the Viewing a Configuration window.

  • (Optional) Click Events to go to the Viewing Events Registration window.

  • (Optional) Click Show Commands to display the device show commands. The Device Show Commands page helps you to view commands and execute them.

  • (Optional) Click Copy Running Config to Startup Config to copy the running configuration to the startup configuration.


VXLAN

You can view VXLANs and their details under the VXLAN tab.

To view VXLANs, choose Inventory > View > Switches, and then click a switch name in the Device Name column.

The following table describes the fields that are displayed:

Table 1. The VXLAN Tab

Field

Description

VNI

Displays the Layer 2 (network) or Layer 3 (VRF) VXLAN VNI that is configured on a switch.

Multicast address

Displays the multicast address that is associated with the Layer 2 VNI, if applicable.

VNI Status

Displays the status of the VNI.

Mode

Displays the VNI modes: Control Plane or Data Plane.

Type

Displays whether the VXLAN VNI is associated with a network (Layer 2) or a VRF (Layer 3).

VRF

Displays the VRF name that is associated with the VXLAN VNI if it is a Layer 3 VNI.

Mapped VLAN

Displays the VLAN or Bridge domain that is mapped to VNI.

FEX

The Fabric Extender feature allows you to manage a Cisco Nexus 2000 Series Fabric Extender and its association with the Cisco NX-OS switch that it is attached to. A Fabric Extender is connected to the switch through physical Ethernet interfaces or a Port Channel. By default, the switch does not allow the attached Fabric Extender to connect until it has been assigned a chassis ID and is associated with the connected interface. You can configure a Fabric Extender host interface port as a routed or Layer 3 port. However, no routing protocols can be tied to this routed interface.


Note

FEX feature is available on LAN devices only. Therefore, you will see FEX on Cisco DCNM Inventory Switches. FEX is also not supported on Cisco Nexus 1000V devices.

Note

4x10G breakout for FEX connectivity is not supported on Cisco Nexus 9500 Switches.


Note

The Fabric Extender may connect to the switch through several separate physical Ethernet interfaces or at most one port channel interface.


This section describes how to manage Fabric Extender (FEX) on Cisco Nexus Switches through Cisco DCNM.

You can create and manage FEX from Cisco DCNM Inventory > Switches.


Note

FEX tab is visible only if you choose a LAN device.


The following table describes the fields that appear on this page.

Table 2. FEX Operations

Field

Description

Show

Allows you to view various configuration details for the selected FEX ID. You can select the following from the drop-down list.

  • show_diagnostic

  • show_fex

  • show_fex_detail

  • show_fex_fabric

  • show_fex_inventory

  • show_fex_module

The variables for respective show commands are displayed in the Variables area. Review the Variables and click Execute. The output appears in the Output area.

You can create a show template for FEX. Select template type as SHOW and sub type as FEX.

Table 3. FEX Field and Description

Field

Description

Fex Id

Uniquely identifies a Fabric Extender that is connected to a Cisco NX-OS device.

Fex Description

Description that is configured for the Fabric Extender.

Fex Version

Specifies the version of the FEX that is associated with the switch.

Pinning

An integer value that denotes the maximum pinning uplinks of the Fabric Extender that is active at a time.

State

Specifies the status of the FEX as associated with the Cisco Nexus Switch.

Model

Specifies the model of the FEX.

Serial No.

Specifies the configured serial number.

Note 

If this configured serial number and the serial number of the Fabric Extender are not the same, the Fabric Extender will not be active.

Port Channel

Specifies the port channel number to which the FEX is physically connected to the Switch.

Ethernet

Refers to the physical interfaces to which the FEX is connected.

vPC ID

Specifies the vPC ID configured for FEX.

VDCs

This section describes how to manage Virtual Device Contexts (VDCs) on Cisco Nexus 7000 Switches through Cisco DCNM.

Users with the network administrator (network-admin) role can create Virtual Device Contexts (VDCs). VDC resource templates limit the amount of physical device resources available to the VDC. The Cisco NX-OS software provides a default resource template, or you can create resource templates.

You can create and manage VDCs from Cisco DCNM Inventory > Switches > VDCs. As Cisco DCNM supports DCNM on Cisco Nexus 7000 Series only, click an active Cisco Nexus 7000 Switch. After you create a VDC, you can change the interface allocation, VDC resource limits, and the high availability (HA) policies.

The following table describes the fields that appear on this page.

Table 4. Vdc Operations

Field

Description

Add

Click to add a new VDC.

Edit

Select any active VDC radio button and click Edit to edit the VDC configuration.

Delete

Allows you to edit the VDC configuration. Select any active VDC radio button and click Edit to edit the VDC configuration.

Resume

Allows you to delete the VDC. Select any active VDC radio button and click Delete to remove the VDC associated with the device.

Suspend

Allows you to suspend an active non-default VDC.

Save the VDC running configuration to the startup configuration before suspending the VDC. Otherwise, you will lose the changes to the running configuration.

Note 

You cannot suspend the default VDC.

Caution 

Suspending a VDC disrupts all traffic on the VDC.

Rediscover

Allows you to resume a non-default VDC from the suspended state. The VDC resumes with the configuration that is saved in the startup configuration.

Show

Allows you to view the Interfaces and Resources that are allocated to the selected VDC.

In the Interface tab, you can view the mode, admin-status, and operational status for each interface associated with the VDC.

In the Resource tab, you can view the allocation of resources and current usage of these resources.

Table 5. Vdc Table Field and Description

Field

Description

Name

Displays the unique name for the VDC

Type

Species the type of VDC. The two types of VDCs are:

  • Ethernet

  • Storage

Status

Specifies the status of the VDC.

Resource Limit-Module Type

Displays the allocated resource limit and module type.

HA-Policy

  • Single Supervisor

  • Dual Supervisor

Specifies the action that the Cisco NX-OS software takes when an unrecoverable VDC fault occurs.

You can specify the HA policies for single supervisor module and dual supervisor module configurations when you create the VDC. The HA policy options are as follows:

Single supervisor module configuration:

  • Bringdown—Puts the VDC in the failed state. To recover from the failed state, you must reload the physical device.

  • Reload—Reloads the supervisor module.

  • Restart—Takes down the VDC processes and interfaces and restarts it using the startup configuration.

Dual supervisor module configuration:

  • Bringdown—Puts the VDC in the failed state. To recover from the failed state, you must reload the physical device.

  • Restart—Takes down the VDC processes and interfaces and restarts it using the startup configuration.

  • Switchover—Initiates a supervisor module switchover.

The default HA policies for a non-default VDC that you create is restart for a single supervisor module configuration and switchover for a dual supervisor module configuration. The default HA policy for the default VDC is reload for a single supervisor module configuration and switchover for a dual supervisor module configuration.

Mac Address

Specifies the default VDC management MAC address.

Management Interface

  • IP Address Prefix

  • Status

Species the IP Address of the VDC Management interface. The status shows if the interface if up or down.

SSH

Specifies the SSH status

This chapter includes the following sections:

Add VDCs

To add VDC from the Cisco DCNM Web UI, perform the following steps:

Before you begin

Ensure that you have discovered the physical device using a username that has the network-admin role.

Obtain an IPv4 or IPv6 address for the management interface (mgmt 0) if you want to use out-of-band management for the VDC.

Create a storage VDC to run FCoE. The storage VDC cannot be the default VDC and you can have one storage VDC on the device.

Procedure

Step 1

Choose Inventory > Switches > VDC.

The VDC window is displayed.

Step 2

Click the Add VDC icon.

Step 3

From the drop-down list, select the VDC type.

You can configure the VDC in two modes.

  • Ethernet VDC

  • Storage VDC

The default VDC type is Ethernet.

Step 4

Click OK.


Configuring Ethernet VDCs

To configure VDC in Ethernet mode from the Cisco DCNM Web UI, perform the following steps:

Procedure

Step 1

In the General Parameter tab, specify the VDC Name, Single supervisor HA-policy, Dual supervisor HA-policy, and Resource Limit - Module Type.

Step 2

In the Allocate Interface tab, select the network interfaces (dedicated interfaces membership) to be allocated to the VDC.

Click Next.

Step 3

In the Allocate Resource tab, specify the resource limits for the VDC.

Select the radio button and choose Select a Template from existing Templates or Create a New Resource Template. VDC resource templates describe the minimum and maximum resources that the VDC can use. If you do not specify a VDC resource template when you create a VDC, the Cisco NX-OS software uses the default template, vdc-default.

  • If you choose Select a Template from existing Templates, from the Template Name drop-down list, you can select None, global-default, or vdc-default.

    The template resource limits are detailed in the following below:

    Table 6. Template Resource Limits

    Resource

    Minimum

    Maximum

    Global Default VDC Template Resource Limits

    Anycast Bundled

    IPv6 multicast route memory

    8

    8

    Route memory is in megabytes.

    IPv4 multicast route memory

    48

    48

    IPv6 unicast route memory

    32

    32

    IPv4 unicast route memory

    VDC Default Template Resource Limits

    Monitor session extended

    Monitor session mx exception

    Monitor SRC INBAND

    Port Channels

    Monitor DST ERSPAN

    SPAN Sessions

    VLAN

    Anycast Bundled

    IPv6 multicast route memory

    IPv4 multicast route memory

    IPv6 unicast route memory

    IPv4 unicast route memory

    VRF

  • If you choose Create New Resource Template, enter a unique Template Name. In the Resource Limits area, enter the minimum and maximum limits, as required for the resources.

You can edit individual resource limits for a single VDC through the Cisco DCNM Web Client > Inventory > Switches > VDC.

Click Next.

Step 4

In the Authenticate tab, you can allow the Admin to configure the password and also authenticate users using AAA Server Groups.

In the Admin User Area:

  • Check the Enable Password Strength Check checkbox, if necessary.

  • In the Password field, enter the admin user password.

  • In the Confirm Password field, reenter the admin user password.

  • In the Expiry Date field, click the down arrow and choose an expiry date for the admin user from the Expiry Date dialog box. You can also select Never radio button not to expire the password.

In the AAA Server Groups area:

  • In the Group Name field, enter an AAA server group name.

  • In the Servers field, enter one or more host server IPv4 or IPv6 addresses or names, which are separated by commas.

  • In the Type field, choose the type of server group from the drop-down list.

Click Next.

Step 5

In the Management Ip tab, enter IPv4 or IPv6 Address information.

Click Next.

Step 6

In the Summary tab, review the VDC configuration.

Click Previous to edit any parameters.

Click Deploy to configure VDC on the device.

Step 7

In the Deploy tab, the status of the VDC deployment is displayed.

A confirmation message appears. Click Know More to view the commands that are executed to deploy the VDC.

Click Finish to close the VDC configuration wizard and revert to view the list of VDCs configured on the device.


Configuring Storage VDCs

To configure VDCs in storage mode from the Cisco DCNM Web UI, perform the following steps:

Before you begin

Create a separate storage VDC when you run FCoE on the device. Only one of the VDCs can be a storage VDC, and the default VDC cannot be configured as a storage VDC.

You can configure shared interfaces that carry both Ethernet and Fibre Channel traffic. In this specific case, the same interface belongs to more than one VDC. The shared interface is allocated to both an Ethernet and a storage VDC.

Procedure

Step 1

In the General Parameter tab, specify the VDC Name, Single supervisor HA-policy, Dual supervisor HA-policy, and Resource Limit - Module Type.

Step 2

In the Allocate FCoE Vlan tab, select the available Ethernet Vdc from the drop-down list.

The existing Ethernet VLANs range is displayed. Select None not to choose any available Ethernet VDCs.

You can allocate specified FCoE VLANs to the storage VDC and specified interfaces.

Click Next.

Step 3

In the Allocate Interface tab, add the dedicated and shared interfaces to the FCoE VDC.

Note 

The dedicated interface carries only FCoE traffic and the shared interface carries both the Ethernet and the FCoE traffic.

You can configure shared interfaces that carry both Ethernet and Fibre Channel traffic. In this specific case, the same interface belongs to more than one VDC. FCoE VLAN and shared interface can be allocated from same Ethernet VDC.

Click Next.

Step 4

In the Authenticate tab, you can allow the Admin to configure the password and also authenticate users using AAA Server Groups.

In the Admin User Area:

  • Check the Enable Password Strength Check checkbox, if necessary.

  • In the Password field, enter the admin user password.

  • In the Confirm Password field, reenter the admin user password.

  • In the Expiry Date field, click the down arrow and choose an expiry date for the admin user from the Expiry Date dialog box. You can also select Never radio button not to expire the password.

In the AAA Server Groups area:

  • In the Group Name field, enter an AAA server group name.

  • In the Servers field, enter one or more host server IPv4 or IPv6 addresses or names, which are separated by commas.

  • In the Type field, choose the type of server group from the drop-down list.

Click Next.

Step 5

In the Management Ip tab, enter IPv4 or IPv6 Address information.

Click Next.

Step 6

In the Summary tab, review the VDC configuration.

Click Previous to edit any parameters.

Click Deploy to configure VDC on the device.

Step 7

In the Deploy tab, the status of the VDC deployment is displayed.

A confirmation message appears. Click Know More to view the commands that are executed to deploy the VDC.

Click Finish to close the VDC configuration wizard and revert to view the list of VDCs configured on the device.


Edit VDC

To edit VDC from the Cisco DCNM Web UI, perform the following steps:

Procedure

Step 1

Choose Inventory > Switches > VDC.

The VDC window is displayed.

Step 2

Select the VDC radio button that you must edit. Click the Edit VDC icon.

Step 3

Modify the parameters as required.

Step 4

After you review the configuration summary on the Summary tab, click Deploy the VDC with the new configuration.


Viewing Inventory Information for Modules

To view the inventory information for modules from the Cisco DCNM Web UI, perform the following steps:

Procedure


Step 1

Choose Inventory > View > Modules.

The Modules window is displayed with a list of all the switches and its details for a selected Scope.

Step 2

You can view the following information.

  • Group column displays the group name of the module.

  • Switch column displays the switch name on which the module is discovered.

  • Name displays the module name.

  • ModelName displays the model name.

  • SerialNum column displays the serial number.

  • 2nd SerialNum column displays the second serial number.

  • Type column displays the type of the module.

  • Slot column displays the slot number.

  • Hardware Revision column displays the hardware version of the module.

  • Software Revision column displays the software version of the module.

  • Asset ID column displays the asset id of the module.

  • OperStatus column displays the operation status of the module.


Viewing Inventory Information for Licenses

To view the inventory information for licenses from the Cisco DCNM Web UI, perform the following steps:

Procedure


Step 1

Choose Inventory > View > Licenses.

The Licenses window is displayed based on the selected Scope.

Step 2

You can view the following information.

  • Group column displays the group name of switches.

  • Switch column displays the switch name on which the feature is enabled.

  • Feature displays the installed feature.

  • Status displays the usage status of the license.

  • Type column displays the type of the license.

  • Warnings column displays the warning message.


Monitoring Switch

The Switch menu includes the following submenus:

Viewing Switch CPU Information

To view the switch CPU information from the Cisco DCNM Web UI, perform the following steps:

Procedure


Step 1

Choose Monitor > Switch > CPU.

The CPU window is displayed. This window displays the CPU information for the switches in that scope.

Step 2

You can use the drop-down to filter the view by Last 10 Minutes, Last Hour, Last Day, Last Week, Last Month, and Last Year.

Step 3

In the Switch column, click the switch name to view the Switch Dashboard.

Step 4

Click the chart icon in the Switch column to view the CPU utilization.

You can also change the chart timeline to Last 10 Minutes, Last Hour, Last Day, Last Week, Last Month, and Last Year. You can choose the chart type and chart options to show as well.


Viewing Switch Memory Information

To view the switch memory information from the Cisco DCNM Web UI, perform the following steps:

Procedure


Step 1

Choose Monitor > Switch > Memory.

The memory panel is displayed. This panel displays the memory information for the switches in that scope.

Step 2

Use the drop-down to filter the view by Last 10 Minutes, Last Hour, Last Day, Last Week, Last Month, and Last Year.

Step 3

Click the chart icon in the Switch column to see a graph of the memory usage of the switch.

Step 4

In the Switch column, click the switch name to view the Switch Dashboard.

Step 5

You can use the drop-down to view the chart in different time lines. Use the chart icons to view the memory utilization chart in varied views.


Viewing Switch Traffic and Errors Information

To view the switch traffic and errors information from the Cisco DCNM Web UI, perform the following steps:

Procedure


Step 1

Choose Monitor > Switch > Traffic.

The Switch Traffic panel is displayed. This panel displays the traffic on that device for the past 24 hours.

Step 2

Use the drop-down to filter the view by 24 hours, Week, Month, and Year.

Step 3

Click the Export icon in the upper-right corner to export the data into a spreadsheet.

Step 4

Click Save.

Step 5

Click the switch name to view the Switch Dashboard section.


Viewing Switch Temperature

Cisco DCNM includes the module temperature sensor monitoring feature, using which you can view the sensor temperature of a switch. You can choose an interval by which to filter the sensor list. The default interval is Last Day. Only sensors that have historical temperature data is shown in the list. You can choose between Last ten Minutes, Last Hour, Last Day, Last Week, and Last Month.

Note

It is not necessary to configure the LAN credentials under the Configure > Credentials Management > LAN Credentials screen to fetch the temperature monitoring data from the switches.


To view the switch temperature information from the Cisco DCNM Web UI, perform the following steps:

Procedure


Step 1

Choose Monitor > Switch > Temperature.

The Switch Temperature window is displayed with the following columns.

  • Scope: The sensor belongs to a switch, which is part of a fabric. The fabric that it belongs to is shown as its scope. When the scope selector at the top of Cisco DCNM is used, the sensor list is filtered by that scope.
  • Switch: Name of the switch the sensor belongs to.
  • IP Address: IP Address of the switch.
  • Temperature Module: The name of the sensor module.
  • Avg/Range: The first number is the average temperature over the interval that is specified at the top of the table. The second set of numbers is the range of the temperature over that interval.
  • Peak: The maximum temperature over the interval
Step 2

From this list, each row has a chart icon, which you can click.

A chart is displayed, which shows historical data for the sensor. The interval for this chart can be changed as well, between 24 hours, 1 week, and 1 month.

Enabling Temperature Monitoring

You can enable the temperature monitoring feature for LAN switches from the LAN Collections screen, and for the SAN switches by setting a few properties under Administration > DCNM Server > Server Properties screens.

Enabling Temperature Monitoring for LAN Switches
  1. From the menu bar, choose Administration > Performance Setup > LAN Collections.

  2. Select the Temperature Sensor check box.

  3. Select the type of LAN switches for which you want to collect performance data.

  4. Click Apply to save the configuration.

Viewing Accounting Information

To view the accounting information from the Cisco DCNM Web UI, perform the following steps:

Procedure


Step 1

Choose Monitor > Switch > Accounting.

The fabric name or the group name along with the accounting information is displayed.

Step 2

Select Advanced Filter beside the filter icon to search the accounting information by Source, Username,Time, and Description. Or select Quick Filter to search under each column.

Step 3

You can also select a row and click the Delete icon to delete accounting information from the list.

Step 4

You can use the Print icon to print the accounting details and use the Export icon to export the data to a Microsoft Excel spreadsheet.


Viewing Events Information

To view the events and syslog from the Cisco DCNM Web UI, perform the following steps:

Procedure


Step 1

Choose Monitor > Switch > Events.

The fabrics along with the switch name and the events details are displayed.

The Count column displays the number of times the same event has occurred during the time period as shown in the Last Seen and First Seen columns.

Click a switch name in the Switch column to view the switch dashboard.

Step 2

Select an event in the table and click the Add Suppressor icon to open the shortcut of adding an event suppressor rule.

Step 3

Select one or more events from the table and click the Acknowledge icon to acknowledge the event information for the fabric.

  • After you acknowledge the event for a fabric, the acknowledge icon is displayed in the Ack column next to the fabric.
Step 4

Select the fabric and click the Unacknowledge icon to cancel an acknowledgment for a fabric.

Step 5

Select Advanced Filter beside the filter icon to search the accounting information by Source, Username,Time, and Description. Or select Quick Filter to search under each column.

Step 6

Select a fabric and use the Delete icon to delete the fabric and event information from the list.

Step 7

Click the Print icon to print the event details.

Step 8

Click the Export to Excel icon to export the data.


Monitoring LAN

The LAN menu includes the following submenus:

Monitoring Performance Information for Ethernet

To monitor the performance information for ethernet from the Cisco DCNM Web UI, perform the following steps:

Procedure


Step 1

Choose Monitor > LAN > Ethernet.

The Ethernet window is displayed.

Step 2

You can use the drop-down to filter the view by Last 10 Minutes, Last Hour, Last Day, Last Week, Last Month, and Last Year.

There are variations to this procedure. In addition to these basic steps, you can also perform the following steps:

  • Select the name of an Ethernet port from the Name column to see a graph of the traffic across that Ethernet port for the past 24 hours. You can change the time range for this graph by selecting it from the drop-down list in the upper-right corner.

  • To export the data into a spreadsheet, click the Export icon in the upper-right corner and click Save.

  • Use the chart icons to view the traffic chart in varied views. You can also use the icons to Append, Predict, and Do not interpolate data.

    Note 

    Set the pmchart.doInterpolate property in the Server Properties window to false to use the Do not interpolate data option.

  • For the Rx/Tx calculation, see the following Rx/Tx calculation.

    Note 
    The conversion for Fabrics is 10 bit = 1 byte and for LAN traffic, the conversion is 8 bit = 1 byte.
    • Average Rx/Tx % = Average Rx/Tx divided by Speed * 100

    • Peak Rx/Tx % = Peak Rx/Tx divided by Speed * 100

Note 
If the performance tables do not contain any data, see the Thresholds section to turn on performance data collection.

Monitoring ISL Traffic and Errors

To monitor the ISL traffic and errors from the Cisco DCNM Web UI, perform the following steps:

Procedure


Step 1

Choose Monitor > LAN > Link.

The ISL Traffic and Errors window is displayed. This panel displays the ISL information for the end devices in that scope. You can reduce or expand the scope of what is displayed by using the scope menu.

Step 2

You can use the drop-down to filter the view by Last 10 Minutes, Last Hour, Last Day, Last Week, Last Month, and Last Year.

Note 
NaN (Not a Number) in the data grid means that the data is not available.

There are variations to this procedure. In addition to these basic steps, you can perform the following steps to view detailed information for ISLs:

  • To change the time range for this graph, select it from the drop-down list in the upper-right corner.

  • To view the detailed information for a specific period, drag the slider control to choose the time interval for which you need the information.

  • Use the chart icons to view the traffic chart in varied views. You can also use the icons to Append, Predict, and Do not interpolate data.

    Note 

    Set the pmchart.doInterpolate property in the Server Properties window to false to use the Do not interpolate data option.

  • To export the data into a spreadsheet, choose Export from the drop-down list in the Chart menu and then click Save.

  • For the Rx/Tx calculation, see the following Rx/Tx calculation.

    Note 
    The conversion for Fabrics is 10 bit = 1 byte and for LAN traffic, the conversion is 8 bit = 1 byte.
    • Average Rx/Tx % = Average Rx/Tx divided by Speed * 100

    • Peak Rx/Tx % = Peak Rx/Tx divided by Speed * 100

Note 
If the performance tables do not contain any data, see the Performance Setup Thresholds section to turn on performance.

Monitoring a vPC

The virtual port channel (vPC) feature enables you to view the links that are physically connected to different devices as a single port channel. A vPC is an extended form of a port channel which allows you to create redundancy and increase bisectional bandwidth by enabling multiple parallel paths between nodes and allowing load balancing traffic. Traffic is distributed among two single device vPC endpoints. If there is an inconsistency in the vPC configurations, the vPC does not function correctly.


Note

To view the vPC in vPC Performance, both primary and secondary device should be designated to the user. If either one kind of switch is not designated, vPC information is isplayed.


Cisco DCNM Web Client > Monitor> vPC displays only consistent vPCs displays both the consistent and inconsistent vPCs.

You can identify the inconsistent vPCs and resolve the inconsistencies in each vPC by using the Cisco DCNM Web UI > Configure > Deploy > vPC Peer and Web Client > Configure > Deploy > vPC.

Table 1 displays the following vPC configuration details in the data grid view.

Table 7. vPC Performance

Column

Description

Search box

Enter any string to filter the entries in their respective column.

vPC ID

Displays vPC ID's configured device.

Domain ID

Displays the domain ID of the vPC peer switches.

Multi Chassis vPC EndPoints

Displays the multi-chassis vPC endpoints for each vPC ID under a vPC domain.

Primary vPC Peer - Device Name

Displays the vPC Primary device name.

Primary vPC Peer - Primary vPC Interface

Displays the primary vPC interface.

Primary vPC Peer - Capacity

Displays the capacity for the primary vPC peer.

Primary vPC Peer - Avg. Rx/sec

Displays the average receiving speed of primary vPC peer.

Primary vPC Peer - Avg. Tx/sec

Displays the average sending speed of primary vPC peer.

Primary vPC Peer - Peak Util%

Displays the peak utilization percentage of primary vPC peer.

Secondary vPC Peer - Device Name

Displays the vPC secondary device name.

Secondary vPC Interface

Displays the secondary vPC interface.

Secondary vPC Peer - Capacity

Displays the capacity for the secondary vPC peer.

Secondary vPC Peer - Avg. Rx/sec

Displays the average receiving speed of secondary vPC peer.

Secondary vPC Peer - Avg. Tx/sec

Displays the average sending speed of secondary vPC peer.

Secondary vPC Peer - Peak Util%

Displays the peak utilization percentage of secondary vPC peer.

You can use this feature as following:

Monitoring vPC Performance

You can view the relationship among consistent virtual port channels (vPCs). You can view the statistics of all member interfaces and the aggregate of the statistics at the port-channel level.


Note

This tab only displays consistent vPCs.


To view the VPC performance information from the Cisco DCNM Web UI, perform the following steps:

Procedure

Step 1

Choose Monitor > LAN > vPC.

The vPC Performance statistics is displayed. The aggregated statistics of all vPCs are displayed in a tabular manner.

Step 2

Click the vPC ID.

The vPC topology, vPC Details, Peer-link Details, and Peer-link Status are displayed.

The vPC Consistency, Peer-link Consistency, and vPC Type2 Consistency for the vPC are displayed.

  • Click the vPC Details tab, you can view the parameter details of vPC Basic Setting and Layer 2 Settings for both Primary and Secondary vPC devices.

  • Click the Peer-link Details tab, to view the parameter details of peer-link vPC Global Setting and STP Global Settings for both Primary and Secondary vPC devices.

  • Click the Peer-link Status tab, the vPC Consistency, and Peer-Link Consistency status is displayed. The parameter details of Role Status and vPC Peer keep-alive Status for both Primary and Secondary vPC devices is also displayed.

Step 3

Click the peer-link icon in front of the Device Name in the Primary vPC peer or Secondary vPC peer column to view its member interface.

Step 4

Click the Show Chart icon of the corresponding interface to view its historical statistics.

The traffic distribution statistics appear at the bottom of the vPC window. By default, the Cisco DCNM Web Client displays the historical statistics for 24 hours.

There are variations to this procedure. In addition to these basic steps, you can also perform the following steps to view detailed information for flows:

  • To change the time range for this graph, select it from the drop-down list in the upper right corner.

  • To view the detailed information for a specific period, drag the slider control to choose the time interval for which you need the information.

  • Use the chart icons to view the traffic chart in varied views.

  • You can also use the icons to Append, Predict, and Do not interpolate data.

    Note 

    Set the pmchart.doInterpolate property in the Server Properties window to false to use the Do not interpolate data option.

  • To print the vPC Utilization data, click the Print icon in the upper-right corner. The vPC Utilization page appears.

  • To export the data into a spreadsheet, click the Export icon in the upper-right corner and click Save File.

Note 
If the performance tables do not contain any data, see the Thresholds section to turn on performance data collection.

Monitoring Endpoint Locator

Information about the Endpoint Locator is displayed on a single landing page or dashboard. The dashboard displays an almost real-time view of data (refreshed every 30 seconds) pertaining to all the active endpoints on a single pane. The data that is displayed on this dashboard is dependent on the scope selected by you from the SCOPE drop-down list. The DCNM scope hierarchy starts with the fabrics. Fabrics can be grouped into a Multi-Site Domain (MSD). A group of MSDs constitute a Data Center. The data that is displayed on the Endpoint Locator dashboard is aggregated based on the selected scope. From this dashboard, you can access Endpoint History, Endpoint Search, and Endpoint Life.

Endpoint Locator Dashboard

To explore endpoint locator details from the Cisco DCNM Web UI, choose Monitor > Endpoint Locator > Explore. The Endpoint Locator dashboard is displayed.


Note

Due to an increase in scale from Cisco DCNM Release 11.3(1), the system may take some time to collect endpoint data and display it on the dashboard. Also, on bulk addition or removal of endpoints, the endpoint information displayed on the EPL dashboard takes a few minutes to refresh and display the latest endpoint data.


You can also filter and view the endpoint locator details for a specific Switch, VRF, Network, and Type, by using the respective drop-down lists. Starting from Cisco DCNM Release 11.3(1), you can select MAC type of endpoints as a filter attribute. By default, the selected option is All for these fields. You can also display endpoint data for a specific host by entering the IP and MAC address of a host in the Search Host IP and MAC field. You can reset the filters to the default options by clicking the Reset Filters icon.

The 'top pane' of the window displays the number of active endpoints, active VRFs, active networks, dual attached endpoints, single attached endpoints and dual stacked endpoints, for the selected scope. Support for displaying the number of dual attached endpoints, single attached endpoints and dual stacked endpoints has been added from Cisco DCNM Release 11.3(1). A dual attached endpoint is an endpoint that is behind at least two switches. A dual stacked endpoint is an endpoint that has at least one IPv4 address and one IPv6 address.

Historical analysis of data is performed and a statement mentioning if any deviation has occurred or not over the previous day is displayed at the bottom of each tile.

Click any tile in the top pane of the EPL dashboard to go to the Endpoint History window.

The 'middle pane' of the window displays the following information:

  • Top 10 Networks by Endpoints - A pie chart is displayed depicting the top ten networks that have the most number of endpoints. Hover over the pie chart to display more information. Click on the required section to view the the number of IPv4, IPv6 and MAC addresses.

  • Top 10 Switches by Endpoints - A pie chart is displayed depicting the top ten switches that are connected to the most number of endpoints. Hover over the pie chart to display more information. Click on the required section to view the the number of IPv4, IPv6 and MAC addresses.

  • Top Switches by Networks - Bar graphs are displayed depicting the top 5 networks that have the most number of switches that are connected to endpoints. In the screenshot given below, in network 30001, there is at least 1 endpoint below 2 switches. Hover over the bar graph to display more information.

  • Recent Notifications - A list of the last 10 notifications is displayed. Notifications are generated for events such as Duplicate IP addresses, Duplicate MAC-Only addresses, VRF disappears from a fabric, all endpoints disappear from a switch, Endpoint moves, Endpoints on a fabric going to zero, when a switch appears for the first time, when the RR BGP connectivity status changes (RR connected status indicates that the RR is connected and the underlying Border Gateway Protocol, or BGP, is functioning normally. RR disconnected status indicates that the RR is disconnected and the underlying BGP is not functioning), and when a new VRF is detected. Click the More icon at the top right of this window to display the Notifications window. You can view the list of notifications and also delete notifications from this window by clicking Delete. Click the download icon to download list of the notifications as a CSV file.

The 'bottom pane' of the window displays the list of active endpoints.

Click the search icon in the Endpoint Identifier column to search for specific IP addresses.

In certain scenarios, the datapoint database may go out-of-sync and information, such as the number of endpoints, may not be displayed correctly due to network issues such as -

  • Endpoint moves under the same switch between ports and the port information needs some time to be updated.

  • An orphan endpoint is attached to the second VPC switch and is no longer an orphan endpoint.

  • NX-API not enabled initially and then enabled at a later point in time.

  • NX-API failing initially due to misconfiguration.

  • Change in Route Reflector (RR).

  • Management IPs of the switches are updated.

In such cases, clicking the Resync icon wipes out the data collected in the DCNM elasticsearch database for the specified fabric and then syncs again to the data currently in the RR. We recommend not clicking Resync multiple times as this is a compute intense activity.

Click the Pause icon to temporarily stop the near real-time collection and display of data.

Consider a scenario in which EPL is first enabled and the Process MAC-Only Advertisements checkbox is selected. Then, EPL is disabled and enabled again without selecting the Process MAC-Only Advertisements checkbox. As the cache data in elasticsearch is not deleted on disabling of EPL, the MAC endpoint information is still displayed in the EPL dashboard. The same behavior is observed when a Route-Reflector is disconnected. Depending on the scale, the endpoints are deleted from the EPL dashboard after some time. In certain cases, it may take up to 30 minutes to remove the older MAC-only endpoints. However, to display the latest endpoint data, you can click the Resync icon at the top right of the EPL dashboard.

Endpoint History

Click any tile in the top pane of the EPL dashboard to go to the Endpoint History window. A graph depicting the number of active endpoints, VRFs and networks, dual attached endpoints and dual stacked MAC endpoints at various points in time is displayed. The graphs that are displayed here depict all the endpoints and not only the endpoints that are present in the selected fabric. Endpoint history information is available for the last 180 days amounting to a maximum of 100 Gb storage space.

Hover over the graph at specific points to display more information. Click on each point in the graph to display detailed information at that point of time. You can display the graph for a specific requirement by clicking the color-coded points at the bottom of each graph. For example, click on all color-coded points other than active (IPv4) in the Active Endpoints window displayed above such that only active (IPv4) is highlighted and the other points are not highlighted. In such a scenario, only the active IPv4 endpoints are displayed on the graph. Click the Download icon at the top right of the Endpoints window to download the data as a CSV file.

Endpoint Snapshots

Starting from Cisco DCNM Release 11.3(1), you can compare endpoint data at two specific points in time within the last 15 days. To display the Endpoint Snapshot window, click the Endpoint Snapshot icon at the top right of the Active Endpoints graph in the Endpoint History window.

By default, endpoint snapshot comparison data for the previous hour is displayed.

To compare endpoint snapshots at specific points in time, select two points in time, say T1 and T2, and click Generate.

A comparison of the endpoints, VRFs and networks at the selected points in time are displayed. Click each tile to download more information about the endpoints, VRFs or networks. Click the Difference icon to download details about the differences in data for the specified time interval. Snapshots are stored for a maximum of three months and then discarded.

Endpoint Search

Click the Endpoint Search icon at the top right of the Endpoint Locator landing page to view a real-time plot displaying endpoint events for the period specified in a date range.

You can search for a specific metric value in the search bar. Search is supported on any of the fields as specified under the Available Fields column from the menu on the left.

Endpoint Life

Click the Endpoint Life icon at the top right of the Endpoint Locator landing page to display a time line of a particular endpoint in its entire existence within the fabric.

Specify the IP address of an endpoint and the VXLAN Network Identifier (VNI) to display the list of switches that an endpoint was present under, including the associated start and end dates. Click Submit.

The window that is displayed is essentially the endpoint life of a specific endpoint. The bar that is orange in color represents the active endpoint on that switch. If the endpoint is viewed as active by the network, it will have a band here. If an endpoint is dual-homed, then there will be 2 horizontal bands reporting the endpoint existence, one band for each switch (typically the vPC pair of switches). In case the endpoints are deleted or moved, you can also see the historical endpoint deletions and moves on this window.

LAN Telemetry

The LAN Telemetry menu includes the following submenus:

Monitoring LAN Telemetry

Once LAN telemetry has been successfully enabled, the LAN Telemetry Summary window is available. You can navigate to the LAN Telemetry Summary window by choosing Monitor > LAN Telemetry > Explore. Select the fabric (for example, Default_LAN) for which LAN telemetry has been enabled through the SCOPE at the top.

There are six insights (Alerts, Physical Overview, Logical Overview, Control Plane, Interface, and Environment) shown through interactive visualizations depicting different aspects of switch metrics. Click the Alerts, Physical Overview, Logical Overview, Control Plane, and Interface tiles to find more information about the metrics. On the Environment tile, click the donut chart icons to display more information. The Environment tile displays metrics for CPU usage, Memory, Temperature, Power, and Fans.

Alerts

The Alerts tile displays the number of alerts that have occurred. The alerts are classified as Critical, Major, Minor, and Info. Each kind of alert is associated with a specific color.

  1. Click the Alerts tile for more information about the alerts. You can select a specific switch for which you want to display the metrics. You can also select All Switches to display metrics for all the switches in the selected fabric.

  2. You can select a specific time interval to view the alerts that have occurred in that time interval. Click the fields showing the date and time to select the required date and time interval. Click Now to display metrics for the current date and time. Click the Refresh icon next to the switch selection dropdown to display metrics for the last 30 minutes.

  3. Hover over specific points on the graph for the time at which the alert has occurred.

  4. Click the icon at the top right of the graph to download the graph as a PNG image, PDF document, JPEG image or an XLS file.

  5. The bottom of the page has the following fields: Creation Time, Severity, Switch Name, Affected Object and Description. These fields provide more information about each alert. Click the filter icon next to Severity to filter the alerts based on severity level.

  6. Click the icon next to Alerts at the top of the window to go back to the LAN Telemetry Summary window.

Interface

The Interface tile displays the Inter-Switch Link Utilization and Host Interface Utilization metrics. It shows the number of Inter-Switch Links in the fabric along with the associated percentage, and the number of host interfaces that are utilized to send and receive data from hosts along with the associated percentage. On the top right of the Interface tile, you can see the number of interfaces that are down next to the red dot and the number of interfaces that are up next to the green dot along with the total number of interfaces in the fabric.

  1. Click the Interface tile to display more information about the ISLs and Host Interfaces. On the Interface window, you can select a specific switch for which you want to display the metrics.

    Select All Switches to display metrics for all the switches in the selected fabric. This window displays the top five switches based on the number of anomalies, top five ISLs, and the top five host facing links. In the graph displaying the top five switches based on the number of anomalies, each switch has a specific color that is associated with it in the graph. In the graph for the Top 5 Inter-Switch Links and the Top 5 Host Facing links, each switch interface has a specific color that is associated with it in the graph. You can see the colors that are associated with the switches and interfaces on the right of the graphs.

  2. You can select a specific time interval to view the metrics during that time interval. Click the fields showing the date and time to select the required date and time interval. Click Now to display metrics for the current date and time. Click the Refresh icon next to the switch selection dropdown to display metrics for the last 30 minutes.

  3. Hover over specific points on the respective graphs for more information on the switch anomalies and ISLs at a specific time.

    In the graph for Host Facing links, you can toggle between displaying the top five host facing links based on sending traffic (TX) and the top five host facing links based on receiving traffic (RX).

  4. Click the icon at the top right of the graph to download the graph as a PNG image, PDF document, JPEG image or an XLS file.

  5. Click the icon next to Interface at the top of the window to go back to the LAN Telemetry Summary window.

Physical Overview

The Physical Overview tile displays the number of switches, Virtual Port Channel (VPC) peers, and Transceivers in the specified fabric.

  1. Click the Physical Overview tile to display more information about the VPC peers and Transceivers. On the Physical Overview window, you can select a specific switch from the drop-down list for which you want to display the metrics. You can select All Switches to display metrics for all the switches in the selected fabric.

  2. You can select a specific time interval to view the metrics during that time interval. Click the fields showing the date and time to select the required date and time interval. Click Now to display metrics for the current date and time. Click the Refresh icon next to the switch selection dropdown to display metrics for the last 30 minutes.

  3. Hover over specific points on the respective graphs to display the number of VPC peers and Transceivers that are associated with a switch at a specific time.

  4. Click the icon at the top right of the graph to download the graph as a PNG image, PDF document, JPEG image or an XLS file.

  5. Click the icon next to Physical Overview at the top of the window to go back to the LAN Telemetry Summary window.

Logical Overview

The Logical Overview tile displays the number of Virtual Routing and Forwarding instances (VRFs), VLANs, and VXLAN Tunnel Endpoints (VTEPs) in the specified fabric.

  1. Click the Logical Overview tile to display more information about the VRFs, VLANs, and VTEPs. On the Logical Overview window, you can select a specific switch from the drop-down list for which you want to display the metrics. You can select All Switches to display metrics for all the switches in the selected fabric.

  2. You can select a specific time interval to view the metrics during that time interval. Click the fields showing the date and time to select the required date and time interval. Click Now to display metrics for the current date and time. Click the Refresh icon next to the switch selection dropdown to display metrics for the last 30 minutes.

  3. Hover over specific points on the respective graphs to display the number of VRFs, VLANs, and VTEPs associated with a switch at a specific time.

  4. Click the icon at the top right of the graph to download the graph as a PNG image, PDF document, JPEG image or an XLS file.

  5. Click the icon next to Logical Overview at the top of the window to go back to the LAN Telemetry Summary window.

Control Plane

The Control Plane tile displays the number of Border Gateway Protocol (BGP) sessions, Open Shortest Path First (OSPF) sessions, and Intermediate System-to-Intermediate System (IS-IS) sessions in the specified fabric.

  1. Click the Control Plane tile to display more information about the BGP sessions, OSPF sessions, and IS-IS sessions. On the Control Plane window, you can select a specific switch from the drop-down list for which you want to display the metrics. You can select All Switches to display metrics for all the switches in the selected fabric.

  2. You can select a specific time interval to view the metrics during that time interval. Click the fields showing the date and time to select the required date and time interval. Click Now to display metrics for the current date and time. Click the Refresh icon next to the switch selection dropdown to display metrics for the last 30 minutes.

  3. Hover over specific points on the respective graphs to display the number of BGP sessions, OSPF sessions, and IS-IS sessions associated with a switch at a specific time.

  4. Click the icon at the top right of the graph to download the graph as a PNG image, PDF document, JPEG image or an XLS file.

  5. Click the icon next to Control Plane at the top of the window to go back to the LAN Telemetry Summary window.

Environment

The Environment tile displays metrics for CPU usage, Memory, Temperature, Power, and Fans. On the top right of the Environment tile, you can select the Top N switches from the dropdown to display metrics for the top N switches. For example, if Top 5 is selected, donut charts are plotted for the top five switches based on specific metrics.

Environment - CPU

The first donut chart shows the proportion of top five or top ten switches based on CPU usage values. When hovered, it shows the switch name and the corresponding metric value.

  1. Click the CPU usage donut to display more information about CPU usage. On the Environment: CPU window, you can select a specific switch from the drop-down list for which you want to display the metrics.

    You can select All Switches to display metrics for all the switches in the selected fabric. This window displays the top five switches based on the number of anomalies and top five switches based on CPU utilization. Each switch has a specific color that is associated with it in the graph. You can see the colors that are associated with the switches on the right of the graph.

  2. You can select a specific time interval to view the metrics during that time interval. Click the fields showing the date and time to select the required date and time interval. Click Now to display metrics for the current date and time. Click the Refresh icon next to the switch selection dropdown to display metrics for the last 30 minutes.

  3. Hover over specific points on the graph for more information on CPU utilization at a specific time.

  4. Click the icon at the top right of the graph to download the graph as a PNG image, PDF document, JPEG image or an XLS file.

  5. Click the icon next to Environment: CPU at the top of the window to go back to the LAN Telemetry Summary window.

Environment - Memory

The second donut chart shows the proportion of top five or top ten switches based on memory usage values. When hovered, it shows the switch name and the corresponding metric value.

  1. Click the memory usage donut to display more information about memory usage. The memory dashboard depicts the actual memory consumption (RAM) on every switch in Gigabytes (GB). On the Environment: Memory window, you can select a specific switch from the drop-down list for which you want to display the metrics.

    You can select All Switches to display metrics for all the switches in the selected fabric. This window displays the top five switches based on the number of anomalies and top five switches based on memory utilization. Each switch has a specific color that is associated with it in the graph. You can see the colors that are associated with the switches on the right of the graph.

  2. You can select a specific time interval to view the metrics during that time interval. Click the fields showing the date and time to select the required date and time interval. Click Now to display metrics for the current date and time. Click the Refresh icon next to the switch selection dropdown to display metrics for the last 30 minutes.

  3. Hover over specific points on the respective graphs for more information on memory utilization at a specific time.

  4. Click the icon at the top right of the graph to download the graph as a PNG image, PDF document, JPEG image or an XLS file.

  5. Click the icon next to Environment: Memory at the top of the window to go back to the LAN Telemetry Summary window.

Environment - Temperature

The third donut chart shows the proportion of top five or top ten switches based on temperature levels. When hovered, it shows the switch name and the corresponding metric value.

  1. Click the temperature levels donut to display more information about temperature levels for the switches in the fabric. On the Environment: Temperature window, you can select a specific switch from the drop-down list for which you want to display the metrics.

    You can select All Switches to display metrics for all the switches in the selected fabric. This window displays the top five switches based on the number of anomalies and top five switches based on temperature. Each switch has a specific color that is associated with it in the graph. You can see the colors that are associated with the switches on the right of the graph.

  2. You can select a specific time interval to view the metrics during that time interval. Click the fields showing the date and time to select the required date and time interval. Click Now to display metrics for the current date and time. Click the Refresh icon next to the switch selection dropdown to display metrics for the last 30 minutes.

  3. Hover over specific points on the graph for more information on the temperature of the selected switch at a specific time.

  4. Click the icon at the top right of the graph to download the graph as a PNG image, PDF document, JPEG image or an XLS file.

  5. Click the icon next to Environment: Temperature at the top of the window to go back to the LAN Telemetry Summary window.

Environment - Power

The fourth donut chart shows the proportion of top five or top ten switches based on the power usage or efficiency of the power supplies. When hovered, it shows the switch name and the corresponding metric value.

  1. Click the Power donut to display more information about the power efficiency metrics for the switches in the fabric. On the Environment: Power window, you can select a specific switch from the drop-down list for which you want to display the metrics.

    You can select All Switches to display metrics for the top five switches based on anomalies and the top five switches based on power usage or efficiency. By definition, efficiency is Output-Power/Input-Power, which therefore results in a maximum efficiency of 1.0. Each switch has a specific color that is associated with it in the graph. You can see the colors that are associated with the switches on the right of the graph.

  2. You can select a specific time interval to view the metrics during that time interval. Click the fields showing the date and time to select the required date and time interval. Click Now to display metrics for the current date and time. Click the Refresh icon next to the switch selection dropdown to display metrics for the last 30 minutes.

  3. Hover over specific points on the graph for more information on the power efficiency or usage at a specific time.

  4. Click the icon at the top right of the graph to download the graph as a PNG image, PDF document, JPEG image or an XLS file.

  5. Click the icon next to Environment: Power at the top of the window to go back to the LAN Telemetry Summary window.

Environment - Fan

The fifth donut chart shows the proportion of top five or top ten switches based on fan utilization. When hovered, it shows the switch name and the corresponding metric value.

  1. Click the Fan donut to display more information about the fan utilization. On the Environment: Fan window, you can select a specific switch from the drop-down list for which you want to display the metrics.

    You can select All Switches to display metrics for the top five switches based on the number of anomalies and the top five switches based on fan utilization. Each switch has a specific color that is associated with it in the graph. You can see the colors that are associated with the switches on the right of the graph.

  2. You can select a specific time interval to view the metrics during that time interval. Click the fields showing the date and time to select the required date and time interval. Click Now to display metrics for the current date and time. Click the Refresh icon next to the switch selection dropdown to display metrics for the last 30 minutes.

  3. Hover over specific points on the respective graphs for more info on fan utilization at a specific time.

  4. Click the icon at the top right of the graph to download the graph as a PNG image, PDF document, JPEG image or an XLS file.

  5. Click the icon next to Environment: Fan at the top of the window to go back to the LAN Telemetry Summary window.

Alarms

The Alarms menu includes the following submenus:

Viewing Alarms and Events

You can view the alarms, cleared alarms, and events.

Procedure


Step 1

Choose Monitor > Alarms > View.

Step 2

Choose any of the following tabs.

  • Alarms: This tab displays the alarms that are generated for various categories. This tab displays information such as ID (optional), Severity, Failure Source, Name, Category, Acknowledged, Creation Time, Last Updated (optional), Policy, and Message. You can specify the Refresh Interval in this tab. You can select one or more alarms and then acknowledge or unacknowledge their status using the Change Status drop-down list. In addition, you can select one or more alarms and then click the Delete button to delete them.
  • Cleared Alarms: This tab displays the cleared alarms. This tab displays information such as ID (optional), Severity, Failure Source, Name, Category, Acknowledged, Creation Time, Cleared At (optional), Cleared By, Policy, and Message. You can select one or more alarms and then click the Delete button to delete them.
  • Events: This tab displays the events that are generated for the switches. This tab displays information such as Ack, Acknowledged user, Group, Switch, Severity, Facility, Type, Count, Last Seen, and Description. You can select one or more events and then acknowledge or unacknowledge their status using the Change Status drop-down list. In addition, you can select one or more alarms and then click the Delete button to delete them. If you want to delete all events, click the Delete All button.

Monitoring and Adding Alarm Policies


Note

Alarm policies are stored in compute nodes. Therefore, run the appmgr backup command on each compute node in addition to taking a backup of DCNM.


You can add alarm policies for the following:

  • Device Health: Device health policies enable you to create alarms when Device ICMP Unreachable, Device SNMP Unreachable, or Device SSH Unreachable. Also, these policies enable you to monitor chassis temperature, CPU, and memory usage.

  • Interface Health: Interface health policies enable you to monitor Up or Down, Packet Discard, Error, Bandwidth details of the interfaces. By default all interfaces are selected for monitoring.

  • Syslog Alarm: Syslog Alarm Policy defines a pair of Syslog messages formats; one which raises the alarm, and one which clears the alarm.

Procedure


Step 1

Choose Monitor > Alarms > Alarm Policies.

Step 2

Select the Enable Alarms check box to enable alarm policies.

Step 3

From the Add drop-down list, choose any of the following:

  • Device Health Policy: Select the devices for which you want to create policies. Specify the policy name, description, CPU Utilization parameters, Memory Utilization parameters, Environment Temperature parameters, device availability, and device features. Under Device Features, you can select the BFD, BGP, and HSRP protocols. When these checkboxes are selected, alarms are triggered for the following traps: BFD- ciscoBfdSessDown, ciscoBfdSessUp, BGP- bgpEstablishedNotification, bgpBackwardTransNotification, cbgpPeer2BackwardTransition (), cbgpPeer2EstablishedNotification, and HSRP- cHsrpStateChange. Please refer https://snmp.cloudapps.cisco.com/Support/SNMP/do/BrowseOID.do?local=en for detailed trap OID definition.
  • Interface Health Policy: Select the devices for which you want to create policies. Specify the policy name, description, link-state, Bandwidth (In/Out), Inbound errors, Outbound errors, Inbound Discards, and Outbound Discards.
  • Syslog Alarm Policy: Select the devices for which you want to create policies and then specify the following parameters.
    • Devices: Define the scope of this policy. Select individual devices or all devices to apply this policy.

    • Policy Name: Specify the name for this policy. It must be unique.

    • Description: Specify a brief description for this policy.

    • Severity: Define the severity level for this syslog alarm policy. Choices are: Critical, Major, Minor, and Warning.

    • Identifier: Specify the identifier portions of the raise & clear messages.

    • Raise Regex: Define the format of a syslog raise message. The syntax is as follows: Facility-Severity-Type: Message

    • Clear Regex: Define the format of a syslog clear message. The syntax is as follows: Facility-Severity-Type: Message

    Table 8. Example 1

    Identifier

    ID1-ID2

    Raise Regex

    ETHPORT-5-IF_ADMIN_UP: Interface Ethernet15/1 is admin up .

    Clear Regex

    ETHPORT-5-IF_DOWN_NONE: Interface Ethernet15/1 is down (Transceiver Absent)

    In the above example, the regex expressions are part of the syslog messages that appear in the terminal monitor.

    Table 9. Example 2

    Identifier

    ID1-ID2

    Raise Regex

    ETH_PORT_CHANNEL-5-PORT_DOWN: $(ID1): $(ID2) is down

    Clear Regex

    ETH_PORT_CHANNEL-5-PORT_UP: $(ID1): $(ID2) is up

    Table 10. Example 3

    Identifier

    ID1-ID2

    Raise Regex

    ETHPORT-5-IF_SFP_WARNING: Interface $(ID1), High Rx Power Warning

    Clear Regex

    ETHPORT-5-IF_SFP_WARNING: Interface $(ID1), High Rx Power Warning cleared

Step 4

Click OK to add the policy.


Syslog Messages in Terminal Monitor and Console

The following examples show how the syslog messages appear in the terminal monitor and the console. The regex expression is matched with the part of the syslog messages after the % sign.

leaf-9516# terminal monitor
leaf-9516# conf t
leaf-9516(config)# int e15/1-32
leaf-9516(config-if-range)# no shut
2019 Aug 2 04:41:27 leaf-9516 %ETHPORT-5-IF_ADMIN_UP: Interface
Ethernet15/1 is admin up .
2019 Aug 2 04:41:27 leaf-9516 %ETHPORT-5-IF_DOWN_NONE: Interface
Ethernet15/1 is down (Transceiver Absent)
2019 Aug 2 04:41:27 leaf-9516 %ETHPORT-5-IF_ADMIN_UP: Interface
Ethernet15/2 is admin up .
2019 Aug 2 04:41:27 leaf-9516 %ETHPORT-5-IF_DOWN_NONE: Interface
Ethernet15/2 is down (Transceiver Absent)
2019 Aug 2 04:41:28 leaf-9516 %ETHPORT-5-IF_ADMIN_UP: Interface
Ethernet15/3 is admin up .

The syslog messages in the console have a similar format as they would appear in the terminal monitor, except for the additional port information enclosed in the %$ signs. However, the regex expression is matched with the part of the syslog messages after the last % sign.

SR-leaf1# 2019 Aug 26 23:55:45 SR-leaf1 %$ VDC-1 %$ %PLATFORM-1-
PFM_ALERT: FAN_BAD: fan6
2019 Aug 26 23:56:15 SR-leaf1 %$ VDC-1 %$ %PLATFORM-1-PFM_ALERT:
FAN_BAD: fan6
2019 Aug 26 23:56:18 SR-leaf1 %$ VDC-1 %$ %ASCII-CFG-2-CONF_CONTROL:
System ready
2019 Aug 26 23:56:25 SR-leaf1 %$ VDC-1 %$ %PLATFORM-1-PFM_ALERT:
FAN_BAD: fan6
2019 Aug 26 23:56:35 SR-leaf1 %$ VDC-1 %$ %PLATFORM-1-PFM_ALERT:
FAN_BAD: fan6
2019 Aug 26 23:56:39 SR-leaf1 %$ VDC-1 %$ %VMAN-2-ACTIVATION_STATE:
Successfully activated virtual service 'guestshell+'
2019 Aug 26 23:56:39 SR-leaf1 %$ VDC-1 %$ %VMAN-2-GUESTSHELL_ENABLED:
The guest shell has been enabled. The command 'guestshell' may be used
to access it, 'guestshell destroy' to remove it.
2019 Aug 26 23:56:45 SR-leaf1 %$ VDC-1 %$ %PLATFORM-2-FAN_REMOVED: Fan
module 5 (Serial number ) Fan5(sys_fan5) removed
2019 Aug 26 23:56:45 SR-leaf1 %$ VDC-1 %$ %PLATFORM-1-PFM_ALERT:
System will shutdown in 2 minutes 0 seconds due to fan policy
__pfm_fanabsent_any_singlefan.
2019 Aug 26 23:56:45 SR-leaf1 %$ VDC-1 %$ %PLATFORM-1-PFM_ALERT:
FAN_BAD: fan6
2019 Aug 26 23:56:54 SR-leaf1 %$ VDC-1 %$ %PLATFORM-1-PFM_ALERT:
System will shutdown in 1 minutes 40 seconds due to fan policy
__pfm_fanabsent_any_singlefan.
2019 Aug 26 23:56:54 SR-leaf1 %$ VDC-1 %$ %PLATFORM-1-PFM_ALERT:
FAN_BAD: fan6
2019 Aug 26 23:57:03 SR-leaf1 %$ VDC-1 %$ %PLATFORM-2-FANMOD_FAN_OK:
Fan module 5 (Fan5(sys_fan5) fan) ok
2019 Aug 26 23:57:03 SR-leaf1 %$ VDC-1 %$ %PLATFORM-1-PFM_ALERT:
FAN_BAD: fan6

Activating Policies

After you create new alarm policies, activate them.
Procedure

Step 1

Choose Monitor > Alarms > Policies.

Step 2

Select the policies that you want to activate and then click the Activate button.


Deactivating Policies

You can deactivate the active alarm policies.
Procedure

Step 1

Choose Monitor > Alarms > Policies.

Step 2

Select the policies that you want to deactivate and then click the Deactivate button.


Importing Policies

You can create alarm policies using the import functionality.
Procedure

Step 1

Choose Monitor > Alarms > Policies and then click the Import button.

Step 2

Browse and select the policy file saved on your computer.

You can only import policies in text format.


Exporting Policies

You can export the alarm policies into a text file.
Procedure

Step 1

From the menu bar, choose Monitor > Alarms > Policies.

Step 2

Click the Export button and then select a location on your computer to store the exported file.


Editing Policies

Procedure

Step 1

From the menu bar, choose Monitor > Alarms > Policies.

Step 2

Select the policy that you want to edit.

Step 3

Click the Edit button and then make necessary changes.

Step 4

Click the OK button.


Deleting Policies

Procedure

Step 1

From the menu bar, choose Monitor > Alarms > Policies.

Step 2

Select the policy that you want to delete.

Step 3

Click the Delete button. The policy is deleted.


Enabling External Alarms

You can enable external alarms using one of the following methods:

  • Using Cisco DCNM Web UI

    1. From Cisco DCNM Web UI, choose Administration > DCNM Server > Server Properties.

    2. Locate the alarm.enable.external property.

    3. Enter the value in the field as true.

  • Using REST APIs

    1. Go the API documentation URL from your DCNM setup: https://<DCNM-ip>/api-docs

    2. Navigate to the Alarms section.

    3. Click POST > rest/alarms/enabledisableextalarm.

    4. Choose the body parameter value as true from the Value drop-down list.

    5. Click Try it out!.

  • Using CLI

    1. Log into the DCNM server using SSH.

    2. Set the alarm.enable.external property to true in the server.properties file.

      The filepath is /usr/local/cisco/dcm/fm/config/server.properties.

Configuration Compliance Alarms

Starting from Cisco DCNM Release 11.3(1), the alarm policies and alarms under the External category are created by the applications running on DCNM. These External alarm policies are created by the applications and cannot be created or added via the GUI.

Config-Compliance(CC) is a core application running on DCNM. CC registers and creates Alarms under the External Alarm category.

Config-Compliance : Alarm Policy

This External alarm category policy is activated on creation of the fabric and is enabled on all the devices in that fabric. The severity level of the policy is CRITICAL. If any device in the fabric moves from In-Sync to Out-of-Sync and the Enable Alarms checkbox is selected, a critical severity alarm is generated.

Choose Monitor>Alarms>Policies to display the default alarm policies. This alarm policy is not editable on the web UI. Click Activate or Deactivate to activate or deactivate the selected policy.

In case an alarm policy is deactivated using the GUI, any alarms created or cleared for that policy will not be displayed in the Monitor>Alarms>View tab. To delete a policy, select the checkbox next to the policy and click Delete. However, we recommend not deleting a policy from the GUI. If a policy is deleted, CC regenerates the policy on the next periodic run or when a Re-sync is triggered at the device level or fabric level under that fabric.

Click the arrow icon next to Critical to display detailed information about the alarm.

An Out-of-Sync status indicates that there is a difference between the intent defined for the device on DCNM and the running configuration on the device. An In-Sync status indicates that the intent defined for the device on DCNM matches the running configuration and CC found no differences between the configurations. For more details on computation of diff, refer Configuration Compliance in DCNM.

When a fabric is deleted, the alarm policy along with all the active alarms for the devices in that fabric are deleted.

Config-Compliance : Active Alarms

Consider a scenario in which CC is running on a fabric and a device in that fabric moves to Out-of-Sync status. This leads to the generation of a Critical severity alarm. Choose Monitor->Alarms->View to display the alarms. These alarms are active until the device moves from Out-of-Sync to In-Sync.

To clear active alarms, select the checkbox next to the alarm, click Change Status and select Clear. In case the same device moves to Out-of-Sync status again, the active alarm is re-created.

To delete active alarms, select the checkbox next to the alarm and click Delete. In case the same device moves to Out-of-Sync status again, a new active alarm is created.

Config-Compliance : Cleared Alarms

When the device that is in Out-of-Sync status moves to In-Sync status, the active alarm is cleared. To view the cleared alarms, select Monitor>Alarms>View>Cleared Alarms. The cleared alarms do not contribute to the overall device health score.

To delete a cleared alarm from the list of cleared alarms, choose Monitor>Alarms>View>Cleared Alarms, select the checkbox next to the alarm, and click Delete. This will delete the selected cleared alarms from the list.

Alarms are cleared when a switch moves from Out-of-Sync to In-Sync. Configuration compliance alarms also contribute to the overall Health score of a device.

For more information on Alarms and Policies, refer Alarms.