Configuring iCAM

This chapter includes the following sections:

Feature History for iCAM

This table lists the release history for this feature.

Table 1. Feature History for iCAM

Feature Name

Releases

Feature Information

Scale Monitoring

8.4(1)

Scale monitoring has been expanded to cover the following technology groups: BFD, FEX, FabricPath, Interfaces, Layer 2 Switching, Multicast Routing, NetFlow, OTV, PTP, PVLAN, QoS, Security, SPAN, System Management, Unicast Routing, VXLAN EVPN.

Remote Integrated Services Engine (RISE)

8.4(1)

Support for the RISE feature has been deprecated.

iCAM Scale Monitoring

8.3(1)

This feature was introduced.

iCAM TCAM Monitoring

8.2(1)

  • Added the functionality to enable iCAM monitoring, viewing the history of traffic analytics, and predicting the traffic analytics.

iCAM

8.0(1)

This feature was introduced. The following commands were introduced:

  • feature icam

  • show icam {entries | resource} module module-number inst instance-number

Information About iCAM

From Cisco NX-OS Release 8.0(1), the Intelligent CAM (iCAM) analytics and machine-learning feature is supported on Cisco Nexus 7000 Series Switches and Cisco Nexus 7700 Switches. The iCAM feature enables you to view the traffic analytics per feature, Ternary Content-Addressable Memory (TCAM) resources and ability to monitor network scale parameters..Before the iCAM feature, it was difficult to get information about the traffic flow through various subnets and applications and an overall view of how many TCAM or Static Random Access Memory (SRAM) resource entries were used or free with various features.

For example, the resource entries utilized in the ACL Classification TCAM per feature, like Router-ACL (RACL), Vlan-ACL (VACL), Port-ACL (PACL), Policy Based Routing (PBR), QoS (Quality of Service), NAT, Intelligent Traffic Director (ITD), Web Cache Communication Protocol (WCCP), or Remote Integrated Services Engine (RISE), could not be determined. Some features might use bulk of the TCAM resources, and some of those TCAM entries might not be in use.

To overcome these limitations, the iCAM feature provides analytics related to network traffic, TCAM usage per feature, detailed analysis per TCAM bank. This helps in effectively utilizing the available TCAM space.

An iCAM process runs on the Supervisor module. It interacts with various components on the line card and collects the hardware resource utilization statistics, performs data processing, and presents a summarized output. It also provides insights about the top hitters and bottom hitters for each feature, like ACL and PBR entries. Using iCAM, you can get packet counts per TCAM entry, sort and search through these entries, and get the top or bottom specified percentage of entries. The traffic analytics helps in better utilization of TCAM space, and better understanding of network traffic.

The iCAM is a VDC global process; it can be enabled only on the default VDC.

The iCAM does not require additional hardware or software. It provides useful traffic telemetry and analytics.

iCAM enables you to perform the following:

  • View traffic and usage analytics per supported function, Ternary Content-Addressable Memory (TCAM) resources, and TCAM entries.

  • Allows you to plan better by understanding the Ternary Content-Addressable Memory (TCAM) usage per feature, enabling you to use TCAM space effectively.

  • Verify, detect, plan, and predict your environment against Cisco-verified scale numbers for the different supported functions (Layer 2 switching, unicast routing, multicast routing, and VXLAN).

  • Maintain historical usage, functional scale analytics of different supported functions, including entries and resource usage of FIB and ACL TCAM.

  • Predict scale (usage level) monitoring for different supported functions in addition to predicted scale for ACL and FIB TCAM entries.

  • View health monitoring data (such as CPU, memory, power supply) and information on Intelligent Traffic Director (ITD) services.

Overview of iCAM Monitoring

From Cisco NX-OS Release 8.2(1), you can use iCAM in an IPv4 network to view the traffic analytics based on the type of TCAM entries and the type of TCAM resources. You can set a global monitoring interval to determine how often iCAM should collect data for statistics. You can also set a global interval history, which determines the number of intervals for which iCAM should store statistics.

Based on a default or user-configured scale level threshold on a per-function basis, iCAM generates alerts through system logging messages generation to notify network administrators.

You can obtain traffic and scale (usage level) monitoring for the following resources and functions:

  • ACL TCAM entries

  • IPv4 multicast TCAM entries

  • ACL TCAM resource utilization

  • Forward information base (FIB) TCAM resource utilization

  • BFD

  • FEX

  • FabricPath

  • Interfaces

  • Layer 2 Switching

  • Multicast Routing

  • NetFlow

  • OTV

  • PTP

  • PVLAN

  • QoS

  • Security

  • SPAN

  • System Management

  • Unicast Routing

  • VXLAN

Overview of Scale Monitoring

iCAM scale monitoring provides you the ability to verify, detect, plan, and predict your environment against Cisco verified scale numbers. You can configure all scale monitoring features with default limits and thresholds or customize the threshold values to your specific needs.

Scale monitoring capabilities include:

  • Track system scale limits in comparison to Cisco verified limits.

  • Two-hour polling interval by default, configurable to one-hour.

  • Track average and peak utilizations, along with timestamps for peak utilizations.

  • User-configurable scale limits and alert thresholds.

  • JSON/XML compatible for off box Orchestrator interaction.

  • Per-ASIC instance and Per-VDC Awareness.

  • Event-history support.

  • Scale predictability - Planning via a centralized data base for historical data.

From Cisco NX-OS Release 8.4(1), Scale Monitoring supports the following features:

  • BFD

  • FEX

  • FabricPath

  • vPC FEX

  • Interfaces—BFD, Port-channel, vPC, GRE, Sub-interfaces

  • Layer 2 Switching—Layer 2 infrastructure, Spanning Tree Protocol

  • Multicast Routing

  • OTV

  • PVLAN

  • QoS

  • Security—ACLs, DHCP, UDP Relay

  • System Management—SPAN, ERSPAN, PTP, NetFlow

  • Unicast Routing—OSPF

  • VXLAN

Historical Analytics Using iCAM

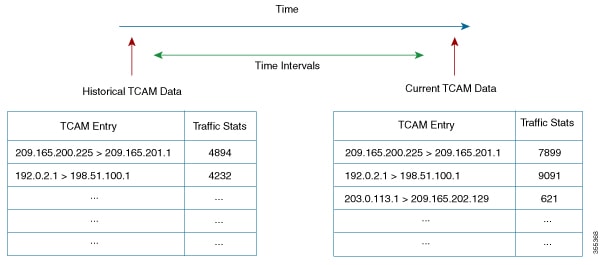
From Cisco NX-OS Release 8.2(1), you can use iCAM to obtain the historical traffic analytics of entries and resources. When iCAM monitoring is enabled for resources and entries, the traffic data is periodically polled and stored in the iCAM database. The history option for iCAM entries displays the cumulative traffic stats and average packets per second. The history option for TCAM resources displays the snapshots of TCAM statistics of the past.

The following figure shows the historical traffic data:

Figure 1. Historical Traffic Data

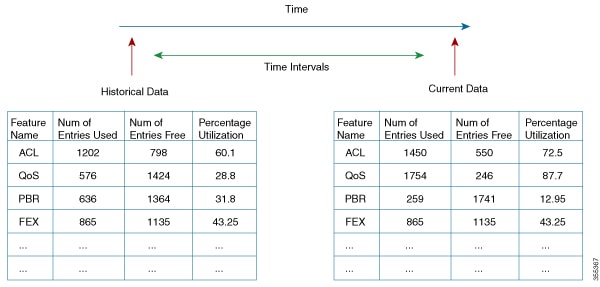
The following figure shows the historical resource utilization:

Figure 2. Historical Resource Utilization

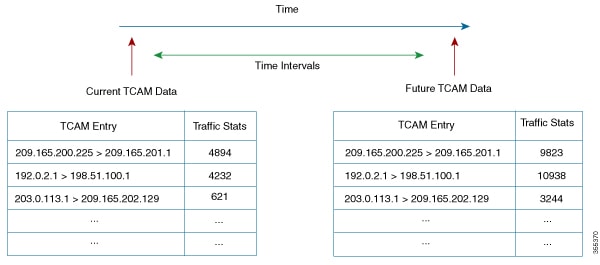
Predicting Traffic Analytics Using iCAM

From Cisco NX-OS Release 8.2(1), you can use iCAM to predict the traffic on entries and resources for a future date. The predictions are based on the data history collected by iCAM. When iCAM monitoring is enabled for resources and entries, the traffic data is periodically polled and stored in the iCAM database. The iCAM feature uses machine-learning algorithms to analyze the historical data and predicts the TCAM usage for a future date and time.

The following figure shows the predicted traffic data:

Figure 3. Predicted Traffic Data

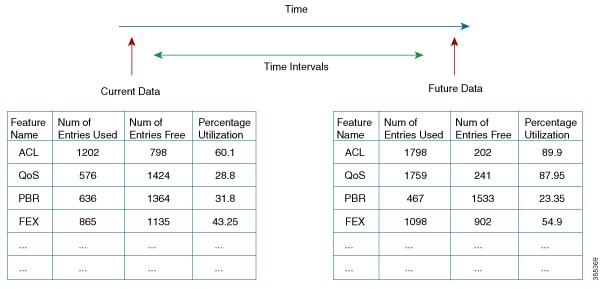
The following figure shows the predicted resource utilization:

Figure 4. Predicted Resource Utilization

Benefits of iCAM

  • Allows users to obtain application traffic analytics, like the HTTP traffic and the traffic consumed by an IP or subnet.

  • Does not require additional hardware or software.

  • Users can get the iCAM analytics and machine-learning feature by upgrading the Cisco NX-OS software.

  • Allows users to plan better by understanding the Ternary Content-Addressable Memory (TCAM) usage per feature.

Default Settings for iCAM

This table lists the default settings for iCAM.

Table 2. Default iCAM Settings

Parameter

Default

iCAM

Disabled

iCAM monitor interval

1

iCAM interval duration

7200 sec

Number of intervals in iCAM monitor history

168 (2 weeks)

Filter

All the features are displayed

Sort order

Descending

Percentage of entries displayed

1

Enabling iCAM

Procedure


Step 1

Enter global configuration mode:

switch# configure terminal

Step 2

Enable the iCAM feature on the device:

switch(config)# feature icam

The no form of this command disables the iCAM feature.

Step 3

Exit the global configuration mode:

switch(config)# exit


Example: Configuring iCAM

This running configuration example shows how to configure the iCAM feature.

configure terminal
 feature icam
 exit

Enabling iCAM Monitoring on Resources and Traffic

Before you begin

Ensure that you have enabled the iCAM feature on the device.

Procedure


Step 1

Enter global configuration mode:

switch# configure terminal

Step 2

Enable monitoring on the required entries and resources:

  • Enable monitoring on the TCAM entries:

    switch(config)# icam monitor entries acl module module inst instance

  • Enable monitoring on the multicast entries:

    switch(config)# icam monitor entries multicast module module

  • Enable monitoring on the ACL TCAM resources:

    switch(config)# icam monitor resource acl-tcam module module inst instance

  • Enable monitoring on the FIB TCAM resources:

    switch(config)# icam monitor resource fib-tcam module module inst instance

Use the no form of these commands to disable monitoring on the corresponding resources or entries.

Step 3

Exit the global configuration mode:

switch(config)# exit


Example: Enabling iCAM Monitoring on Resources and Entries

This running configuration example shows how to enable iCAM monitoring on the TCAM entries. Replace the <placeholders> with relevant values for your setup.

configure terminal
 icam monitor entries acl module <3> inst <4>
 exit

This running configuration example shows how to enable iCAM monitoring for the multicast entries. Replace the <placeholders> with relevant values for your setup.

configure terminal
 icam monitor entries multicast module <3>
 exit

This running configuration example shows how to enable iCAM monitoring on the ACL TCAM resources. Replace the <placeholders> with relevant values for your setup.

configure terminal
 icam monitor resource acl-tcam module <3> inst <5>
 exit

This running configuration example shows how to enable iCAM monitoring on the FIB TCAM resources. Replace the <placeholders> with relevant values for your setup.

configure terminal
 icam monitor resource fib-tcam module <3> inst <5>
 exit

Configuring iCAM Monitoring

Before you begin

Ensure that you have enabled the iCAM feature on a device.

Procedure


Step 1

Enter global configuration mode:

switch# configure terminal

Step 2

Set the iCAM monitor interval and the global interval history:

switch(config)# icam monitor interval interval-hours num_intervals num-intervals

Use the no form of this command to reset to the default values. The default value of the global monitoring interval is 2 hours and the default value of the interval history is 168. The default values might change when more data is collected on the accuracy of machine-learning.

Step 3

Exit the global configuration mode:

switch(config)# exit


Example: Configuring iCAM Monitor Interval

This running configuration example shows how to set the iCAM monitor interval and the global interval history. Replace the <placeholders> with relevant values for your setup.

configure terminal
 icam monitor interval <2> num_intervals <90>
 exit

Configuring Scale Monitoring

Procedure


Step 1

Enter global configuration mode:

switch# configure terminal

Step 2

Enable the iCAM feature. The no form of this command disables the iCAM feature.

switch(config)# feature icam

You must enable iCAM monitoring if you want to configure and record history and predict TCAM entries or resources.

Step 3

Enable all features with default limits and thresholds.

switch(config)# [no]icam monitor scale

Step 4

Enables you to customize the limit for a specific BFD feature to override its default limit. Feature limit range is 1 to 4294967295 for this step and for the following 4-18 steps with icam monitor scale feature form.

Note: The icam monitor scale <technology> <feature>limit val command does not enable scale monitoring for this feature but only configures scale limit for the feature.

switch(config)# [no]icam monitor scale bfd {mh-sess | sess | sess-15x3 | sess-300x3 | sess-50x3 | sess-subintf }limit new feature limit

Step 5

Enables you to customize the limit for a specific fabricpath feature to override its default limit. Feature limit range is 1 to 4294967295.

switch(config)# [no]icam monitor scale fabricpath {mcast-group | switch-id | vlan }limit new feature limit

Step 6

Enables you to customize the limit for a specific FEX feature to override its default limit. Feature limit range is 1 to 4294967295.

switch(config)# [no]icam monitor scale fex { actv-actv | fex-count | interfaces }limit new feature limit

Step 7

Enables you to customize the limit for a specific interface feature to override its default limit. Feature limit range is 1 to 4294967295.

switch(config)# [no]icam monitor scale interface {gre tunnel | port-channel port-channel-count | subinterf subinterf-count | vpc { fcoe | fex | vpc-count | vpcplus} }limit new feature limit

Step 8

Enables you to customize the limit for a specific Layer 2 switching feature to override its default limit. Feature limit range is 1 to 4294967295..

switch(config)# [no]icam monitor scale 12-switching {infra | stp {mst-instance | mst-vport | rpvst-lport | rpvst-vport} | vlan vlan-count }limit new feature limit

Step 9

Enables you to customize the limit for a specific multicast routing feature to override its default limit. Feature limit range is 1 to 4294967295.

switch(config)# [no]icam monitor scale multicast-routing {igmp group | pim neighbor | routing-forwarding route-v4 }limit new feature limit

Step 10

Enables you to customize the limit for a specific netflow feature to override its default limit. Feature limit range is 1 to 4294967295.

switch(config)# [no]icam monitor scale netflow ppslimit new feature limit

Step 11

Enables you to customize the limit for a specific OTV feature to override its default limit. Feature limit range is 1 to 4294967295.

switch(config)# [no]icam monitor scale otv {datagroup | localmroute | overlay | vlan }limit new feature limit

Step 12

Enables you to customize the limit for a specific PTP feature to override its default limit. Feature limit range is 1 to 4294967295.

switch(config)# [no]icam monitor scale ptp num-clients limit new feature limit

Step 13

Enables you to customize the limit for a specific PVLAN feature to override its default limit. Feature limit range is 1 to 4294967295.

switch(config)# [no]icam monitor scale pvlan {host-ports | isol-trunk-ports | primary-vlans | prom-ports | prom-trunk-ports | secondary-vlans }limit new feature limit

Step 14

Enables you to customize the limit for a specific QoS feature to override its default limit. Feature limit range is 1 to 4294967295.

switch(config)# [no]icam monitor scale qos {classmaps | policers }limit new feature limit

Step 15

Enables you to customize the limit for a specific security feature to override its default limit. Feature limit range is 1 to 4294967295.

switch(config)# [no]icam monitor scale security {acl {ace | acl-count | infs-applied | l4op-label | non-l4op-label } | cts {ip-sgt-mappings-using-sxp | sxp-connection} | dhcp {relay-agent | snoop-binding | snoop-vlan} | udp-relay {obj | port} }limit new feature limit

Step 16

Enables you to customize the limit for a specific SPAN feature to override its default limit. Feature limit range is 1 to 4294967295.

switch(config)# [no]icam monitor scale span {erspan-dst-sess | extended-sess }limit new feature limit

Step 17

Enables you to customize the limit for a specific unicast routing feature to override its default limit. Feature limit range is 1 to 4294967295.

switch(config)# [no]icam monitor scale unicast-routing ospf {area | lsa | nbr | passive-intf | vrf }limit new feature limit

Step 18

Enables you to customize the limit for a specific VXLAN feature to override its default limit. Feature limit range is 1 to 4294967295..

switch(config)# [no]icam monitor scale vxlan {bd | encap-prof | mac | vni | vsi-intf }limit new feature limit

Step 19

(Optional) Specify the iCAM monitor interval limits.

switch(config)# [no]icammonitorintervalinterval-hours num_intervals number-of-intervals

  • interval-hours— iCAM monitor interval in hours. The range is 1 to 24 hours.

  • number-of-intervals— iCAM monitor history. The range is 168 to 1344.

Step 20

(Optional) Specify the iCAM change percent threshold limits.

switch(config)# [no]icammonitorscalethreshold infoinfo-threshold-percent warningwarning-threshold-percent criticalcritical-threshold-percent

  • info—Configures the info threshold. The range is 1 to 100 percent, default value is 80 percent.

  • warning—Configures the warning threshold. The range is 1 to 100 percent, default value is 90 percent.

  • critical—Configures the critical threshold. The range is 1 to 100 percent, default value is 100 percent.

Step 21

(Optional) Exits the global configuration mode.

switch(config)# exit

Step 22

(Optional) Display data from the default scale monitoring thresholds.

switch# show icam scale

  • Verified Scale—CCO QA verified scale numbers that are based on software version and hardware.

  • Customer Configured Scale—Displays the difference between configured and verified.

  • Threshold Exceeded —Displays the highest threshold level exceeded.

Step 23

(Optional) Display the utilization data including average and peak utilization data, peak timestamp, 7-day totals, and total counts.

switch# show icam scale utilization

Step 24

(Optional) Display the hit count and the last timestamp of the exceeding configured scale for each configured threshold. Use the hit count for each threshold to determine if the event is an anomaly or frequently occuring. The Last Info Exceeded Timestamp displays the last timestamp of the exceeding configured scale.

switch# show icam scale thresholds

Step 25

(Optional) Display the scale history and sort the history records by the current scale value or by the polled time stamp.

switch# show icam scale history number of intervals sort {current-scale {ascending | descending} | polled-timestamp {newest | oldest}}

Step 26

Display the BFD data. You can customize the display of BFD data. Use ? to display a list of supported BFD keywords.

switch# show icam scale bfd

Step 27

Display the fabricpath data. You can customize the display of fabricpath data. Use ? to display a list of supported fabricpath keywords.

switch# show icam scale fabricpath

Step 28

Display the fabric extender data. You can customize the display of FEX data. Use ? to display a list of supported FEX keywords.

switch# show icam scale fex

Step 29

Display the interface data. You can customize the display of interface data. Use ? to display a list of supported interface keywords.

switch# show icam scale interface

Step 30

Display the Layer 2 switching data. You can customize the display of Layer 2 switching data. Use ? to display a list of supported Layer 2 switching keywords.

switch# show icam scale l2-switching

Step 31

Display the multicast routing data. You can customize the display of multicast routing data. Use ? to display a list of supported multicast routing keywords.

switch# show icam scale multicast-routing

Step 32

Display the netflow data. You can customize the display of netflow data. Use ? to display a list of supported netflow keywords.

switch# show icam scale netflow

Step 33

Display the OTV data. You can customize the display of OTV data. Use ? to display a list of supported OTV keywords.

switch# show icam scale otv

Step 34

Display the PTP data. You can customize the display of PTP data. Use ? to display a list of supported PTP keywords.

switch# show icam scale ptp

Step 35

Display the PVLAN data. Use ? to display a list of supported PVLAN keywords.

switch# show icam scale pvlan

Step 36

Display the QoS data. Use ? to display a list of supported QoS keywords.

switch# show icam scale qos

Step 37

Display the security data. Use ? to display a list of supported security keywords.

switch# show icam scale security

Step 38

Display the SPAN data. Use ? to display a list of supported SPAN keywords.

switch# show icam scale span

Step 39

Display the unicast routing data. Use ? to display a list of supported unicast routing keywords.

switch# show icam scale unicast-routing

Step 40

Display the VXLAN data. Use ? to display a list of supported VXLAN keywords.

switch# show icam scale vxlan

Step 41

Displays the traffic prediction of scale monitoring.

switch# show icam prediction scale year month day time

  • year—Specifies the year in the YYYY format. The values range from 1970 to 2030.

  • month—Specifies the month as Jan, Feb, or so on. The values are case sensitive.

  • day—Specifies the day of the month in the DD format. The values range from 1 to 31.

  • time—Specifies the time in the HH:MM:SS format.


Example: Verifying Scale Monitoring

The following examples display sample data from PVLAN scale monitoring with the associated keywords.

switch# show icam scale pvlan 
Retrieving data.  This may take some time ... 
==================================================
Info Threshold =  80 percent (default)           |
Warning Threshold =  90 percent (default)        |
Critical Threshold = 100 percent (default)       |
All timestamps are in UTC                        |
==================================================

-------------------------------------------------------------------------------------------------
Scale Limits for PVLAN
-------------------------------------------------------------------------------------------------
                  Feature  Verified     Config       Cur     Cur   Threshold               Polled
                              Scale      Scale     Scale    Util    Exceeded            Timestamp
-------------------------------------------------------------------------------------------------
      PVLAN Primary VLANs         -          -         -      -           -                     -
                  (VDC:1)        25          1        151500.00    Critical   2019-06-05 21:33:43
                  (VDC:2)        25          1         1 100.00    Critical   2019-06-05 21:33:43
    PVLAN Secondary VLANs         -          -         -      -           -                     -
                  (VDC:1)        75         75         2   2.66        None   2019-06-05 21:33:43
                  (VDC:2)        75         75         0   0.00        None   2019-06-05 21:33:43
         PVLAN Host Ports         -          -         -      -           -                     -
                  (VDC:1)        20         20         0   0.00        None   2019-06-05 21:33:43
                  (VDC:2)        20         20         0   0.00        None   2019-06-05 21:33:43
   PVLAN Promiscous Ports         -          -         -      -           -                     -
                  (VDC:1)        16         16         0   0.00        None   2019-06-05 21:33:43
                  (VDC:2)        16         16         0   0.00        None   2019-06-05 21:33:43
  PVLAN Promisc Trk Ports         -          -         -      -           -                     -
                  (VDC:1)       150        150         0   0.00        None   2019-06-05 21:33:43
                  (VDC:2)       150        150         0   0.00        None   2019-06-05 21:33:43
 PVLAN Isolated Trk Ports         -          -         -      -           -                     -
                  (VDC:1)        30         30         0   0.00        None   2019-06-05 21:33:43
                  (VDC:2)        30         30         0   0.00        None   2019-06-05 21:33:43
switch# show icam scale pvlan thresholds 
==================================================
Info Threshold =  80 percent (default)           |
Warning Threshold =  90 percent (default)        |
Critical Threshold = 100 percent (default)       |
All timestamps are in UTC                        |
==================================================

--------------------------------------------------------------------------------------------------------------------------------------------------------
Scale Limits for PVLAN
--------------------------------------------------------------------------------------------------------------------------------------------------------
                  Feature  Verified     Config    Current     Info             Last Info   Warning          Last Warning  Critical         Last Critical
                              Scale      Scale      Scale     Exceeded    Exceeded Timestamp  Exceeded    Exceeded Timestamp  Exceeded    Exceeded Timestamp
--------------------------------------------------------------------------------------------------------------------------------------------------------
      PVLAN Primary VLANs         -          -         -         -                     -         -                     -         -                     -
                  (VDC:1)        25          1        15         3   2019-06-05 20:48:19         3   2019-06-05 20:48:19         3   2019-06-05 20:48:19
                  (VDC:2)        25          1         1         3   2019-06-05 20:48:19         3   2019-06-05 20:48:19         3   2019-06-05 20:48:19
    PVLAN Secondary VLANs         -          -         -         -                     -         -                     -         -                     -
                  (VDC:1)        75         75         2         0                     -         0                     -         0                     -
                  (VDC:2)        75         75         0         0                     -         0                     -         0                     -
         PVLAN Host Ports         -          -         -         -                     -         -                     -         -                     -
                  (VDC:1)        20         20         0         0                     -         0                     -         0                     -
                  (VDC:2)        20         20         0         0                     -         0                     -         0                     -
   PVLAN Promiscous Ports         -          -         -         -                     -         -                     -         -                     -
                  (VDC:1)        16         16         0         0                     -         0                     -         0                     -
                  (VDC:2)        16         16         0         0                     -         0                     -         0                     -
  PVLAN Promisc Trk Ports         -          -         -         -                     -         -                     -         -                     -
                  (VDC:1)       150        150         0         0                     -         0                     -         0                     -
                  (VDC:2)       150        150         0         0                     -         0                     -         0                     -
 PVLAN Isolated Trk Ports         -          -         -         -                     -         -                     -         -                     -
                  (VDC:1)        30         30         0         0                     -         0                     -         0                     -
                  (VDC:2)        30         30         0         0                     -         0                     -         0                     -
switch# show icam scale pvlan history 3 sort current-scale ascending 
==================================================
Info Threshold =  80 percent (default)           |
Warning Threshold =  90 percent (default)        |
Critical Threshold = 100 percent (default)       |
All timestamps are in UTC                        |
==================================================

-------------------------------------------------------------------------------------------------
Scale Limits for PVLAN
-------------------------------------------------------------------------------------------------
                  Feature  Verified     Config       Cur     Cur   Threshold               Polled
                              Scale      Scale     Scale    Util    Exceeded            Timestamp
-------------------------------------------------------------------------------------------------
      PVLAN Primary VLANs         -          -         -      -           -                     -
                  (VDC:1)        25          1        151500.00    Critical   2019-06-05 18:48:17
                                                      151500.00    Critical   2019-06-05 19:48:18
                                                      151500.00    Critical   2019-06-05 20:48:19
                  (VDC:2)        25          1         1 100.00    Critical   2019-06-05 18:48:17
                                                       1 100.00    Critical   2019-06-05 19:48:18
                                                       1 100.00    Critical   2019-06-05 20:48:19
    PVLAN Secondary VLANs         -          -         -      -           -                     -
                  (VDC:1)        75         75         2   2.66        None   2019-06-05 18:48:17
                                                       2   2.66        None   2019-06-05 19:48:18
                                                       2   2.66        None   2019-06-05 20:48:19
                  (VDC:2)        75         75         0   0.00        None   2019-06-05 18:48:17
                                                       0   0.00        None   2019-06-05 19:48:18
                                                       0   0.00        None   2019-06-05 20:48:19
         PVLAN Host Ports         -          -         -      -           -                     -
                  (VDC:1)        20         20         0   0.00        None   2019-06-05 18:48:17
                                                       0   0.00        None   2019-06-05 19:48:18
                                                       0   0.00        None   2019-06-05 20:48:19
                  (VDC:2)        20         20         0   0.00        None   2019-06-05 18:48:17
                                                       0   0.00        None   2019-06-05 19:48:18
                                                       0   0.00        None   2019-06-05 20:48:19
   PVLAN Promiscous Ports         -          -         -      -           -                     -
                  (VDC:1)        16         16         0   0.00        None   2019-06-05 18:48:17
                                                       0   0.00        None   2019-06-05 19:48:18
                                                       0   0.00        None   2019-06-05 20:48:19
                  (VDC:2)        16         16         0   0.00        None   2019-06-05 18:48:17
                                                       0   0.00        None   2019-06-05 19:48:18
                                                       0   0.00        None   2019-06-05 20:48:19
  PVLAN Promisc Trk Ports         -          -         -      -           -                     -
                  (VDC:1)       150        150         0   0.00        None   2019-06-05 18:48:17
                                                       0   0.00        None   2019-06-05 19:48:18
                                                       0   0.00        None   2019-06-05 20:48:19
                  (VDC:2)       150        150         0   0.00        None   2019-06-05 18:48:17
                                                       0   0.00        None   2019-06-05 19:48:18
                                                       0   0.00        None   2019-06-05 20:48:19
 PVLAN Isolated Trk Ports         -          -         -      -           -                     -
                  (VDC:1)        30         30         0   0.00        None   2019-06-05 18:48:17
                                                       0   0.00        None   2019-06-05 19:48:18
                                                       0   0.00        None   2019-06-05 20:48:19
                  (VDC:2)        30         30         0   0.00        None   2019-06-05 18:48:17
                                                       0   0.00        None   2019-06-05 19:48:18
                                                       0   0.00        None   2019-06-05 20:48:19
switch# show icam scale pvlan utilization 
==================================================
Info Threshold =  80 percent (default)           |
Warning Threshold =  90 percent (default)        |
Critical Threshold = 100 percent (default)       |
All timestamps are in UTC                        |
==================================================

--------------------------------------------------------------------------------------------------------------------------------
Scale Limits for PVLAN
--------------------------------------------------------------------------------------------------------------------------------
                  Feature  Verified     Config       Cur    Cur    Avg  7-Day            7-Day Peak   Peak                  Peak
                              Scale      Scale     Scale   Util   Util   Util             Timestamp   Util             Timestamp
--------------------------------------------------------------------------------------------------------------------------------
      PVLAN Primary VLANs         -          -         -      -      -      -                     -      -                     -
                  (VDC:1)        25          1        151500.001500.001500.00   2019-06-05 07:25:461500.00   2019-06-05 07:25:46
                  (VDC:2)        25          1         1 100.00 100.00 100.00   2019-06-05 07:25:46 100.00   2019-06-05 07:25:46
    PVLAN Secondary VLANs         -          -         -      -      -      -                     -      -                     -
                  (VDC:1)        75         75         2   2.66   2.66   2.66   2019-06-05 07:25:46   2.66   2019-06-05 07:25:46
                  (VDC:2)        75         75         0   0.00   0.00   0.00   2019-06-05 07:25:46   0.00   2019-06-05 07:25:46
         PVLAN Host Ports         -          -         -      -      -      -                     -      -                     -
                  (VDC:1)        20         20         0   0.00   0.00   0.00   2019-06-05 07:25:46   0.00   2019-06-05 07:25:46
                  (VDC:2)        20         20         0   0.00   0.00   0.00   2019-06-05 07:25:46   0.00   2019-06-05 07:25:46
   PVLAN Promiscous Ports         -          -         -      -      -      -                     -      -                     -
                  (VDC:1)        16         16         0   0.00   0.00   0.00   2019-06-05 07:25:46   0.00   2019-06-05 07:25:46
                  (VDC:2)        16         16         0   0.00   0.00   0.00   2019-06-05 07:25:46   0.00   2019-06-05 07:25:46
  PVLAN Promisc Trk Ports         -          -         -      -      -      -                     -      -                     -
                  (VDC:1)       150        150         0   0.00   0.00   0.00   2019-06-05 07:25:46   0.00   2019-06-05 07:25:46
                  (VDC:2)       150        150         0   0.00   0.00   0.00   2019-06-05 07:25:46   0.00   2019-06-05 07:25:46
 PVLAN Isolated Trk Ports         -          -         -      -      -      -                     -      -                     -
                  (VDC:1)        30         30         0   0.00   0.00   0.00   2019-06-05 07:25:46   0.00   2019-06-05 07:25:46
                  (VDC:2)        30         30         0   0.00   0.00   0.00   2019-06-05 07:25:46   0.00   2019-06-05 07:25:46

Displaying Current, Historical, and Predictive Traffic Analytics of TCAM Entries

The TCAM entries and traffic analytics are listed per module and per TCAM instance. To display the current, historical, or predictive traffic analytics of TCAM entries, use the following commands:

Command

Description

show icam entries acl module module inst instance [history num-intervals] [sort {[filter feature-name [exact]] [sort-order sort-order-list] [top top-percentage]}]

Lists TCAM entries based on the options selected.

  • history —Displays the traffic history of entries for the specified number of intervals.

  • sort —Specifies how to filter or sort the list of TCAM entries. You must use at least one option if you filter TCAM entries using the sort keyword.

  • filter feature-name —Filters the TCAM entries based on the feature name.

    Note


    By default, all the features are displayed. Enclose the feature name in quotation marks if it contains more than one word, like QoS COPP.

  • exact —Filters the TCAM entries based on the exact feature name.

    Note


    This keyword can be used only when filtering the TCAM entries by feature names.

  • sort-order —Sorts the entries in either ascending or descending order.

    Note


    The valid values are 1 and 2. 1 displays the list in ascending order and 2 displays the list in descending order. The entries are sorted in descending order by default.

  • top top-percentage —Displays the top TCAM entries, sorted by packet count, based on the specified percentage.

    Note


    The valid values are from 1 to 100. The default value is 1%.

show icam entries multicast module module [history num-intervals] [sort {[sort-order sort-order-list] [top top-percentage]}]

Lists the multicast entries per module.

show icam prediction entries acl module module inst inst year month day time [top top-percentage]

Displays the traffic prediction of the TCAM entries.

  • year —Specifies the year in the YYYY format. The values range from 1970 to 2030.

  • month —Specifies the month as Jan, Feb, or so on.

    Note


    The values are case sensitive.

  • day —Specifies the day of the month in the DD format. The values range from 1 to 31.

  • time —Specifies the time in the HH:MM:SS format.

  • top top-percentage —Displays the top TCAM entries, sorted by packet count, based on the specified percentage.

    Note


    Valid values are from 1 to 10. The default value is 1%.

show icam prediction entries multicast module module year month day time [top top-percentage]

Displays the traffic prediction of the multicast entries.


Note


  • The history and prediction can be displayed only for resources and entries that have monitoring enabled.

  • The entries and resources are sorted based on the packet count.


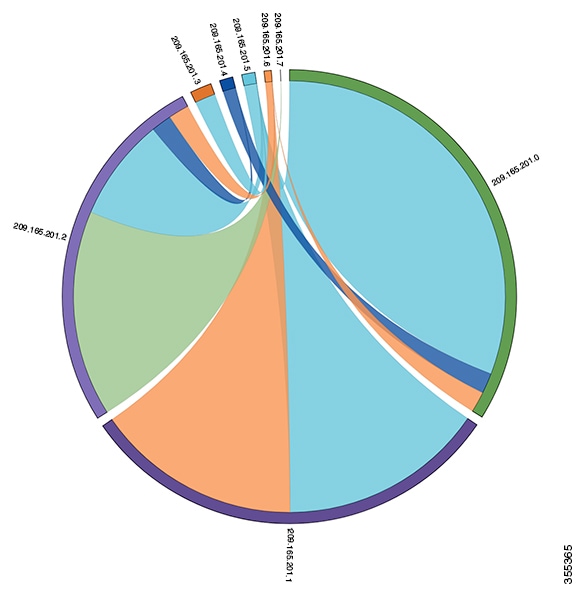
You can use the output of the above commands to generate a chord diagram. A chord diagram provides a simple view of complex traffic flows. You can identify an anomalous traffic flow using a chord diagram.

This example shows how to view the top 2% traffic flow of the TCAM entries for a current date.

switch# show icam entries acl module 5 inst 0 sort top 2
Retrieving data from linecard.  This may take some time ...

======================================================================================================================
TCAM Entries (Mod 5,Inst 0)
----------------------------------------------------------------------------------------------------------------------
 Feature  Pkt_Type                                   Source IP/Mask Dest IP/Mask     Action      ifindex         Stats
----------------------------------------------------------------------------------------------------------------------
    RACL    IPv4                          ip 209.165.201.3/27 209.165.202.131/27     Permit   0x1a200000    1531248034
    RACL    IPv4                          ip 209.165.201.2/27 209.165.202.132/27     Permit   0x1a200000     765624017
    RACL    IPv4                          ip 209.165.201.1/27 209.165.202.134/27     Permit   0x1a200000     765624017
    RACL    IPv4                          ip 209.165.201.2/27 209.165.202.131/27     Permit   0x1a200000     765624017
    RACL    IPv4                          ip 209.165.201.1/27 209.165.202.131/27     Permit   0x1a200000     382812009
    RACL    IPv4                                          ip 0.0.0.0/0 0.0.0.0/0       Deny   0x1a201000     241001297
    RACL    IPv4                          ip 209.165.201.3/27 209.165.202.133/27     Permit   0x1a200000      76562402
    RACL    IPv4                          ip 209.165.201.1/27 209.165.202.132/27     Permit   0x1a200000      76562402
    RACL    IPv4                          ip 209.165.201.1/27 209.165.202.133/27     Permit   0x1a200000      76562402
    RACL    IPv4                          ip 209.165.201.3/27 209.165.202.132/27     Permit   0x1a200000      76562402
    RACL    IPv4                          ip 209.165.201.8/27 209.165.202.131/27     Permit   0x1a200000      76562402
    RACL    IPv4                          ip 209.165.202.132/27 209.165.201.2/27     Permit   0x1a201000      48731168
    RACL    IPv4                          ip 209.165.202.133/27 209.165.201.3/27     Permit   0x1a201000      48186974
    RACL    IPv4                          ip 209.165.202.131/27 209.165.201.2/27     Permit   0x1a201000      47334529
QoS COPP    IPv4                                pim 0.0.0.0/0 209.165.202.135/27        QoS          0x0         17973
QoS COPP    IPv4                               igmp 0.0.0.0/0 209.165.202.136/27        QoS          0x0          4319
QoS COPP     ARP  arp-rarp/all ip 0.0.0.0/0 0.0.0.0/0 0000.0000.0000 0000.0000.00       QoS          0x0            15
QoS COPP    IPv4                                         udp 0.0.0.0/0 0.0.0.0/0        QoS          0x0             4
    VACL    IPv4                                        icmp 0.0.0.0/0 0.0.0.0/0     Permit          0x0             0
    VACL    IPv4                                         udp 0.0.0.0/0 0.0.0.0/0     Permit          0x0             0
    VACL    IPv4                                         tcp 0.0.0.0/0 0.0.0.0/0     Permit          0x0             0
    VACL    IPv4                                         tcp 0.0.0.0/0 0.0.0.0/0     Permit          0x0             0
    VACL    IPv4                                         udp 0.0.0.0/0 0.0.0.0/0     Permit          0x0             0
    VACL    IPv4                                tcp 209.165.202.137/27 0.0.0.0/0     Permit          0x0             0
    VACL    IPv4                                tcp 209.165.202.137/27 0.0.0.0/0     Permit          0x0             0
    VACL    IPv4                                tcp 209.165.202.137/27 0.0.0.0/0     Permit          0x0             0
    VACL    IPv4                                tcp 209.165.202.137/27 0.0.0.0/0     Permit          0x0             0
    VACL    IPv4                                tcp 209.165.202.138/27 0.0.0.0/0     Permit          0x0             0
    VACL    IPv4                                udp 209.165.202.139/27 0.0.0.0/0     Permit          0x0             0


You can use the output in this example to generate a chord diagram. The following figure shows the traffic flow, which is generated using the output in this example:

Figure 5. Chord Diagram

Every arc in the chord diagram represents the traffic flow from a source address to a destination address. The thick end of the chord represents the source address and the thin end represents the destination address. The thickness of the arc represents the percentage of the traffic. The Stats column in the output of the show icam entries command gives the information about the number of packets or traffic hitting a TCAM entry. The traffic from a single source to multiple destinations and from multiple sources to single destination can be visualized using the chord diagram.

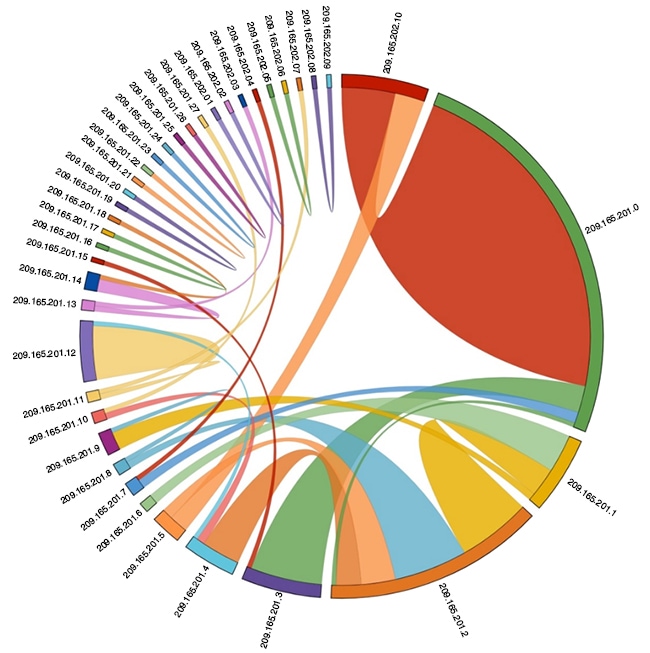
The following figure shows the anomaly visualization of the traffic flow:

Figure 6. Anomaly Visualization

In the figure, the arcs with traffic from 209.165.201.0 to 209.165.202.10 can be easily identified as an anomalous traffic pattern.

Displaying Current, Historical, and Predictive TCAM Resource Usage per Feature

To display the current, historical, or predictive TCAM usage, use the following commands:

Command

Description

show icam resource {acl-tcam | fib-tcam} module module inst instance [history num-intervals]

Displays analytics per module and per instance for resources.

  • history —Displays the traffic history of resources for the specified number of intervals.

  • num-intervals—Number of intervals in the history.

show icam prediction resource acl-tcam module module inst inst year month day time

Displays the traffic prediction of the ACL-TCAM features such as ACL, QoS, PBR, WCCP, and so on.

  • year —Specifies the year in the YYYY format. The values range from 1970 to 2030.

  • month —Specifies the month as Jan, Feb, or so on.

    Note


    The values are case sensitive.

  • day —Specifies the day of the month in the DD format. The values range from 1 to 31.

  • time —Specifies the time in the HH:MM:SS format.

show icam prediction resource fib-tcam module module inst inst year month day time

Displays the traffic prediction of the FIB TCAM resources.

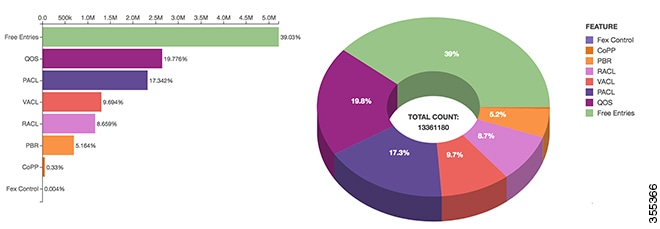
You can generate a donut chart or a bar graph using the output of the above commands. The following figure shows the TCAM resource usage per feature:

Figure 7. Donut Chart Representing TCAM Resource Usage per Feature

Explanation of the Display Outputs

When you enable iCAM monitoring for an entry or a resource, the corresponding traffic statistics or resources usage snapshot is stored in the database once in every interval.

This example shows the historical view of the TCAM entries monitored by iCAM. The Stats column shows the total amount of packets hitting the entry in the last five intervals. The Rate column shows the average traffic rate in packets per second in the last five intervals.

switch# show icam entries acl module 5 inst 0 history 5
============================================================================================================================
TCAM Entries (Mod 5,Inst 0): Cumulative stats for last 5 intervals
----------------------------------------------------------------------------------------------------------------------------
Feature  Pkt_Type                                    Source IP/Mask Dest IP/Mask    Action      ifindex     Stats  Rate(pps)
----------------------------------------------------------------------------------------------------------------------------
    FEX    IPv4                                          ip 0.0.0.0/0 0.0.0.0/0   Redirect   0x15090000         0          0
    FEX    IPv6  ip 0x00000000000000000000000000000000/0 0x000000000000000000000  Redirect   0x15090000         0          0
    FEX     MAC     0000.0000.0000 0000.0000.0000 0000.0000.0000 0000.0000.0000   Redirect   0x15090000         0          0
    FEX     ARP  arp-rarp/all ip 0.0.0.0/0 0.0.0.0/0 0000.0000.0000 0000.0000.00  Redirect   0x15090000         0          0
   RACL    IPv4                                   ip 209.165.201.1/27 0.0.0.0/0     Permit   0x1a200000     23423        945
   RACL    IPv4                                   ip 209.165.201.2/27 0.0.0.0/0     Permit   0x1a200000  23946237     718353
   RACL    IPv4                                   ip 209.165.201.3/27 0.0.0.0/0     Permit   0x1a200000     83675        585
   RACL    IPv4                                   ip 209.165.201.4/27 0.0.0.0/0     Permit   0x1a200000         0          0
   RACL    IPv4                                   ip 209.165.201.5/27 0.0.0.0/0     Permit   0x1a200000   9693487      45986
   RACL    IPv4                                   ip 209.165.201.6/27 0.0.0.0/0     Permit   0x1a200000   9693487      45986
   RACL    IPv4                                          ip 0.0.0.0/0 0.0.0.0/0       Deny   0x1a200000   9693487      45986
QoS COPP   IPv4                                         tcp 0.0.0.0/0 0.0.0.0/0        QoS          0x0         0          0
QoS COPP   IPv4                     udp 0.0.0.0/0 ip 209.165.201.7/27 0.0.0.0/0        QoS          0x0         0          0

This example shows the historical view of the TCAM resource utilization as snapshots. Each snapshot displays the state of TCAM utilization in the corresponding time interval.

switch# show icam resource fib_tcam module 5 inst 0 history 5
====================================================================================
FIB TCAM Resource Utilization (Mod 5, Inst 0)
------------------------------------------------------------------------------------
          Type        logical       physical   Percent_Util          Timestamp (UTC)
------------------------------------------------------------------------------------
  IPV4 unicast             16             16           0.00      2017-09-12 06:06:53
                           16             16           0.00      2017-09-12 07:06:53
                           16             16           0.00      2017-09-12 08:06:53
                           16             16           0.00      2017-09-12 09:06:53
                           16             16           0.00      2017-09-12 10:06:53
       DIAG_80              0              0           0.00      2017-09-12 06:06:53
                            0              0           0.00      2017-09-12 07:06:53
                            0              0           0.00      2017-09-12 08:06:53
                            0              0           0.00      2017-09-12 09:06:53
                            0              0           0.00      2017-09-12 10:06:53
IPV4 multicast              6              6           0.00      2017-09-12 06:06:53
                           45             45           0.10      2017-09-12 07:06:53
                           45             45           0.10      2017-09-12 08:06:53
                           62             62           0.17      2017-09-12 09:06:53
                           62             62           0.17      2017-09-12 10:06:53
          MPLS              0              0           0.00      2017-09-12 06:06:53
                            0              0           0.00      2017-09-12 07:06:53
                            0              0           0.00      2017-09-12 08:06:53
                            0              0           0.00      2017-09-12 09:06:53
                            0              0           0.00      2017-09-12 10:06:53


Example: iCAM CLI Outputs

The following example shows how to view the running configuration for iCAM:

switch# show running-config icam
!Command: show running-config icam
!Time: Tue Sep  5 21:49:50 2017

version 8.2(1)
feature icam
icam monitor interval 1 num_intervals 168
icam monitor resource acl-tcam module 3 inst 4
icam monitor resource acl-tcam module 3 inst 5
icam monitor entries acl module 3 inst 5
icam monitor resource fib-tcam module 3 inst 5
icam monitor entries multicast module 3

This example shows how to view current TCAM entries and their traffic statistics.

switch# show icam entries acl module 3 inst 5
Retrieving data from linecard.  This may take some time ...

=================================================================================================================
TCAM Entries (Mod 3,Inst 5)
-----------------------------------------------------------------------------------------------------------------
 Feature  Pkt_Type                                    Source IP/Mask Dest IP/Mask     Action      ifindex   Stats
-----------------------------------------------------------------------------------------------------------------
     FEX    IPv4                                           ip 0.0.0.0/0 0.0.0.0/0   Redirect   0x15090000       0
     FEX    IPv6  ip 0x00000000000000000000000000000000/0 0x000000000000000000000   Redirect   0x15090000       0
     FEX     MAC      0000.0000.0000 0000.0000.0000 0000.0000.0000 0000.0000.0000   Redirect   0x15090000       0
     FEX     ARP  arp-rarp/all ip 0.0.0.0/0 0.0.0.0/0 0000.0000.0000 0000.0000.00   Redirect   0x15090000       0
    RACL    IPv4                                 tcp 209.165.200.225/27 0.0.0.0/0     Permit   0x1a10a000       0
    RACL    IPv4                                   tcp 209.165.201.1/27 0.0.0.0/0     Permit   0x1a10a000       0
    RACL    IPv4                                 tcp 209.165.202.129/27 0.0.0.0/0     Permit   0x1a10a000       0
    RACL    IPv4                                 tcp 209.165.202.139/27 0.0.0.0/0     Permit   0x1a10a000       0
    RACL    IPv4                                 tcp 209.165.202.140/27 0.0.0.0/0     Permit   0x1a10a000       0
QoS COPP    IPv4                                   udp 0.0.0.0/0 209.165.201.3/27        QoS          0x0       0
QoS COPP    IPv4                                       209.165.201.1/27 0.0.0.0/0        QoS          0x0       0
QoS COPP    IPv4                                   udp 0.0.0.0/0 209.165.201.1/27        QoS          0x0       0
QoS COPP    IPv4                                   udp 0.0.0.0/0 209.165.201.7/27        QoS          0x0       0
QoS COPP    IPv4                                  udp 0.0.0.0/0 209.165.201.11/27        QoS          0x0       0
QoS COPP    IPv4                                   ip 0.0.0.0/0 209.165.201.14/27        QoS          0x0       0


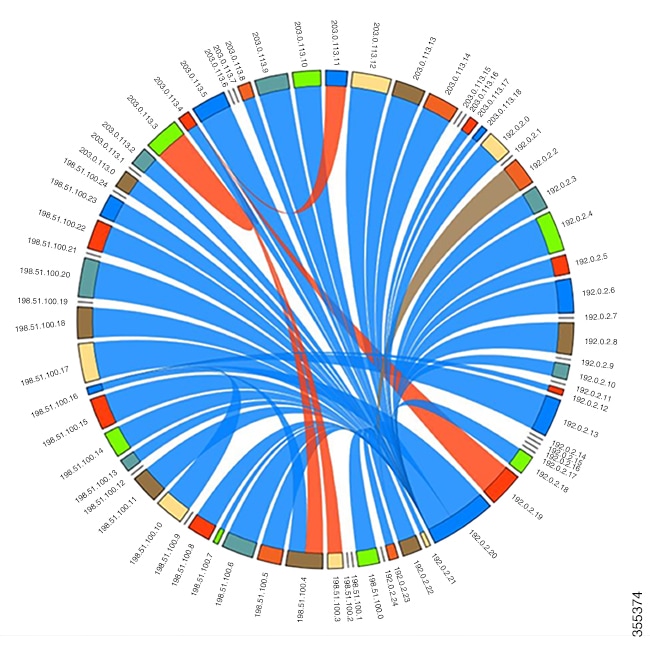
The following chord diagram is a simple representation of a complex traffic flow, where the traffic flow between the various sources and destinations is uniform.

Figure 8. Chord Diagram Representing Uniform Traffic Flow

This example shows how to view the top 10% of TCAM entries for a current date and filtered by a feature name.

switch# show icam entries acl module 3 inst 5 sort filter "qos copp" top 10
Retrieving data from linecard. This may take some time ...
=================================================================================================================
TCAM Entries (Mod 3,Inst 5)
-----------------------------------------------------------------------------------------------------------------
 Feature  Pkt_Type                                   Source IP/Mask Dest IP/Mask    Action    ifindex       Stats
-----------------------------------------------------------------------------------------------------------------
QoS COPP    IPv4                                          ip 0.0.0.0/0 0.0.0.0/0       QoS        0x0    38408890
QoS COPP     MAC  0000.0000.0000 0000.0000.0000 0180.c200.000e ffff.ffff.ffff 350      QoS        0x0         254
QoS COPP     MAC     0000.0000.0000 0000.0000.0000 0100.0ccc.cccc ffff.ffff.ffff       QoS        0x0          23
QoS COPP    IPv4                                  udp 0.0.0.0/0 209.165.201.1/27       QoS        0x0           0

This example shows how to view current TCAM entries filtered by a feature name using the exact keyword.

switch# show icam entries acl module 7 inst 0 sort filter QoS exact top 100
Retrieving data from linecard. This may take some time ...
========================================================================================================
TCAM Entries (Mod 7,Inst 0)
--------------------------------------------------------------------------------------------------------
   Feature  Pkt_Type                      Source IP/Mask Dest IP/Mask     Action      ifindex      Stats
--------------------------------------------------------------------------------------------------------
       QoS    IPv4             ip 209.165.201.1/27 209.165.202.129/27        QoS   0x1a316000          0
       QoS    IPv4             ip 209.165.201.1/27 209.165.202.129/27        QoS   0x1a316000          0
       QoS    IPv4             ip 209.165.201.2/27 209.165.202.129/27        QoS   0x1a316000          0
       QoS    IPv4             ip 209.165.201.2/27 209.165.202.129/27        QoS   0x1a316000          0
       QoS    IPv4             ip 209.165.201.3/27 209.165.202.129/27        QoS   0x1a316000          0
       QoS    IPv4             ip 209.165.201.3/27 209.165.202.129/27        QoS   0x1a316000          0
       QoS    IPv4                    ip 0.0.0.0/0 0.0.0.0/0                 QoS   0x1a316000          0
       QoS    IPv4                    ip 0.0.0.0/0 0.0.0.0/0                 QoS   0x1a316000          0

This example shows how to view the history of TCAM entries monitored by iCAM.

switch# show icam entries acl module 3 inst 5 history 2
===========================================================================================================================
TCAM Entries (Mod 3,Inst 5): Cumulative stats for last 2 intervals
---------------------------------------------------------------------------------------------------------------------------
Feature  Pkt_Type                                    Source IP/Mask Dest IP/Mask    Action      ifindex   Stats   Rate(pps)
---------------------------------------------------------------------------------------------------------------------------
    FEX    IPv4                                          ip 0.0.0.0/0 0.0.0.0/0   Redirect   0x15090000       0           0
    FEX    IPv6  ip 0x00000000000000000000000000000000/0 0x000000000000000000000  Redirect   0x15090000       0           0
    FEX     MAC     0000.0000.0000 0000.0000.0000 0000.0000.0000 0000.0000.0000   Redirect   0x15090000       0           0
    FEX     ARP  arp-rarp/all ip 0.0.0.0/0 0.0.0.0/0 0000.0000.0000 0000.0000.00  Redirect   0x15090000       0           0
   RACL    IPv4                                  tcp 209.165.201.1/27 0.0.0.0/0     Permit   0x1a10a000       0           0
   RACL    IPv4                                  tcp 209.165.201.2/27 0.0.0.0/0     Permit   0x1a10a000       0           0
   RACL    IPv4                                  tcp 209.165.201.3/27 0.0.0.0/0     Permit   0x1a10a000       0           0
   RACL    IPv4                                  tcp 209.165.201.4/27 0.0.0.0/0     Permit   0x1a10a000       0           0
   RACL    IPv4                                  tcp 209.165.201.5/27 0.0.0.0/0     Permit   0x1a10a000       0           0
QoS COPP   IPv4                                  udp 0.0.0.0/0 209.165.201.1/27        QoS          0x0       0           0
QoS COPP   IPv4                                  udp 0.0.0.0/0 209.165.201.7/27        QoS          0x0       0           0
QoS COPP   IPv4                                 udp 0.0.0.0/0 209.165.201.11/27        QoS          0x0       0           0

This example shows how to view the history of top 1% of TCAM entries filtered by a feature name.

switch# show icam entries acl module 3 inst 5 history 2 sort filter "qos copp" top 1
=========================================================================================================================
TCAM Entries (Mod 3,Inst 5): Cumulative stats for last 2 intervals
-------------------------------------------------------------------------------------------------------------------------
 Feature  Pkt_Type                                    Source IP/Mask Dest IP/Mask    Action    ifindex   Stats  Rate(pps)
-------------------------------------------------------------------------------------------------------------------------
QoS COPP     MAC  0000.0000.0000 0000.0000.0000 0180.c200.000e ffff.ffff.ffff 350       QoS        0x0      48          0
QoS COPP     MAC     0000.0000.0000 0000.0000.0000 0100.0ccc.cccc ffff.ffff.ffff        QoS        0x0       4          0
QoS COPP    IPv4                                         tcp 0.0.0.0/0 0.0.0.0/0        QoS        0x0       0          0

This example displays the prediction for the traffic statistics of TCAM entries on a module and an instance for which iCAM monitoring is enabled.

switch# show icam prediction entries acl module 3 inst 5 2018 Jan 27 11:35:30
Generating predictions, this may take some time ...

====================================================================================================================================
TCAM Entries Prediction (Mod 3,Inst 5)
------------------------------------------------------------------------------------------------------------------------------------
   Feature  Pkt_Type                                    Source IP/Mask Dest IP/Mask    Action     ifindex        Stats    Prediction
------------------------------------------------------------------------------------------------------------------------------------
  QoS COPP    IPv4                                          ip 0.0.0.0/0 0.0.0.0/0        QoS         0x0     38408890      38408890
  QoS COPP     MAC  0000.0000.0000 0000.0000.0000 0180.c200.000e ffff.ffff.ffff 350       QoS         0x0          485           501
  QoS COPP     MAC     0000.0000.0000 0000.0000.0000 0100.0ccc.cccc ffff.ffff.ffff        QoS         0x0           42            43
       FEX    IPv4                                          ip 0.0.0.0/0 0.0.0.0/0   Redirect  0x15090000            0             0


This example displays the predictive analytics of the top 2% TCAM entries.

switch# show icam prediction entries acl module 3 inst 5 2018 Jan 27 11:35:30 top 2
Generating predictions, this may take some time ...

====================================================================================================================================
TCAM Entries Prediction (Mod 3,Inst 5)
------------------------------------------------------------------------------------------------------------------------------------
   Feature  Pkt_Type                                    Source IP/Mask Dest IP/Mask    Action     ifindex        Stats    Prediction
------------------------------------------------------------------------------------------------------------------------------------
  QoS COPP    IPv4                                          ip 0.0.0.0/0 0.0.0.0/0        QoS         0x0      38408890     38408890
  QoS COPP     MAC  0000.0000.0000 0000.0000.0000 0180.c200.000e ffff.ffff.ffff 350       QoS         0x0           485          501
  QoS COPP     MAC     0000.0000.0000 0000.0000.0000 0100.0ccc.cccc ffff.ffff.ffff        QoS         0x0            42           43
       FEX    IPv6  ip 0x00000000000000000000000000000000/0 0x000000000000000000000  Redirect  0x15090000             0            0
       FEX    IPv4                                          ip 0.0.0.0/0 0.0.0.0/0   Redirect  0x15090000             0            0
       FEX     ARP  arp-rarp/all ip 0.0.0.0/0 0.0.0.0/0 0000.0000.0000 0000.0000.00  Redirect  0x15090000             0            0
       FEX     MAC     0000.0000.0000 0000.0000.0000 0000.0000.0000 0000.0000.0000   Redirect  0x15090000             0            0


This example shows how to view iCAM monitoring of the multicast entries for a current date.

switch# show icam entries multicast module 3
Retrieving data from linecard.  This may take some time ...

======================================================================================================
Multicast Entries (Mod 3)
------------------------------------------------------------------------------------------------------
    VDC_ID       TABLE_ID          Source/Mask        Group/Mask                   RPF           Stats
------------------------------------------------------------------------------------------------------
         1              1            0.0.0.0/0        209.165.201.9/27                               1
         1              1    209.165.201.18/27        209.165.201.10/27   Ethernet3/12          912494
         1              1    209.165.201.19/27        209.165.201.10/27   Ethernet3/12          912494
         1              1    209.165.201.20/27        209.165.201.10/27   Ethernet3/12          912494
         1              1    209.165.201.21/27        209.165.201.10/27   Ethernet3/12          912493
         1              1    209.165.201.22/27        209.165.201.10/27   Ethernet3/12          912493
         1              1    209.165.201.23/27        209.165.201.10/27   Ethernet3/12          912493
         1              1    209.165.201.24/27        209.165.201.10/27   Ethernet3/12          912493
         1              1    209.165.201.25/27        209.165.201.10/27   Ethernet3/12          912493
         1              1    209.165.201.26/27        209.165.201.10/27   Ethernet3/12          912480
         1              1    209.165.201.27/27        209.165.201.10/27   Ethernet3/12          912479
         1              1    209.165.201.28/27        209.165.201.10/27   Ethernet3/12          912479
         1              1    209.165.201.29/27        209.165.201.10/27   Ethernet3/12          912479
         1              1    209.165.201.30/27        209.165.201.10/27   Ethernet3/12          912479
         1              1   209.165.202.129/27        209.165.201.10/27   Ethernet3/12          912479
         1              1   209.165.202.130/27        209.165.201.10/27   Ethernet3/12          912479
         1              1   209.165.202.131/27        209.165.201.10/27   Ethernet3/12          912471
         1              1   209.165.202.132/27        209.165.201.10/27   Ethernet3/12          912470
         1              1   209.165.202.133/27        209.165.201.10/27   Ethernet3/12          912470
         1              1   209.165.202.134/27        209.165.201.10/27   Ethernet3/12          912442
         1              1   209.165.202.135/27        209.165.201.10/27   Ethernet3/12          912442
         1              1   209.165.202.136/27        209.165.201.10/27   Ethernet3/12          912442
         1              1   209.165.202.137/27        209.165.201.10/27   Ethernet3/12          912441
         1              1   209.165.202.138/27        209.165.201.10/27   Ethernet3/12          912441
         1              1   209.165.202.139/27        209.165.201.10/27   Ethernet3/12          912441
         1              1   209.165.202.140/27        209.165.201.10/27   Ethernet3/12          912441
         1              1   209.165.202.141/27        209.165.201.10/27   Ethernet3/12          912431
         1              1   209.165.202.142/27        209.165.201.10/27   Ethernet3/12          912431
         1              1   209.165.202.143/27        209.165.201.10/27   Ethernet3/12          912431
         1              1   209.165.202.144/27        209.165.201.10/27   Ethernet3/12          912431
         1              1   209.165.202.145/27        209.165.201.10/27   Ethernet3/12          912411
         1              1   209.165.202.146/27        209.165.201.10/27   Ethernet3/12          912412
         1              1   209.165.202.147/27        209.165.201.10/27   Ethernet3/12          912411
         1              1   209.165.202.148/27        209.165.201.10/27   Ethernet3/12          912411
         1              1   209.165.202.149/27        209.165.201.10/27   Ethernet3/12          912411
         1              1   209.165.202.150/27        209.165.201.10/27   Ethernet3/12          912345
         1              1   209.165.202.151/27        209.165.201.10/27   Ethernet3/12          912345
         1              1   209.165.202.152/27        209.165.201.10/27   Ethernet3/12          912345
         1              1   209.165.202.153/27        209.165.201.10/27   Ethernet3/12          912345
         1              1   209.165.202.154/27        209.165.201.10/27   Ethernet3/12          912345
         1              1   209.165.202.155/27        209.165.201.10/27   Ethernet3/12          912345
         1              1   209.165.202.156/27        209.165.201.10/27   Ethernet3/12          912344
         1              1   209.165.202.157/27        209.165.201.10/27   Ethernet3/12          912333
         1              1   209.165.202.158/27        209.165.201.10/27   Ethernet3/12          912333


This example shows how to view the top 1% multicast entries monitored by iCAM for a current date.

switch# show icam entries multicast module 3 sort top 1
Retrieving data from linecard. This may take some time ...
==========================================================================================================
Multicast Entries (Mod 3)
----------------------------------------------------------------------------------------------------------
    VDC_ID       TABLE_ID          Source/Mask        Group/Mask                   RPF               Stats
----------------------------------------------------------------------------------------------------------
         1              1   209.165.200.225/27        209.165.201.10/27   Ethernet3/12              933495
         1              1   209.165.200.226/27        209.165.201.10/27   Ethernet3/12              933491
         1              1   209.165.200.227/27        209.165.201.10/27   Ethernet3/12              933488
         1              1   209.165.200.228/27        209.165.201.10/27   Ethernet3/12              933483
         1              1   209.165.200.229/27        209.165.201.10/27   Ethernet3/12              933483
         1              1   209.165.200.230/27        209.165.201.10/27   Ethernet3/12              933480
         1              1   209.165.200.231/27        209.165.201.10/27   Ethernet3/12              933476
         1              1   209.165.200.232/27        209.165.201.10/27   Ethernet3/12              933474
         1              1   209.165.200.233/27        209.165.201.10/27   Ethernet3/12              933469
         1              1   209.165.200.234/27        209.165.201.10/27   Ethernet3/12              933469
         1              1   209.165.200.235/27        209.165.201.10/27   Ethernet3/12              933466
         1              1   209.165.200.236/27        209.165.201.10/27   Ethernet3/12              933462
         1              1   209.165.200.237/27        209.165.201.10/27   Ethernet3/12              933456
         1              1   209.165.200.238/27        209.165.201.10/27   Ethernet3/12              933455
         1              1     209.165.201.1/27        209.165.201.10/27   Ethernet3/12              933455
         1              1     209.165.201.2/27        209.165.201.10/27   Ethernet3/12              933452
         1              1     209.165.201.3/27        209.165.201.10/27   Ethernet3/12              933449
         1              1     209.165.201.4/27        209.165.201.10/27   Ethernet3/12              933442
         1              1     209.165.201.5/27        209.165.201.10/27   Ethernet3/12              933441
         1              1     209.165.201.6/27        209.165.201.10/27   Ethernet3/12              933441
         1              1     209.165.201.7/27        209.165.201.10/27   Ethernet3/12              933441
         1              1     209.165.201.8/27        209.165.201.10/27   Ethernet3/12              933435
         1              1     209.165.201.9/27        209.165.201.10/27   Ethernet3/12              933434
         1              1    209.165.201.11/27        209.165.201.10/27   Ethernet3/12              933418
         1              1    209.165.201.12/27        209.165.201.10/27   Ethernet3/12              933202
         1              1    209.165.201.13/27        209.165.201.10/27   Ethernet3/12              933202
         1              1    209.165.201.14/27        209.165.201.10/27   Ethernet3/12              933202
         1              1    209.165.201.15/27        209.165.201.10/27   Ethernet3/12              933202
         1              1    209.165.201.16/27        209.165.201.10/27   Ethernet3/12              933202
         1              1    209.165.201.17/27        209.165.201.10/27   Ethernet3/12              933202
         1              1    209.165.201.18/27        209.165.201.10/27   Ethernet3/12              933202
         1              1    209.165.201.19/27        209.165.201.10/27   Ethernet3/12              933202
         1              1    209.165.201.20/27        209.165.201.10/27   Ethernet3/12              933188
         1              1    209.165.201.21/27        209.165.201.10/27   Ethernet3/12              933187
         1              1    209.165.201.22/27        209.165.201.10/27   Ethernet3/12              933187
         1              1    209.165.201.23/27        209.165.201.10/27   Ethernet3/12              933187
         1              1    209.165.201.24/27        209.165.201.10/27   Ethernet3/12              933187
         1              1    209.165.201.25/27        209.165.201.10/27   Ethernet3/12              933187
         1              1    209.165.201.26/27        209.165.201.10/27   Ethernet3/12              933187
         1              1    209.165.201.27/27        209.165.201.10/27   Ethernet3/12              933179
         1              1    209.165.201.28/27        209.165.201.10/27   Ethernet3/12              933178
         1              1    209.165.201.29/27        209.165.201.10/27   Ethernet3/12              933178
         1              1    209.165.201.30/27        209.165.201.10/27   Ethernet3/12              933150
         1              1   209.165.202.129/27        209.165.201.10/27   Ethernet3/12              933150
         1              1   209.165.202.130/27        209.165.201.10/27   Ethernet3/12              933150
         1              1   209.165.202.131/27        209.165.201.10/27   Ethernet3/12              933149
         1              1   209.165.202.132/27        209.165.201.10/27   Ethernet3/12              933149
         1              1   209.165.202.133/27        209.165.201.10/27   Ethernet3/12              933149
         1              1   209.165.202.134/27        209.165.201.10/27   Ethernet3/12              933149
         1              1   209.165.202.135/27        209.165.201.10/27   Ethernet3/12              933139

This example shows how to view the history of multicast entries monitored by iCAM.

switch# show icam entries multicast module 3 history 2
========================================================================================================================
Multicast Entries (Mod 3): Cumulative stats for last 2 intervals
------------------------------------------------------------------------------------------------------------------------
    VDC_ID       TABLE_ID          Source/Mask       Group/Mask                   RPF               Stats      Rate(pps)
------------------------------------------------------------------------------------------------------------------------
         1              1           0.0.0.0/0        209.165.201.9/27                                   0              0
         1              1    209.165.201.18/27       209.165.201.10/27   Ethernet3/12              165792            690
         1              1    209.165.201.19/27       209.165.201.10/27   Ethernet3/12              165792            690
         1              1    209.165.201.20/27       209.165.201.10/27   Ethernet3/12              165793            690
         1              1    209.165.201.21/27       209.165.201.10/27   Ethernet3/12              165793            690
         1              1    209.165.201.22/27       209.165.201.10/27   Ethernet3/12              165792            690
         1              1    209.165.201.23/27       209.165.201.10/27   Ethernet3/12              165792            690
         1              1    209.165.201.24/27       209.165.201.10/27   Ethernet3/12              165792            690
         1              1    209.165.201.25/27       209.165.201.10/27   Ethernet3/12              165792            690
         1              1    209.165.201.26/27       209.165.201.10/27   Ethernet3/12              165792            690
         1              1    209.165.201.27/27       209.165.201.10/27   Ethernet3/12              165792            690
         1              1    209.165.201.28/27       209.165.201.10/27   Ethernet3/12              165792            690
         1              1    209.165.201.29/27       209.165.201.10/27   Ethernet3/12              165792            690
         1              1    209.165.201.30/27       209.165.201.10/27   Ethernet3/12              165792            690
         1              1   209.165.202.129/27       209.165.201.10/27   Ethernet3/12              165792            690
         1              1   209.165.202.130/27       209.165.201.10/27   Ethernet3/12              165792            690
         1              1   209.165.202.131/27       209.165.201.10/27   Ethernet3/12              165792            690
         1              1   209.165.202.132/27       209.165.201.10/27   Ethernet3/12              165792            690
         1              1   209.165.202.133/27       209.165.201.10/27   Ethernet3/12              165792            690
         1              1   209.165.202.134/27       209.165.201.10/27   Ethernet3/12              165792            690
         1              1   209.165.202.135/27       209.165.201.10/27   Ethernet3/12              165792            690
         1              1   209.165.202.136/27       209.165.201.10/27   Ethernet3/12              165792            690
         1              1   209.165.202.137/27       209.165.201.10/27   Ethernet3/12              165792            690
         1              1   209.165.202.138/27       209.165.201.10/27   Ethernet3/12              165792            690
         1              1   209.165.202.139/27       209.165.201.10/27   Ethernet3/12              165792            690
         1              1   209.165.202.140/27       209.165.201.10/27   Ethernet3/12              165792            690
         1              1   209.165.202.141/27       209.165.201.10/27   Ethernet3/12              165792            690
         1              1   209.165.202.142/27       209.165.201.10/27   Ethernet3/12              165792            690
         1              1   209.165.202.143/27       209.165.201.10/27   Ethernet3/12              165792            690
         1              1   209.165.202.144/27       209.165.201.10/27   Ethernet3/12              165792            690
         1              1   209.165.202.145/27       209.165.201.10/27   Ethernet3/12              165792            690
         1              1   209.165.202.146/27       209.165.201.10/27   Ethernet3/12              165792            690
         1              1   209.165.202.147/27       209.165.201.10/27   Ethernet3/12              165792            690
         1              1   209.165.202.148/27       209.165.201.10/27   Ethernet3/12              165792            690
         1              1   209.165.202.149/27       209.165.201.10/27   Ethernet3/12              165792            690
         1              1   209.165.202.150/27       209.165.201.10/27   Ethernet3/12              165792            690
         1              1   209.165.202.151/27       209.165.201.10/27   Ethernet3/12              165792            690
         1              1   209.165.202.152/27       209.165.201.10/27   Ethernet3/12              165792            690
         1              1   209.165.202.153/27       209.165.201.10/27   Ethernet3/12              165792            690
         1              1   209.165.202.154/27       209.165.201.10/27   Ethernet3/12              165792            690
         1              1   209.165.202.155/27       209.165.201.10/27   Ethernet3/12              165792            690
         1              1   209.165.202.156/27       209.165.201.10/27   Ethernet3/12              165792            690
         1              1   209.165.202.157/27       209.165.201.10/27   Ethernet3/12              165792            690
         1              1   209.165.202.158/27       209.165.201.10/27   Ethernet3/12              165792            690
.
.
.

This example shows how to view the history of top 1% multicast entries monitored by iCAM.

switch# show icam entries multicast module 3 history 2 sort top 1
=========================================================================================================================
Multicast Entries (Mod 3): Cumulative stats for last 2 intervals
-------------------------------------------------------------------------------------------------------------------------
    VDC_ID       TABLE_ID          Source/Mask        Group/Mask                   RPF               Stats      Rate(pps)
-------------------------------------------------------------------------------------------------------------------------
         1              1   209.165.200.225/27        209.165.201.10/27   Ethernet3/12              165725            690
         1              1   209.165.200.226/27        209.165.201.10/27   Ethernet3/12              165725            690
         1              1   209.165.200.227/27        209.165.201.10/27   Ethernet3/12              165725            690
         1              1   209.165.200.228/27        209.165.201.10/27   Ethernet3/12              165725            690
         1              1   209.165.200.229/27        209.165.201.10/27   Ethernet3/12              165725            690
         1              1   209.165.200.230/27        209.165.201.10/27   Ethernet3/12              165725            690
         1              1   209.165.200.231/27        209.165.201.10/27   Ethernet3/12              165725            690
         1              1   209.165.200.232/27        209.165.201.10/27   Ethernet3/12              165725            690
         1              1   209.165.200.233/27        209.165.201.10/27   Ethernet3/12              165725            690
         1              1   209.165.200.234/27        209.165.201.10/27   Ethernet3/12              165725            690
         1              1   209.165.200.235/27        209.165.201.10/27   Ethernet3/12              165724            690
         1              1   209.165.200.236/27        209.165.201.10/27   Ethernet3/12              165724            690
         1              1   209.165.200.237/27        209.165.201.10/27   Ethernet3/12              165724            690
         1              1   209.165.200.238/27        209.165.201.10/27   Ethernet3/12              165724            690
         1              1     209.165.201.1/27        209.165.201.10/27   Ethernet3/12              165724            690
         1              1     209.165.201.2/27        209.165.201.10/27   Ethernet3/12              165724            690
         1              1     209.165.201.3/27        209.165.201.10/27   Ethernet3/12              165724            690
         1              1     209.165.201.4/27        209.165.201.10/27   Ethernet3/12              165724            690
         1              1     209.165.201.5/27        209.165.201.10/27   Ethernet3/12              165724            690
         1              1     209.165.201.6/27        209.165.201.10/27   Ethernet3/12              165724            690
         1              1     209.165.201.7/27        209.165.201.10/27   Ethernet3/12              165724            690
         1              1     209.165.201.8/27        209.165.201.10/27   Ethernet3/12              165724            690
         1              1     209.165.201.9/27        209.165.201.10/27   Ethernet3/12              165724            690
         1              1    209.165.201.11/27        209.165.201.10/27   Ethernet3/12              165724            690
         1              1    209.165.201.12/27        209.165.201.10/27   Ethernet3/12              165724            690
         1              1    209.165.201.13/27        209.165.201.10/27   Ethernet3/12              165724            690
         1              1    209.165.201.14/27        209.165.201.10/27   Ethernet3/12              165724            690
         1              1    209.165.201.15/27        209.165.201.10/27   Ethernet3/12              165724            690
         1              1    209.165.201.16/27        209.165.201.10/27   Ethernet3/12              165724            690
         1              1    209.165.201.17/27        209.165.201.10/27   Ethernet3/12              165724            690
         1              1    209.165.201.18/27        209.165.201.10/27   Ethernet3/12              165724            690
         1              1    209.165.201.19/27        209.165.201.10/27   Ethernet3/12              165724            690
         1              1    209.165.201.20/27        209.165.201.10/27   Ethernet3/12              165724            690
         1              1    209.165.201.21/27        209.165.201.10/27   Ethernet3/12              165724            690
         1              1    209.165.201.22/27        209.165.201.10/27   Ethernet3/12              165724            690
         1              1    209.165.201.23/27        209.165.201.10/27   Ethernet3/12              165724            690
         1              1    209.165.201.24/27        209.165.201.10/27   Ethernet3/12              165724            690
         1              1    209.165.201.25/27        209.165.201.10/27   Ethernet3/12              165724            690
         1              1    209.165.201.26/27        209.165.201.10/27   Ethernet3/12              165724            690
         1              1    209.165.201.27/27        209.165.201.10/27   Ethernet3/12              165724            690
         1              1    209.165.201.28/27        209.165.201.10/27   Ethernet3/12              165724            690
         1              1    209.165.201.29/27        209.165.201.10/27   Ethernet3/12              165724            690
         1              1    209.165.201.30/27        209.165.201.10/27   Ethernet3/12              165724            690
         1              1   209.165.202.129/27        209.165.201.10/27   Ethernet3/12              165724            690
         1              1   209.165.202.130/27        209.165.201.10/27   Ethernet3/12              165724            690
         1              1   209.165.202.131/27        209.165.201.10/27   Ethernet3/12              165724            690
         1              1   209.165.202.132/27        209.165.201.10/27   Ethernet3/12              165724            690
         1              1   209.165.202.133/27        209.165.201.10/27   Ethernet3/12              165724            690
         1              1   209.165.202.134/27        209.165.201.10/27   Ethernet3/12              165724            690
         1              1   209.165.202.135/27        209.165.201.10/27   Ethernet3/12              165724            690

This example displays the predictive analytics of the multicast entries.

switch# show icam prediction entries multicast module 3 2020 Jul 19 08:10:29
Generating predictions, this may take some time ...

===============================================================================================================================
Multicast Entries Prediction (Mod 3)
-------------------------------------------------------------------------------------------------------------------------------
    VDC_ID       TABLE_ID           Source/Mask                Group/Mask            RPF               Stats         Prediction
-------------------------------------------------------------------------------------------------------------------------------
         1              1    209.165.202.129/27        209.165.200.225/27   Ethernet3/12             1679387            1679387
         1              1     209.165.201.23/27        209.165.200.225/27   Ethernet3/12             1679419            1679419
         1              1     209.165.201.24/27        209.165.200.225/27   Ethernet3/12             1679411            1679411
         1              1     209.165.201.25/27        209.165.200.225/27   Ethernet3/12             1679411            1679411
         1              1     209.165.201.26/27        209.165.200.225/27   Ethernet3/12             1679411            1679411
         1              1     209.165.201.27/27        209.165.200.225/27   Ethernet3/12             1679411            1679411
         1              1     209.165.201.28/27        209.165.200.225/27   Ethernet3/12             1679404            1679404
         1              1     209.165.201.29/27        209.165.200.225/27   Ethernet3/12             1679403            1679403
         1              1     209.165.201.30/27        209.165.200.225/27   Ethernet3/12             1679403            1679403
         1              1      209.165.201.8/27        209.165.200.225/27   Ethernet3/12             1679113            1679113
         1              1      209.165.201.7/27        209.165.200.225/27   Ethernet3/12             1679113            1679113
         1              1      209.165.201.4/27        209.165.200.225/27   Ethernet3/12             1679141            1679141
         1              1      209.165.201.3/27        209.165.200.225/27   Ethernet3/12             1679142            1679142
         1              1      209.165.201.6/27        209.165.200.225/27   Ethernet3/12             1679113            1679113
         1              1      209.165.201.5/27        209.165.200.225/27   Ethernet3/12             1679141            1679141
         1              1    209.165.200.238/27        209.165.200.225/27   Ethernet3/12             1679150            1679150
         1              1    209.165.200.237/27        209.165.200.225/27   Ethernet3/12             1679150            1679150
         1              1      209.165.201.2/27        209.165.200.225/27   Ethernet3/12             1679150            1679150
         1              1      209.165.201.1/27        209.165.200.225/27   Ethernet3/12             1679150            1679150
         1              1    209.165.200.226/27        209.165.200.225/27   Ethernet3/12             1679166            1679166
         1              1     209.165.201.22/27        209.165.200.225/27   Ethernet3/12             1679422            1679422
         1              1     209.165.201.21/27        209.165.200.225/27   Ethernet3/12             1679424            1679424
         1              1     209.165.201.20/27        209.165.200.225/27   Ethernet3/12             1679424            1679424
         1              1     209.165.201.19/27        209.165.200.225/27   Ethernet3/12             1679425            1679425
         1              1     209.165.201.18/27        209.165.200.225/27   Ethernet3/12             1679431            1679431
         1              1     209.165.201.17/27        209.165.200.225/27   Ethernet3/12             1679435            1679435
         1              1     209.165.201.16/27        209.165.200.225/27   Ethernet3/12             1679438            1679438
         1              1     209.165.201.15/27        209.165.200.225/27   Ethernet3/12             1679438            1679438
         1              1     209.165.201.14/27        209.165.200.225/27   Ethernet3/12             1679443            1679443
         1              1     209.165.201.13/27        209.165.200.225/27   Ethernet3/12             1679445            1679445
         1              1    209.165.200.235/27        209.165.200.225/27   Ethernet3/12             1679150            1679150
         1              1    209.165.200.236/27        209.165.200.225/27   Ethernet3/12             1679150            1679150
         1              1    209.165.200.233/27        209.165.200.225/27   Ethernet3/12             1679165            1679165
         1              1    209.165.200.234/27        209.165.200.225/27   Ethernet3/12             1679151            1679151
         1              1    209.165.200.231/27        209.165.200.225/27   Ethernet3/12             1679165            1679165
         1              1    209.165.200.232/27        209.165.200.225/27   Ethernet3/12             1679165            1679165
         1              1    209.165.200.229/27        209.165.200.225/27   Ethernet3/12             1679165            1679165
         1              1    209.165.200.230/27        209.165.200.225/27   Ethernet3/12             1679165            1679165
         1              1    209.165.200.227/27        209.165.200.225/27   Ethernet3/12             1679166            1679166
         1              1    209.165.200.228/27        209.165.200.225/27   Ethernet3/12             1679166            1679166
         1              1     209.165.201.12/27        209.165.200.225/27   Ethernet3/12             1679103            1679103
         1              1      209.165.201.9/27        209.165.200.225/27   Ethernet3/12             1679112            1679112
         1              1     209.165.201.10/27        209.165.200.225/27   Ethernet3/12             1679113            1679113
         1              1     209.165.201.11/27        209.165.200.225/27   Ethernet3/12             1679113            1679113
.
.
.


This example displays the predictive analytics of the top 1% multicast entries.

switch# show icam prediction entries multicast module 3 2020 Jul 19 08:10:29 top 1
Generating predictions, this may take some time ...

==================================================================================================================
Multicast Entries Prediction (Mod 3)
------------------------------------------------------------------------------------------------------------------
    VDC_ID       TABLE_ID           Source/Mask                Group/Mask            RPF        Stats   Prediction
------------------------------------------------------------------------------------------------------------------
         1              1    209.165.202.129/27        209.165.200.225/27   Ethernet3/12      1679387      1679387
         1              1     209.165.201.23/27        209.165.200.225/27   Ethernet3/12      1679419      1679419
         1              1     209.165.201.24/27        209.165.200.225/27   Ethernet3/12      1679411      1679411
         1              1     209.165.201.25/27        209.165.200.225/27   Ethernet3/12      1679411      1679411
         1              1     209.165.201.26/27        209.165.200.225/27   Ethernet3/12      1679411      1679411
         1              1     209.165.201.27/27        209.165.200.225/27   Ethernet3/12      1679411      1679411
         1              1     209.165.201.28/27        209.165.200.225/27   Ethernet3/12      1679404      1679404
         1              1     209.165.201.29/27        209.165.200.225/27   Ethernet3/12      1679403      1679403
         1              1     209.165.201.30/27        209.165.200.225/27   Ethernet3/12      1679403      1679403
         1              1      209.165.201.8/27        209.165.200.225/27   Ethernet3/12      1679113      1679113
         1              1      209.165.201.7/27        209.165.200.225/27   Ethernet3/12      1679113      1679113
         1              1      209.165.201.4/27        209.165.200.225/27   Ethernet3/12      1679141      1679141
         1              1      209.165.201.3/27        209.165.200.225/27   Ethernet3/12      1679142      1679142
         1              1      209.165.201.6/27        209.165.200.225/27   Ethernet3/12      1679113      1679113
         1              1      209.165.201.5/27        209.165.200.225/27   Ethernet3/12      1679141      1679141
         1              1    209.165.200.238/27        209.165.200.225/27   Ethernet3/12      1679150      1679150
         1              1    209.165.200.237/27        209.165.200.225/27   Ethernet3/12      1679150      1679150
         1              1      209.165.201.2/27        209.165.200.225/27   Ethernet3/12      1679150      1679150
         1              1      209.165.201.1/27        209.165.200.225/27   Ethernet3/12      1679150      1679150
         1              1    209.165.200.226/27        209.165.200.225/27   Ethernet3/12      1679166      1679166
         1              1     209.165.201.22/27        209.165.200.225/27   Ethernet3/12      1679422      1679422
         1              1     209.165.201.21/27        209.165.200.225/27   Ethernet3/12      1679424      1679424
         1              1     209.165.201.20/27        209.165.200.225/27   Ethernet3/12      1679424      1679424
         1              1     209.165.201.19/27        209.165.200.225/27   Ethernet3/12      1679425      1679425
         1              1     209.165.201.18/27        209.165.200.225/27   Ethernet3/12      1679431      1679431
         1              1     209.165.201.17/27        209.165.200.225/27   Ethernet3/12      1679435      1679435
         1              1     209.165.201.16/27        209.165.200.225/27   Ethernet3/12      1679438      1679438
         1              1     209.165.201.15/27        209.165.200.225/27   Ethernet3/12      1679438      1679438
         1              1     209.165.201.14/27        209.165.200.225/27   Ethernet3/12      1679443      1679443
         1              1     209.165.201.13/27        209.165.200.225/27   Ethernet3/12      1679445      1679445
         1              1    209.165.200.235/27        209.165.200.225/27   Ethernet3/12      1679150      1679150
         1              1    209.165.200.236/27        209.165.200.225/27   Ethernet3/12      1679150      1679150
         1              1    209.165.200.233/27        209.165.200.225/27   Ethernet3/12      1679165      1679165
         1              1    209.165.200.234/27        209.165.200.225/27   Ethernet3/12      1679151      1679151
         1              1    209.165.200.231/27        209.165.200.225/27   Ethernet3/12      1679165      1679165
         1              1    209.165.200.232/27        209.165.200.225/27   Ethernet3/12      1679165      1679165
         1              1    209.165.200.229/27        209.165.200.225/27   Ethernet3/12      1679165      1679165
         1              1    209.165.200.230/27        209.165.200.225/27   Ethernet3/12      1679165      1679165
         1              1    209.165.200.227/27        209.165.200.225/27   Ethernet3/12      1679166      1679166
         1              1    209.165.200.228/27        209.165.200.225/27   Ethernet3/12      1679166      1679166
         1              1     209.165.201.12/27        209.165.200.225/27   Ethernet3/12      1679103      1679103
         1              1      209.165.201.9/27        209.165.200.225/27   Ethernet3/12      1679112      1679112
         1              1     209.165.201.10/27        209.165.200.225/27   Ethernet3/12      1679113      1679113
         1              1     209.165.201.11/27        209.165.200.225/27   Ethernet3/12      1679113      1679113
.
.
.

This example shows how to view iCAM monitoring of the ACL TCAM resources for a current date.

switch# show icam resource acl-tcam module 3 inst 4
-----------------------------------------------------------------------------------------
Feature Hardware Resource Utilization (Mod 3,Inst 4)
-----------------------------------------------------------------------------------------

Ingress Resources
-----------------------------------------------------------------------------------------
    Feature TCAM# BANK# Feature_Entries   Free_Entries   Percent_Util     Timestamp (UTC)
-----------------------------------------------------------------------------------------
       PACL     0     0               4           4072           0.09 2017-09-05 22:05:28
       CoPP     1     1             420           3656          10.25 2017-09-05 22:05:28
FEX Control     1     0               5           4071           0.12 2017-09-05 22:05:28

Egress Resources
-----------------------------------------------------------------------------------------
    Feature TCAM# BANK# Feature_Entries   Free_Entries   Percent_Util     Timestamp (UTC)
-----------------------------------------------------------------------------------------

=========================================================================================
ACL TCAM Resource Utilization (Mod 3,Inst 4)
-----------------------------------------------------------------------------------------
                  Used    Free   Percent_Util          Timestamp (UTC)
-----------------------------------------------------------------------------------------
Tcam 0 Bank 0       24    4072           0.58      2017-09-05 22:05:28
Tcam 0 Bank 1       20    4076           0.48      2017-09-05 22:05:28
Tcam 1 Bank 0       25    4071           0.61      2017-09-05 22:05:28
Tcam 1 Bank 1      440    3656          10.74      2017-09-05 22:05:28

This example shows how to view the history of iCAM monitoring of the ACL TCAM resources.

switch# show icam resource acl-tcam module 3 inst 4 history 2
-----------------------------------------------------------------------------------------
Feature Hardware Resource Utilization (Mod 3,Inst 4)
-----------------------------------------------------------------------------------------

Ingress Resources
-----------------------------------------------------------------------------------------
    Feature TCAM# BANK# Feature_Entries   Free_Entries   Percent_Util     Timestamp (UTC)
-----------------------------------------------------------------------------------------
       PACL     0     0               4           4072           0.09 2017-09-05 22:09:12
                                      4           4072           0.09 2017-09-05 23:09:12
       CoPP     1     1             420           3656          10.25 2017-09-05 22:09:12
                                    420           3656          10.25 2017-09-05 23:09:12
FEX Control     1     0               5           4071           0.12 2017-09-05 22:09:12
                                      5           4071           0.12 2017-09-05 23:09:12

Egress Resources
-----------------------------------------------------------------------------------------
        Feature TCAM# BANK# Feature_Entries   Free_Entries   Percent_Util Timestamp (UTC)
-----------------------------------------------------------------------------------------

=========================================================================================
ACL TCAM Resource Utilization (Mod 3,Inst 4)
-----------------------------------------------------------------------------------------
                  Used    Free   Percent_Util          Timestamp (UTC)
-----------------------------------------------------------------------------------------
Tcam 0 Bank 0       24    4072           0.58      2017-09-05 22:09:12
                    24    4072           0.58      2017-09-05 23:09:12
Tcam 0 Bank 1       20    4076           0.48      2017-09-05 22:09:12
                    20    4076           0.48      2017-09-05 23:09:12
Tcam 1 Bank 0       25    4071           0.61      2017-09-05 22:09:12
                    25    4071           0.61      2017-09-05 23:09:12
Tcam 1 Bank 1      440    3656          10.74      2017-09-05 22:09:12
                   440    3656          10.74      2017-09-05 23:09:12

This example shows how to view iCAM monitoring of the FIB TCAM resources for a current date.

switch# show icam resource fib-tcam module 3 inst 5
====================================================================================
FIB TCAM Resource Utilization (Mod 3, Inst 5)
------------------------------------------------------------------------------------
          Type        logical       physical   Percent_Util          Timestamp (UTC)
------------------------------------------------------------------------------------
  IPV4 unicast             16             16           0.02      2017-09-05 22:09:19
       DIAG_80              1              1           0.00      2017-09-05 22:09:19
IPV4 multicast           5005           5005           7.82      2017-09-05 22:09:19
          MPLS              0              0           0.00      2017-09-05 22:09:19
      EOM Peer              0              0           0.00      2017-09-05 22:09:19
      MPLS VPN              0              0           0.00      2017-09-05 22:09:19
        FCMPLS              0              0           0.00      2017-09-05 22:09:19
          FCOE              0              0           0.00      2017-09-05 22:09:19
IPV6 LinkLocal              1              2           0.00      2017-09-05 22:09:19
  IPV6 unicast              4              8           0.01      2017-09-05 22:09:19
IPV6 multicast              5             20           0.03      2017-09-05 22:09:19


This example shows how to view the history of the FIB TCAM resources monitored by iCAM.

switch# show icam resource fib-tcam module 3 inst 5 history 2
====================================================================================
FIB TCAM Resource Utilization (Mod 3, Inst 5)
------------------------------------------------------------------------------------
          Type        logical       physical   Percent_Util          Timestamp (UTC)
------------------------------------------------------------------------------------
  IPV4 unicast             16             16           0.02      2017-09-05 22:17:14
                           16             16           0.02      2017-09-05 23:17:14
       DIAG_80              1              1           0.00      2017-09-05 22:17:14
                            1              1           0.00      2017-09-05 23:17:14
IPV4 multicast           5005           5005           7.82      2017-09-05 22:17:14
                         5005           5005           7.82      2017-09-05 23:17:14
          MPLS              0              0           0.00      2017-09-05 22:17:14
                            0              0           0.00      2017-09-05 23:17:14
      EOM Peer              0              0           0.00      2017-09-05 22:17:14
                            0              0           0.00      2017-09-05 23:17:14
      MPLS VPN              0              0           0.00      2017-09-05 22:17:14
                            0              0           0.00      2017-09-05 23:17:14
        FCMPLS              0              0           0.00      2017-09-05 22:17:14
                            0              0           0.00      2017-09-05 23:17:14
          FCOE              0              0           0.00      2017-09-05 22:17:14
                            0              0           0.00      2017-09-05 23:17:14
IPV6 LinkLocal              1              2           0.00      2017-09-05 22:17:14
                            1              2           0.00      2017-09-05 23:17:14
  IPV6 unicast              4              8           0.01      2017-09-05 22:17:14
                            4              8           0.01      2017-09-05 23:17:14
IPV6 multicast              5             20           0.03      2017-09-05 22:17:14
                            5             20           0.03      2017-09-05 23:17:14


This example shows how to view the history of the FIB TCAM resources monitored by iCAM.

switch# show icam resource fib-tcam module 3 inst 5 history 4
====================================================================================
FIB TCAM Resource Utilization (Mod 3, Inst 5)
------------------------------------------------------------------------------------
          Type        logical       physical   Percent_Util          Timestamp (UTC)
------------------------------------------------------------------------------------
  IPV4 unicast             16             16           0.02      2017-09-05 22:13:13
                           16             16           0.02      2017-09-05 23:13:13
                           16             16           0.02      2017-09-06 00:13:14
                           16             16           0.02      2017-09-06 01:13:14
       DIAG_80              1              1           0.00      2017-09-05 22:13:13
                            1              1           0.00      2017-09-05 23:13:13
                            1              1           0.00      2017-09-06 00:13:14
                            1              1           0.00      2017-09-06 01:13:14
 IV4 multicast           5005           5005           7.82      2017-09-05 22:13:13
                         5005           5005           7.82      2017-09-05 23:13:13
                         5005           5005           7.82      2017-09-06 00:13:14
                         5005           5005           7.82      2017-09-06 01:13:14
          MPLS              0              0           0.00      2017-09-05 22:13:13
                            0              0           0.00      2017-09-05 23:13:13
                            0              0           0.00      2017-09-06 00:13:14
                            0              0           0.00      2017-09-06 01:13:14
      EOM Peer              0              0           0.00      2017-09-05 22:13:13
                            0              0           0.00      2017-09-05 23:13:13
                            0              0           0.00      2017-09-06 00:13:14
                            0              0           0.00      2017-09-06 01:13:14
      MPLS VPN              0              0           0.00      2017-09-05 22:13:13
                            0              0           0.00      2017-09-05 23:13:13
                            0              0           0.00      2017-09-06 00:13:14
                            0              0           0.00      2017-09-06 01:13:14
        FCMPLS              0              0           0.00      2017-09-05 22:13:13
                            0              0           0.00      2017-09-05 23:13:13
                            0              0           0.00      2017-09-06 00:13:14
                            0              0           0.00      2017-09-06 01:13:14
          FCOE              0              0           0.00      2017-09-05 22:13:13
                            0              0           0.00      2017-09-05 23:13:13
                            0              0           0.00      2017-09-06 00:13:14
                            0              0           0.00      2017-09-06 01:13:14
IPV6 LinkLocal              1              2           0.00      2017-09-05 22:13:13
                            1              2           0.00      2017-09-05 23:13:13
                            1              2           0.00      2017-09-06 00:13:14
                            1              2           0.00      2017-09-06 01:13:14
  IPV6 unicast              4              8           0.01      2017-09-05 22:13:13
                            4              8           0.01      2017-09-05 23:13:13
                            4              8           0.01      2017-09-06 00:13:14
                            4              8           0.01      2017-09-06 01:13:14
IPV6 multicast              5             20           0.03      2017-09-05 22:13:13
                            5             20           0.03      2017-09-05 23:13:13
                            5             20           0.03      2017-09-06 00:13:14
                            5             20           0.03      2017-09-06 01:13:14


This example displays the predictive analytics of the ACL TCAM resources.

switch# show icam prediction resource acl-tcam module 3 inst 4 2018 Jan 27 11:35:30
Generating predictions, this may take some time ...

---------------------------------------------------------------------------------------------
Feature Hardware Resource Prediction (Mod 3,Inst 4)
---------------------------------------------------------------------------------------------
---------------------------------------------------------------------------------------------
        Feature   Direction   TCAM#   BANK#   Feature_Entries    Free_Entries    Percent_Util
---------------------------------------------------------------------------------------------
           PACL     ingress       0       0                 4            4072            0.00
    FEX Control     ingress       1       0                 5            4071            0.00
           CoPP     ingress       1       1               420            3656           10.00

=============================================================================================
ACL TCAM Resource Prediction (Mod 3,Inst 4)
---------------------------------------------------------------------------------------------
                  Used    Free   Percent_Util
---------------------------------------------------------------------------------------------
Tcam 1 Bank 1      440    3656          10.74
Tcam 1 Bank 0       25    4071           0.61
Tcam 0 Bank 1       20    4076           0.48
Tcam 0 Bank 0       24    4072           0.58

This example displays the predictive analytics of the FIB TCAM resources.

switch# show icam prediction resource fib-tcam module 3 inst 5 2025 Dec 20 10:20:37
Generating predictions, this may take some time ...

============================================================
 FIB TCAM Resource Prediction (Mod 3, Inst 5)
------------------------------------------------------------
           Type        logical       physical   Percent_Util
------------------------------------------------------------
         FCMPLS              0              0           0.00
   IPV4 unicast             16             16           0.00
        DIAG_80              1              1           0.00
       EOM Peer              0              0           0.00
           MPLS              0              0           0.00
 IPV6 multicast              5             20           0.00
 IPV6 LinkLocal              1              2           0.00
           FCOE              0              0           0.00
       MPLS VPN              0              0           0.00
 IPV4 multicast           5005           5005           7.00
   IPV6 unicast              4              8           0.00

Example: Obtaining JSON Outputs for iCAM Configurations

This example shows how to view top 1% TCAM entries for a current date in JSON format.

switch# show icam entries acl module 5 inst 0 sort top 1 | json
{"module": 5,
"instance": 0,
"TABLE_ACL_entries": {
 "ROW_ACL_entries": [
  {
   "Feature": "QoS COPP",
   "Pkt_Type": "IPv4",
   "SourceIP_Mask_DestIP_Mask": "ip 0.0.0.0/0 0.0.0.0/0",
   "Action": "QoS",
   "ifindex": "0x0"
   "Stats": 2637573806
  },
  {
   "Feature": "RACL",
   "Pkt_Type": "IPv4",
   "SourceIP_Mask_DestIP_Mask": "ip 209.165.201.1/27 209.165.201.2/27",
   "Action": "Permit",
   "ifindex": "0x1a200000"
   "Stats": 1247078657
  },
  {
   "Feature": "QoS COPP",
   "Pkt_Type": "IPv4",
   "SourceIP_Mask_DestIP_Mask": "ip 0.0.0.0/0 0.0.0.0/0",
   "Action": "QoS",
   "ifindex": "0x0"
   "Stats": 745341269
  },
  {
   "Feature": "RACL",
   "Pkt_Type": "IPv4",
   "SourceIP_Mask_DestIP_Mask": "ip 209.165.201.3/27 209.165.201.4/27",
   "Action": "Permit",
   "ifindex": "0x1a200000"
   "Stats": 745341269
  }
 ]
}
}

This example shows how to view top 10% multicast entries for a current date in JSON format.

switch# show icam entries multicast module 5 sort top 10 | json
{
 "module": 5,
 "TABLE_MULTICAST_entries": {
  "ROW_ACL_entries": {
   "Vdc": 1,
   "Table_Id": 1,
   "Source_Mask": "209.165.201.18/27",
   "Group_Mask": "209.165.201.10/27",
   "Rpf": "Ethernet5/2"
   "Stats": 5318470244
  }
 }
}

This example shows how to view iCAM monitoring of the ACL TCAM resources for a current date in JSON format.

switch# show icam resource acl_tcam module 5 inst 0 | json
{
  "module": 5,
  "instance": 0,
  "TABLE_feature_resource": {
   "ROW_feature_resource": [
    {
     "Feature": "CoPP",
     "TCAM": 1,
     "BANK": 1,
      "TABLE_ingress_stats": {
       "ROW_ingress_stats": {
        "Feature_Entries": 442,
        "Free_Entries": 32306,
        "Percent_Util": 1.34,
        "Timestamp": "2017-08-09 14:36:19"
        }
       }
      },
     {
     "Feature": "FEX Control",
     "TCAM": 1,
     "BANK": 0,
      "TABLE_ingress_stats": {
       "ROW_ingress_stats": {
        "Feature_Entries": 5,
        "Free_Entries": 32733,
        "Percent_Util": 0.01,
        "Timestamp": "2017-08-09 14:36:19"
        }
       }
      },
    {
     "Feature": "RACL",
     "TCAM": 1,
     "BANK": 0,
      "TABLE_ingress_stats": {
       "ROW_ingress_stats": {
        "Feature_Entries": 10,
        "Free_Entries": 32733,
        "Percent_Util": 0.03,
        "Timestamp": "2017-08-09 14:36:19"
        }
       }
      }
     ]
    },
   "mod": 5,
   "inst": 0,
   "TABLE_tcam_bank_utilization": {
    "ROW_tcam_bank_utilization": {
     {
      "Tcam_no": "Tcam 0",
      "Bank_no": "Bank 0",
      "TABLE_tcam_bank_stats": {
       "ROW_tcam_bank_stats": {
        "Used": 20,
        "Free": 32748,
        "Percent_Util": 0.06,
        "Timestamp": "2017-08-09 14:36:19"
       }
      }
     },
     {
      "Tcam_no": "Tcam 0",
      "Bank_no": "Bank 1",
      "TABLE_tcam_bank_stats": {
       "ROW_tcam_bank_stats": {
        "Used": 20,
        "Free": 32748,
        "Percent_Util": 0.06,
        "Timestamp": "2017-08-09 14:36:19"
       }
      }
     },
     {
      "Tcam_no": "Tcam 1",
      "Bank_no": "Bank 0",
      "TABLE_tcam_bank_stats": {
       "ROW_tcam_bank_stats": {
        "Used": 35,
        "Free": 32733,
        "Percent_Util": 0.1,
        "Timestamp": "2017-08-09 14:36:19"
       }
      }
     },
     {
      "Tcam_no": "Tcam 1",
      "Bank_no": "Bank 1",
      "TABLE_tcam_bank_stats": {
       "ROW_tcam_bank_stats": {
        "Used": 462,
        "Free": 32306,
        "Percent_Util": 1.4,
        "Timestamp": "2017-08-09 14:36:19"
       }
      }
     }
   ]
  }
}

This example shows how to view iCAM monitoring of the FIB TCAM resources for a current date in JSON format.

switch# show icam resource fib_tcam module 5 inst 0 | json
 {
  "module": 5,
  "instance": 0,
  "TABLE_fib_resource": {
   "ROW_fib_resource": [
    {
     "Class": "IPv4 unicast",
     "TABLE_fib_stats": {
     "ROW_fib_stats": {
      "Log_Entries": 16,
      "Phy_Entries": 16,
      "Percent_Util": 0.0,
      "Timestamp": "2017-08-09 14:37:59"
     }
    }
   },
  {
     "Class": "DIAG_80",
     "TABLE_fib_stats": {
     "ROW_fib_stats": {
      "Log_Entries": 0,
      "Phy_Entries": 0,
      "Percent_Util": 0.0,
      "Timestamp": "2017-08-09 14:37:59"
     }
    }
   },
   {
     "Class": "IPv4 unicast",
     "TABLE_fib_stats": {
     "ROW_fib_stats": {
      "Log_Entries": 6,
      "Phy_Entries": 6,
      "Percent_Util": 0.0,
      "Timestamp": "2017-08-09 14:37:59"
     }
    }
   }
  ]
 }
}

Additional References for iCAM

Related Documents

Related Topic Document Title
Command Reference Cisco Nexus 7000 Series NX-OS System Management Command Reference