Distributed Packet Tracer

This chapter describes how to configure the Distributed Packet Tracer (DPT) feature using the CLIs.

This chapter contains the following sections:

Finding Feature Information

Your software release might not support all the features documented in this module. For the latest caveats and feature information, see the Bug Search Tool at https://tools.cisco.com/bugsearch/ and the release notes for your software release. To find information about the features documented in this module, and to see a list of the releases in which each feature is supported, see the “New and Changed Information” section or the "Feature History" table.

Feature History for Distributed Packet Tracer

This table lists the release history for this feature.

Table 1. Feature History for Distributed Packet Tracer

Feature Name

Releases

Feature Information

Distributed Packet Tracer (DPT)

8.2(1)

This feature was introduced.

Information About Distributed Packet Tracer

Distributed Packet Tracer (DPT) is a utility integrated within Cisco Nexus 7000/7700 platforms that can be used to trace the path of the packet through the switch. DPT can be invoked using the command line or remotely using NX-API/JSON/XML and can be configured to match specific traffic flows.

DPT provides information about flows traversing through the switch and the results of forwarding decisions for identified flows such as- forward and drop.

Benefits of Distributed Packet Tracer

  • Provides the possibility to execute from single point over NXAPI.
  • Data Path traffic capture happens without the need to know internal architecture.
  • Scheduled start and stop of a packet capture allows simultaneous start/stop on multiple devices.
  • Decoding switch forwarding decision such as:
    • destination interface, VLAN
    • forward, drop
    • unicast, multi-destination (unknown-unicast, multicast, broadcast)

Supported Distributed Packet Tracer Configuration

Supported Hardware

DPT supports M3 and F3 series modules in Cisco NX-OS Release 8.2(1).

DPT supports only the below modules:

  • N7K-M3xxx
  • N77-M3xxx
  • N7K-F3xxx
  • N77-F3xxx

Supported Flow Filters

In Cisco NXOS Release 8.2(1) and in Cisco NX-OS Release 8.3(1), DPT implementation supports only the below filters:

  • Classic Ethernet
    • L2 SRC/DST MAC
    • L3 SRC/DST IPv4, IPv6 address
    • IP protocol
    • VLAN

The above listed filters are supported on the FabricPath network (this does not include DFA), however filtering based on FTAG and FP TTL are not supported.

IP packet encapsulated in plain FabricPath header (this does not include DFA) is supported.

Only outer header filtering is supported. VXLAN/OTV/GRE inner IPv4/IPv6 filters are not supported. Filtering of MPLS encapsulated packets is not supported.

Configuration

DPT can be configured by:

  • NXOS CLI
  • NXAPI JSON
  • NXAPI XML

You use the setup utility mainly for configuring the system initially, when no configuration is present. However, you can use the setup utility at any time for basic device configuration. The setup utility keeps the configured values when you skip steps in the script. For example, if you have already configured the mgmt0 interface, the setup utility does not change that configuration if you skip that step. However, if there is a default value for the step, the setup utility changes to the configuration using that default, not the configured value. Be sure to carefully check the configuration changes before you save the configuration.

Restrictions for Distributed Packet Tracer

Unsupported Hardware

In case of mixed chassis with supported and unsupported modules, DPT provides result only from the supported modules.

Timestamp

Timestamp presented in result CLI does not necessarily match the exact time when a packet arrives on the device. DPT checks hardware tables at specific intervals (default is 30 seconds). Therefore timestamp can be shifted by 30 seconds in comparison to actual time of packet arrival. Timestamp always references to local switch time.

Packet Count

Due to hardware limitations DPT can show only if the flow is present or not but it cannot count the number of packets transferred in the interval. If a specific flow is presented, packet count always shows one packet regardless of the number of packets sent through the switch.

Platform Limitations

DPT is mutually exclusive with ELAM feature. Any ELAM configuration will be overwritten by DPT and also manual ELAM execution can overwrite the applied DPT configuration. It is recommended not to use both features (DPT and ELAM) for troubleshooting at the same time because it provides incorrect results.

A few limitations can affect the accuracy of DPT due to the hardware architecture. When DPT does not capture traffic it does not mean that the packet did not arrive on the destination switch. There are chances that not all packets are received or forwarded.

The following scenarios/factors could occur due to the limitations impacting DPT:
  • Packet drops that occur inside packet buffers (ingress/egress/fabric) are not reflected in the final result. For example:

    • Packet drops in egress buffers (due to congestion) are shown as forwarded in the DPT.
    • Packet drops in ingress VOQ buffer (due to egress congestion) are shown as forwarded in the DPT.
  • Decisions on egress forwarding ASIC are not reflected in the DPT. For example

    • Packet drops in egress PACL are shown in the DPT as forwarded. However, egress VACL is correctly shown as DROP since that decision happens in ingress ASIC.
    • Packets sent from CPU are not captured by the DPT. Only egress ASIC sees the outbound CPU packets.

  • Current filtering capability supports only outer IP header filtering (packet encapsulated by OTV, VXLAN, GRE or DFA cannot be captured), any filter on MPLS encapsulated packets are not supported.
  • The DPT flows that are created, their results and status are not persistent and is cleared upon SSO or upon the reload. All the created flows are cleared and need to be created and started again. Scheduled flow needs to be rescheduled.

How To Use The Distributed Packet Tracer

This section describes the standard workflow of Distributed Packet Tracer (DPT) usage.

To use DPT, feature dpt needs to be enabled in global configuration mode. Other commands are executed from the privilege EXEC mode.

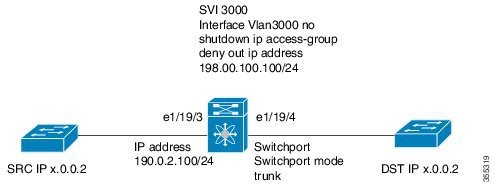
Figure 1. Reference Topology for DPT

Configure and Start the DPT capture

Procedure


Step 1

Enable the DPT feature.

Example:


 Device(config)#feature dpt
Device(config)#
Device#
Device# show dpt ?
  flow     DPT flow
  results  Show results
  status   Status
Device#


Step 2

Create a flow; for example with a flow name, "first-flow" with a specific filter.

Example:


Device#dpt create flow first-flow src-ipv4 192.0.2.100 dst-ipv4 x.0.0.2
        
Flow first-flow created and in initialized status
Device#
Device# show dpt flow first-flow
----------------------------------------
ID: first-flow
Status: initialized
Definition:
  network-type classical-ethernet src-ipv4 192.0.2.100/32 dst-ipv4 x.0.0.2/32
 ---- System Admin Account Setup ----


Maximum of 10 flow definitions can be created. Capture is performed only on the ingress side.

After the creation flow status is in initialized status. This means that the flow is created in the supervisor database; however it is not installed in hardware. Multiple flows can be created.

It is recommended to use specific filters as much as possible; for example, use VLAN to capture traffic between layer 2 interfaces or in the fabric path network.

Step 3

Apply the newly created flow to the hardware.

Example:


Device#dpt apply flow first-flow 

Flow first-flow applied and in configured status 
Device# show dpt  flow first-flow
----------------------------------------
ID: first-flow
Status: configured
Definition:
  network-type classical-ethernet src-ipv4 192.168.208.109/32 dst-ipv4 50.0.0.2/3

Device# show dpt status flow first-flow
------------------------------------------------------------------------------------------------------------------------
Flow                 Statistics Lookup-result  Status       Start-time            End-time              Interval Detail         
------------------------------------------------------------------------------------------------------------------------
first-flow         n/a        n/a              configured                          

In the above example, flow has been installed in the hardware ASIC but result collection has not started. The state is similar to the ELAM when the trigger has been configured.

You can apply only one flow at a time in the hardware. You must release the old flow before applying a new flow.

Step 4

Start the flow capture.

Example:


Device#dpt start flow first-flow interval 10

Flow first-flow started and in armed status
Device# show dpt flow first-flow
----------------------------------------
ID: first-flow
Status: armed
Definition:
  network-type classical-ethernet src-ipv4 192.168.208.109/32 dst-ipv4 50.0.0.2/32

Device# 
Device# show dpt status flow all
------------------------------------------------------------------------------------------------------------------------
Flow                 Statistics Lookup-result  Status       Start-time            End-time              Interval Detail          
------------------------------------------------------------------------------------------------------------------------
first-flow           n/a        n/a            armed        2017-09-05 06:06:19     
								    2017-09-05 10:06:19   10                    
Device#  


DPT collects the results once the flow is started. Flow start and stop time can be specified in absolute calendar values or delay seconds from the current time.

In above example, the results collection happens in 10 second interval. The default results collection interval is 30 seconds, if not specified in the command. The capture time is limited to 4 hours by default from the start time, if not specified in the command. You must specify the start and end time if you need to run the capture for a longer time.


Device#dpt start flow first-flow start-time seconds 30 end-time 23:00:00 10 
September 2017
Device# 
Flow first-flow scheduled with start time

Device# show dpt flow first-flow
----------------------------------------
ID: first-flow
Status: armed
Definition: network-type classical-ethernet src-ipv4 192.168.208.109/32 dst-ipv4 50.0.0.2/32

Device# show dpt status flow first-flow

------------------------------------------------------------------------------------------------------------------------
Flow                 Statistics Lookup-result  Status       Start-time            End-time              Interval Detail         
------------------------------------------------------------------------------------------------------------------------
first-flow           n/a        n/a            armed        2017-09-05 06:12:15   2017-09-05 10:12:15   10 
You can apply only one flow at a time in hardware. You must stop and release the already captured flow before applying a new flow.

Show Capture Results

Procedure

  Command or Action Purpose

Step 1

Verify if the flow is started/armed.

Example:

Device# show dpt status flow all
------------------------------------------------------------------------------------------------------------------------
Flow                 Statistics Lookup-result  Status       Start-time            End-time              Interval Detail          
------------------------------------------------------------------------------------------------------------------------
first-flow           n/a        n/a            armed        2017-09-05 11:44:30  2017-09-05 15:44:30   10 

Step 2

Verify the capture results.

Example:

Device# show dpt result flow first-flow


Flow ID: first-flow   Start-time [2017-09-05 11:52:20]  End-time [2017-09-05 15:52:20]  Interval [10]

Idx  |Result|Drop  |      Timestamp       |Input                                                   |Output                    
     |      |reason|                      |interface            |Vlan  |BD    |VNI   |Rate  |Count |interface            |Vlan  |BD    |VNI   |Rate  |Count 
------------------------------------------------------------------------------------------------------------------------------------------------------------
2      fwd    n/a   2017-09-05 11:53:00    Ethernet1/19/4        3000    n/a    n/a    n/a   1      Ethernet1/19/3        0       n/a    n/a    n/a   1     
1      fwd    n/a   2017-09-05 11:52:50    Ethernet1/19/4        3000    n/a    n/a    n/a   1      Ethernet1/19/3        0       n/a    n/a    n/a   1     
0      fwd    n/a   2017-09-05 11:52:40    Ethernet1/19/4        3000    n/a    n/a    n/a   1      Ethernet1/19/3        0       n/a    n/a    n/a   1        

Results are collected in 10 seconds interval; maximum 180 results are stored per flow.

When DPT cannot decode a result it will show as "n/a".

These results support XML/JSON format. DPT also supports NXAPI for remote execution from NMS.

Step 3

Verify the detailed results.

Example:

Device# show dpt results flow first-flow detail


---------------------------------------------------
Result details for flow ID: first-flow
---------------------------------------------------
Index                       1
Timestamp                   2017-09-21 22:21:55
Source Interface            Ethernet1/30
Source MAC address          6c20.56e8.4f3c
Source IP address           x.1.1.2

Destination Interface       Ethernet2/11
Destination MAC address     0026.51c7.fcc1
Destination IP address      x.1.1.1

IP Protocol                 1
Source L4 port              0
Destination L4 port         0
Source Vlan ID              133
Destination Vlan ID         133
Source Bridge Domain        n/a
Destination Bridge Domain   n/a
Source VNI                  n/a
Destination VNI             n/a

---------------------------------------------------
Index                       0
Timestamp                   2017-09-21 22:21:25
Source Interface            Ethernet1/30
Source MAC address          6c20.56e8.4f3c
Source IP address           x.1.1.2

Destination Interface       Ethernet2/11
Destination MAC address     0026.51c7.fcc1
Destination IP address      x.1.1.1

IP Protocol                 1
Source L4 port              0
Destination L4 port         0
Source Vlan ID              133
Destination Vlan ID         133
Source Bridge Domain        n/a
Destination Bridge Domain   n/a
Source VNI                  n/a
Destination VNI             n/a


Stop and Release the Capture

Procedure
  Command or Action Purpose

Step 1

Stop the flow.

Example:
Device# dpt stop flow first-flow
Flow first-flow stopped and in configured status
Device# show dpt status flow all
------------------------------------------------------------------------------------------------------------------------
Flow                 Statistics Lookup-result  Status       Start-time            End-time              Interval Detail          
------------------------------------------------------------------------------------------------------------------------
first-flow           n/a        n/a            configured
Results are not cleared when the flow capture is stopped.

Step 2

Release the flow.

Example:
Device# dpt release flow first-flow

Flow first-flow released and in initialized status
Device#  

Results are not cleared when the flow capture is released.

Step 3

Delete the flow.

Example:
Device# dpt delete flow first-flow

Flow first-flow deleted
Device#

Deleting the flow will delete all the results.

Configuration Example for the Distributed Packet Tracer

Example: Multi-destination Result

The following example shows the shows the multi-destination case (unknown-unicast, multicast, and broadcast).


Device# show dpt result flow first-flow
------------------------------------------------------------------------------------------------------------------------------------------------------------
Flow ID: first-flow   Start-time [2017-09-05 11:52:20]  End-time [2017-09-05 15:52:20]  Interval [10]
------------------------------------------------------------------------------------------------------------------------------------------------------------
Idx  |Result|Drop  |      Timestamp       |Input                                                   |Output                    
     |      |reason|                      |interface            |Vlan  |BD    |VNI   |Rate  |Count |interface              |Vlan  |BD    |VNI   |Rate  |Count 
------------------------------------------------------------------------------------------------------------------------------------------------------------
1     fwd    n/a    2017-08-24 14:04:25    Ethernet1/19/3        0       n/a    n/a    n/a   1      multi-dest LTL_0xc019   3000    n/a    n/a    n/a   1     


In this example, the output interfaces are not listed as the traffic is forwarded to multiple destination ports; only the internal port index (LTL) is specified.

The following example provides a list of specific interfaces:


Device# show system internal pixm info ltl 0xc019

LTL      res_id          ltl_flag        cb_flag         MI[0]
0xc019   0x00000000      0x00000000      0x00000000      0x0fff

Member info
------------------
IFIDX           LTL
---------------------------------
Eth101/1/8         0x252c
Eth101/1/14        0x2532
Eth101/1/2         0x2526
Eth101/1/4         0x2528
...
Po101              0x0e00
Eth102/1/2         0x2586
Eth102/1/7         0x258b
Eth1/19/4          0x0bde
Eth102/1/8         0x258c
Eth102/1/9         0x258d


Example: Drop Result

The following example shows the drop result when the traffic is dropped by the egress VACL on SVI 3000.

Device# show dpt result flow first-flow 
-----------------------------------------------------------------------------
Flow ID: first-flow   Start-time [2017-09-05 11:52:20]  End-time [2017-09-05 15:52:20]  Interval [10]
-----------------------------------------------------------------------------------------------------------------------------------------
Idx  |Result|Drop  |      Timestamp       |Input                                                   |Output                    
     |      |reason|                      |interface            |Vlan  |BD    |VNI   |Rate  |Count |interface              |Vlan  |BD    |VNI   |Rate  |Count 
-----------------------------------------------------------------------------------------------------------------------------------------
1     drop   n/a   2017-08-24 14:04:25    Ethernet1/19/3        0       n/a    n/a    n/a   1       Drop LTL:0xcad          3000    n/a    n/a    n/a   1     

Drop reason decode is not supported in Cisco NX-OS Release 8.2(1). Perform a manual traffic forwarding result analysis to determine the exact drop reason with the assistance of Cisco TAC.

Example: Unknown Result

In corner cases DPT might not be able to identify if packet has been forwarded or dropped. In such a case the result status has "n/a" field and the output interface has the destination LTL index. For these cases, additional manual traffic analysis is required with the assistance of Cisco TAC.

Device# show dpt result flow first-flow 

-----------------------------------------------------------------------------
Flow ID: first-flow   Start-time [2017-09-05 11:52:20]  End-time [2017-09-05 15:52:20]  Interval [10]
-----------------------------------------------------------------------------------------------------------------------------------------
Idx  |Result|Drop  |      Timestamp       |Input                                                   |Output                    
     |      |reason|                      |interface            |Vlan  |BD    |VNI   |Rate  |Count |interface              |Vlan  |BD    |VNI   |Rate  |Count 
-----------------------------------------------------------------------------------------------------------------------------------------
1     n/a   n/a   2017-08-24 14:04:25    Ethernet1/19/3        0       n/a    n/a    n/a   1        LTL_0xccc          3000    n/a    n/a    n/a   1     
   

Drop reason decode is not supported in Cisco NX-OS Release 8.2(1). Perform a manual traffic forwarding result analysis to determine the exact drop reason with the assistance of Cisco TAC.