
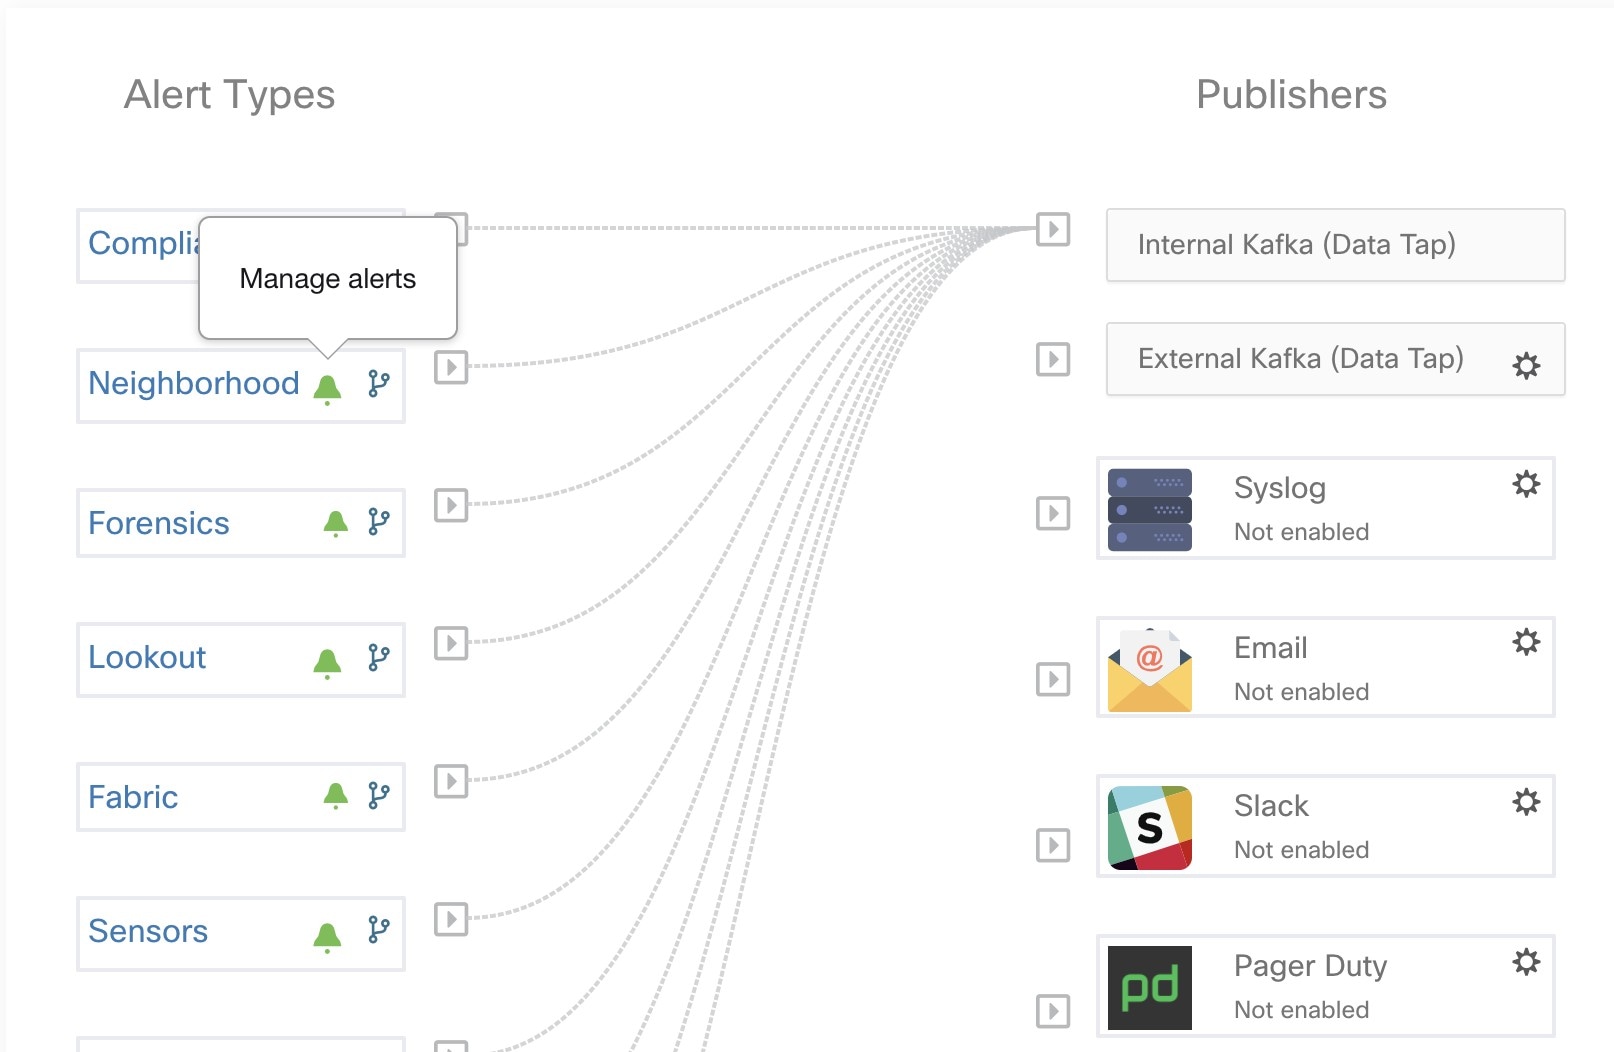
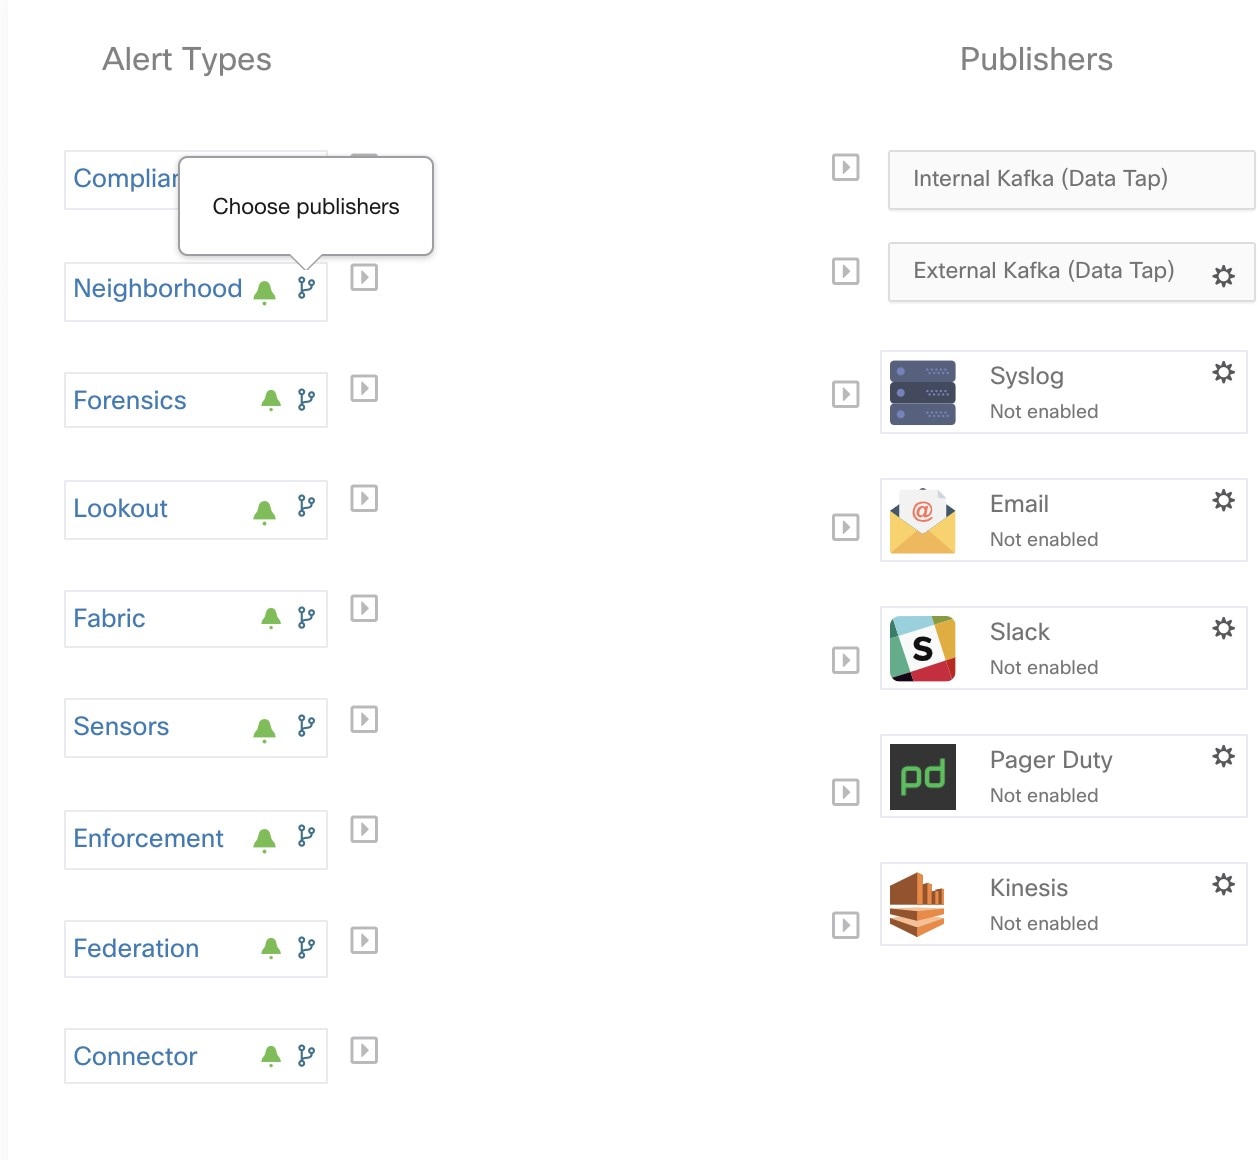
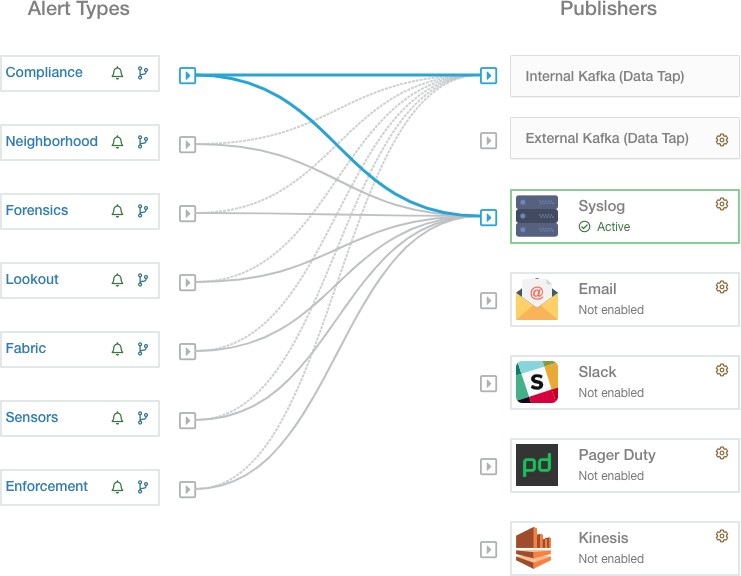
Alert Types and Publishers
Alerts in Secure Workload consist of the following components:
-
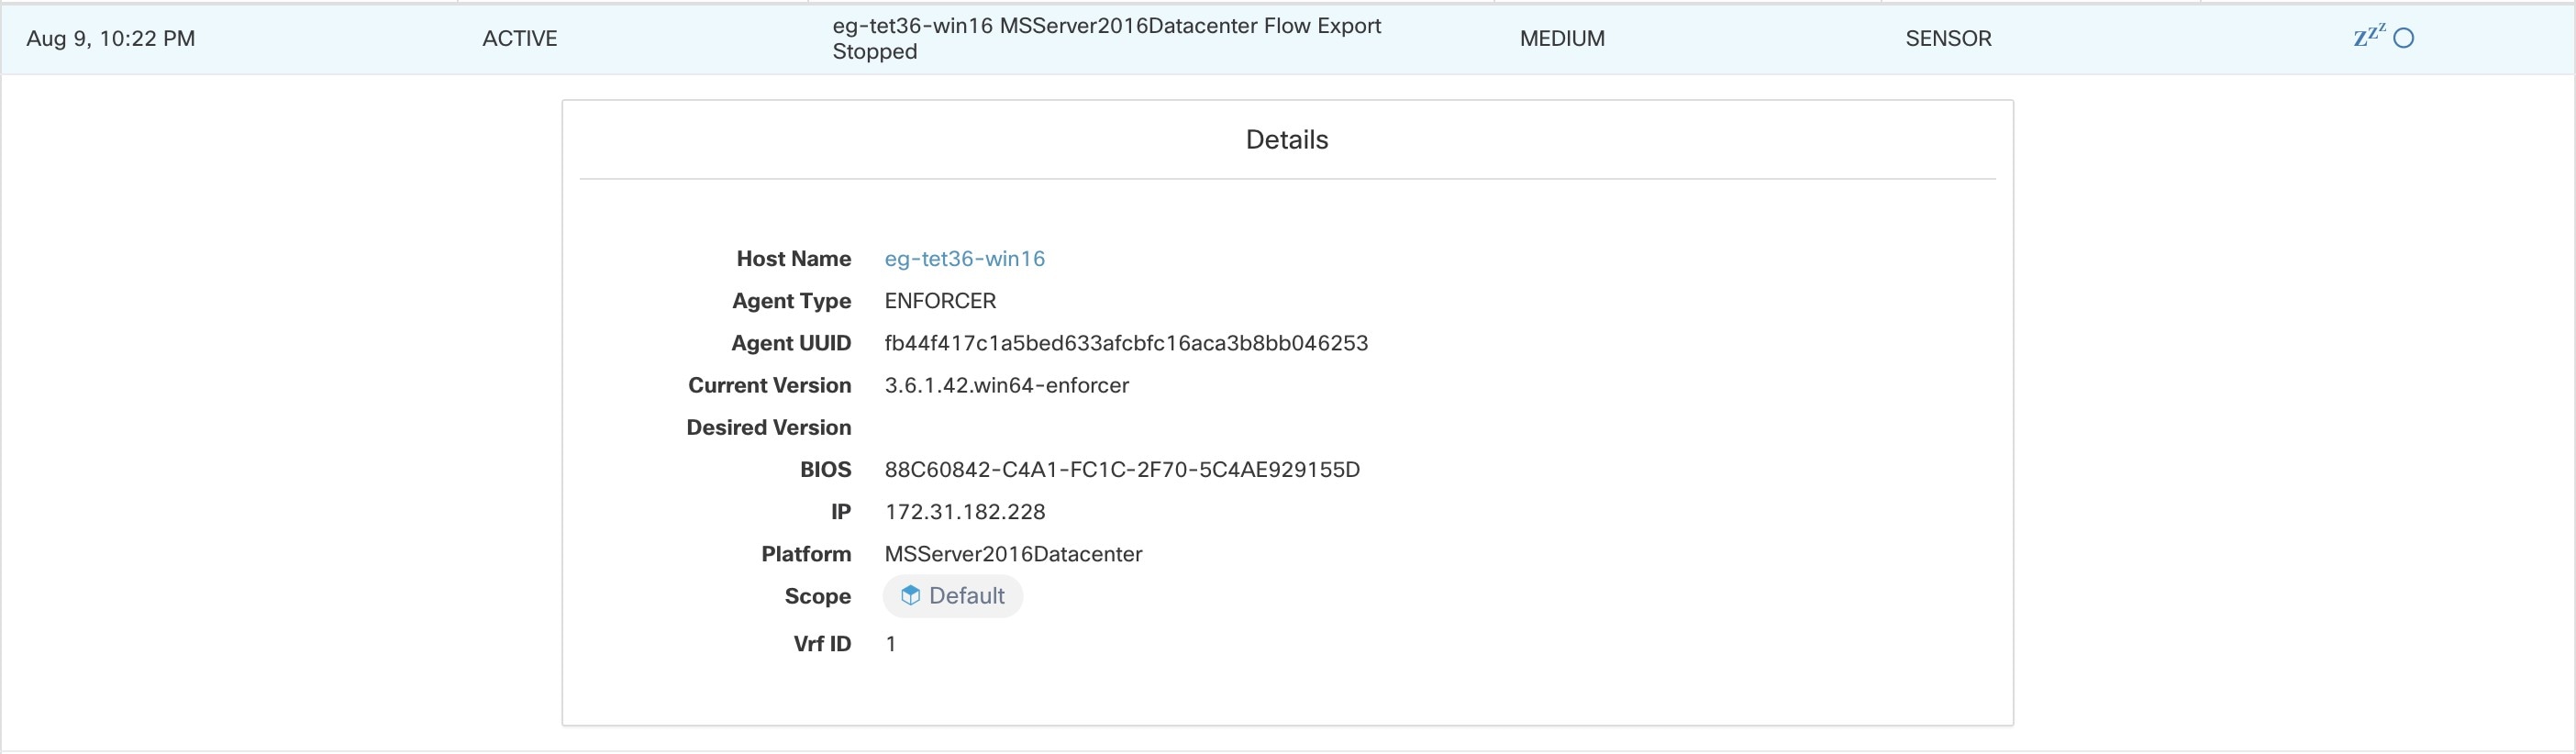
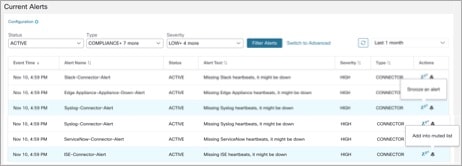
Alert Visibility:
-
Current Alerts: Navigate to . Preview of alerts sent to a Data Tap is available.
-
-
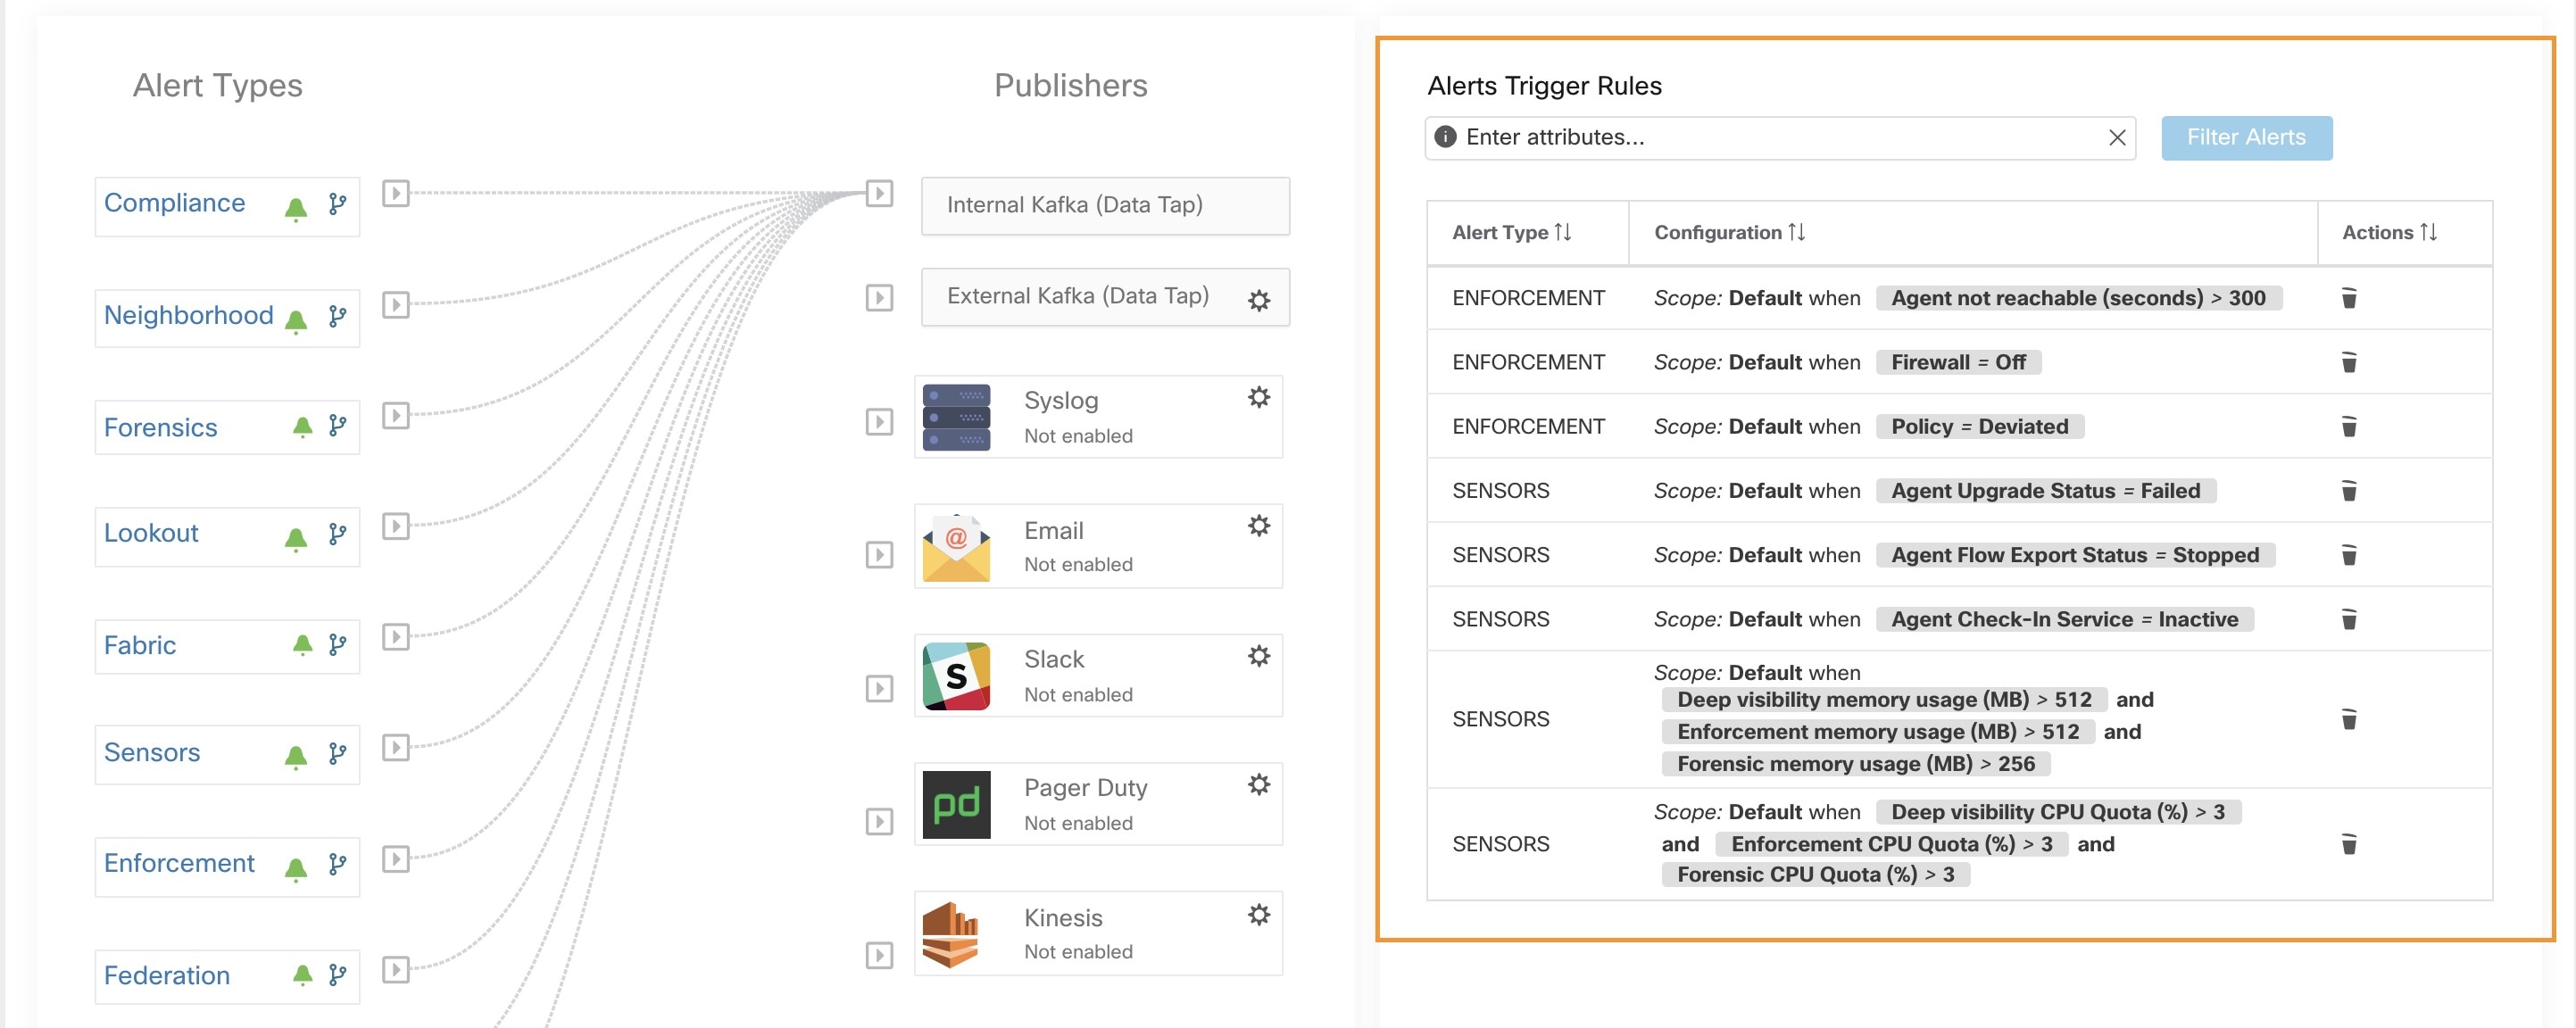
Alert Sources and Configuration:
-
Alerts - Configuration: Navigate to . Both alert configurations that are configured using the common modal and alert publisher, and notifier settings are displayed.
-
-
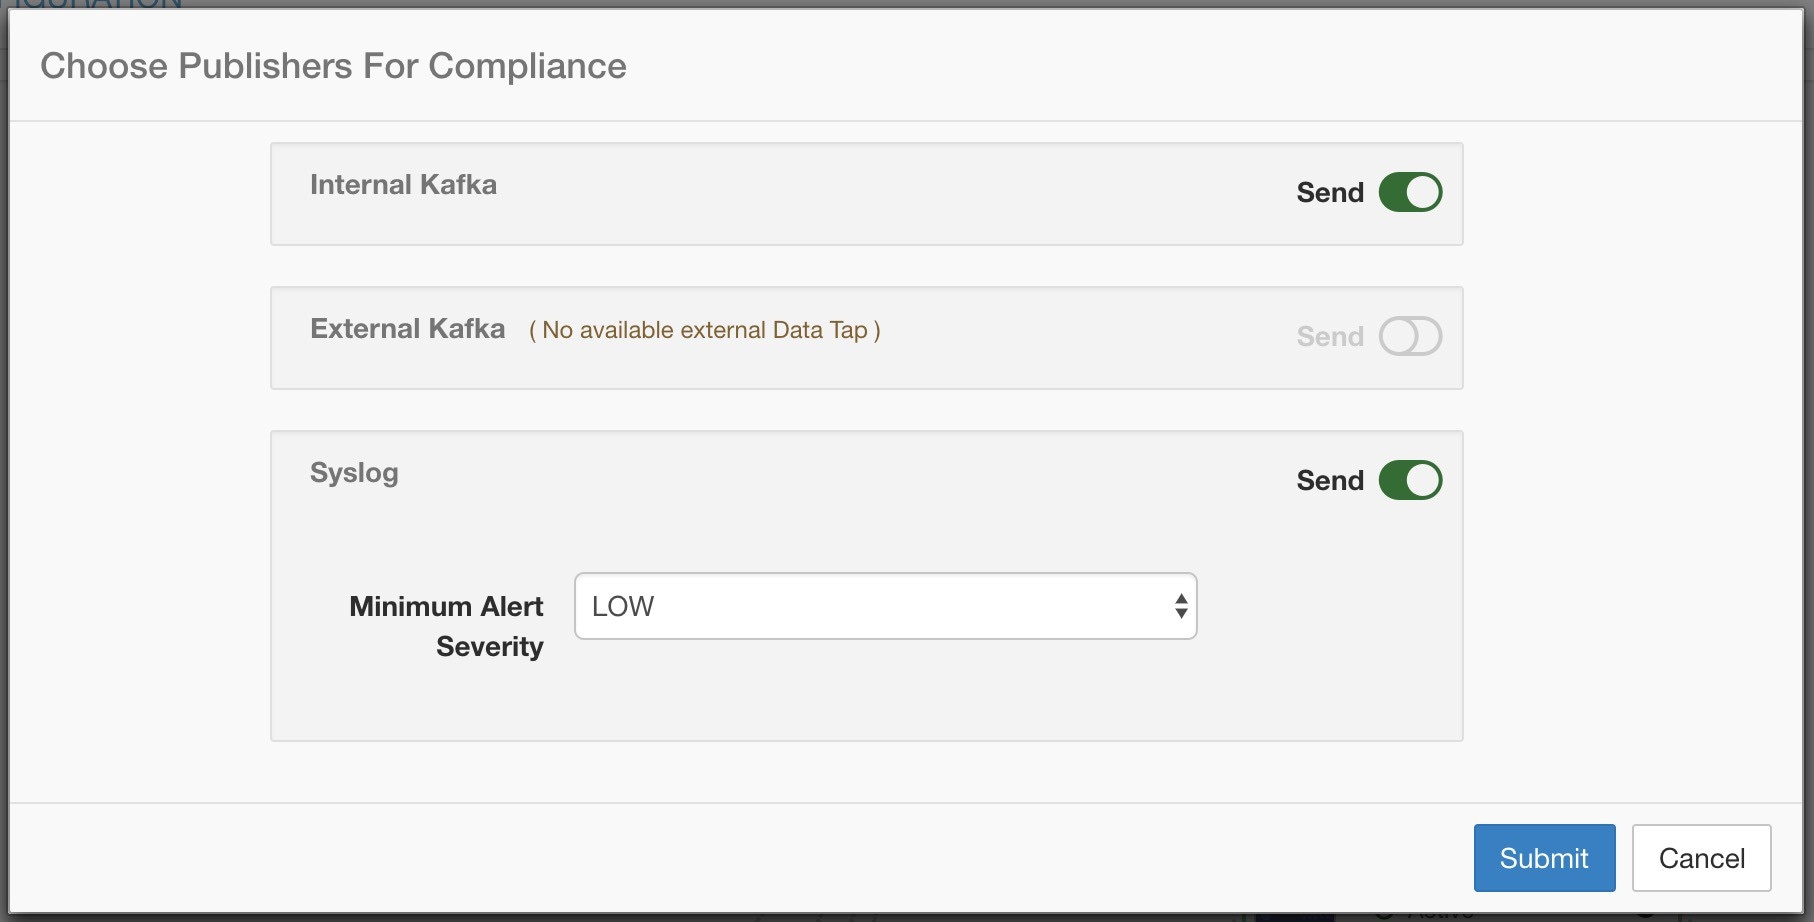
Send Alerts:
-
Alerts App: An implicit Secure Workload app that sends generated alerts to a configured Data Tap. The Alerts App handles features such as Snooze and Mute.
-
Alerts Publisher: Limits the number of alerts that are displayed and pushes alerts to Kafka (MDT or DataTap) for external consumption.
-
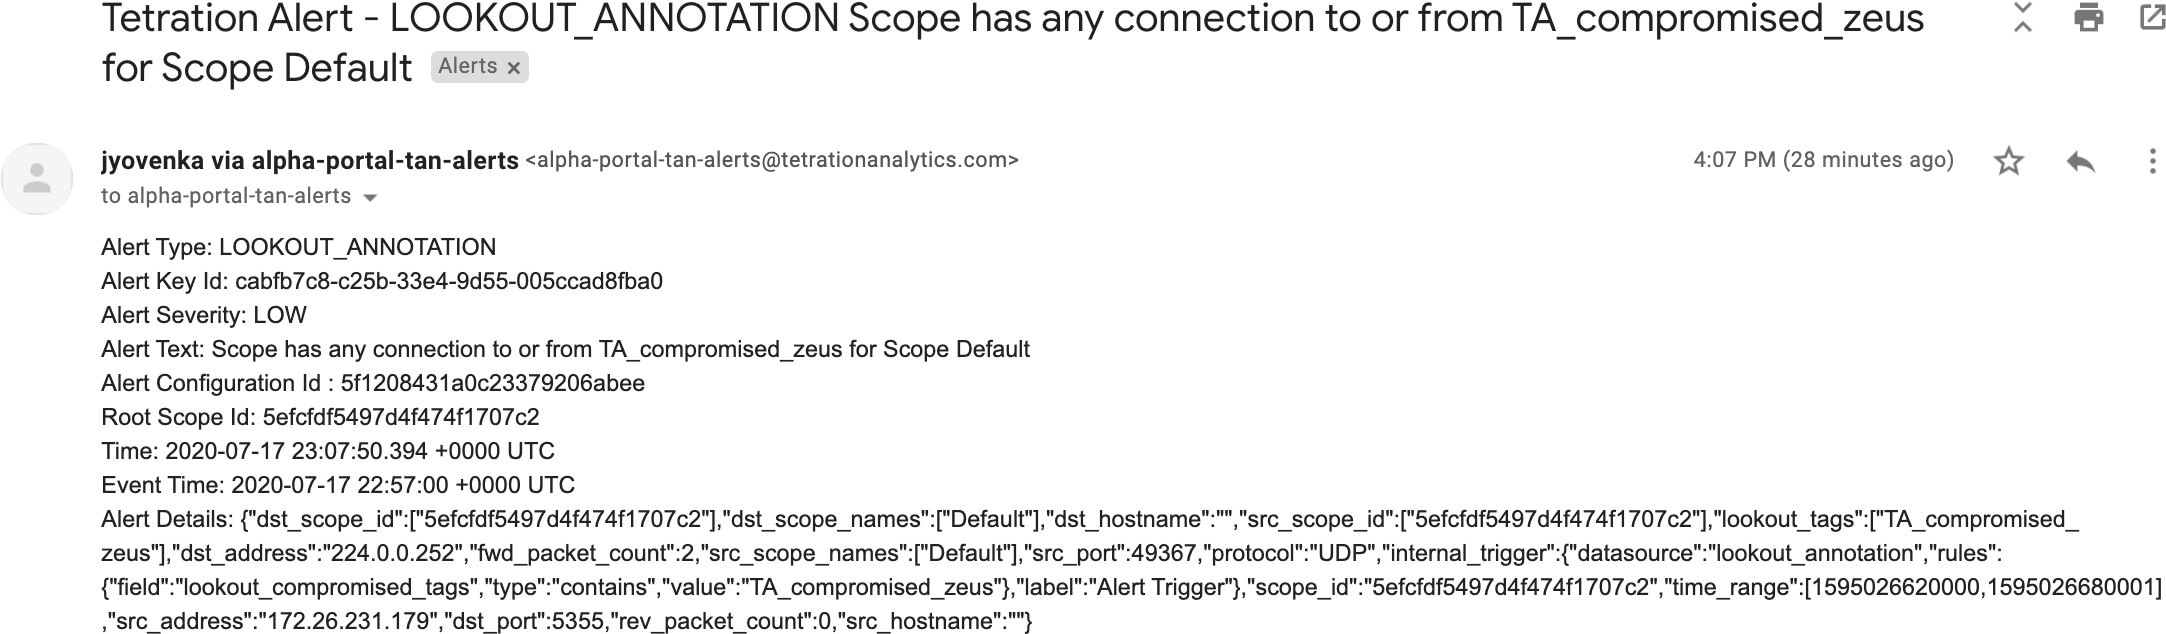
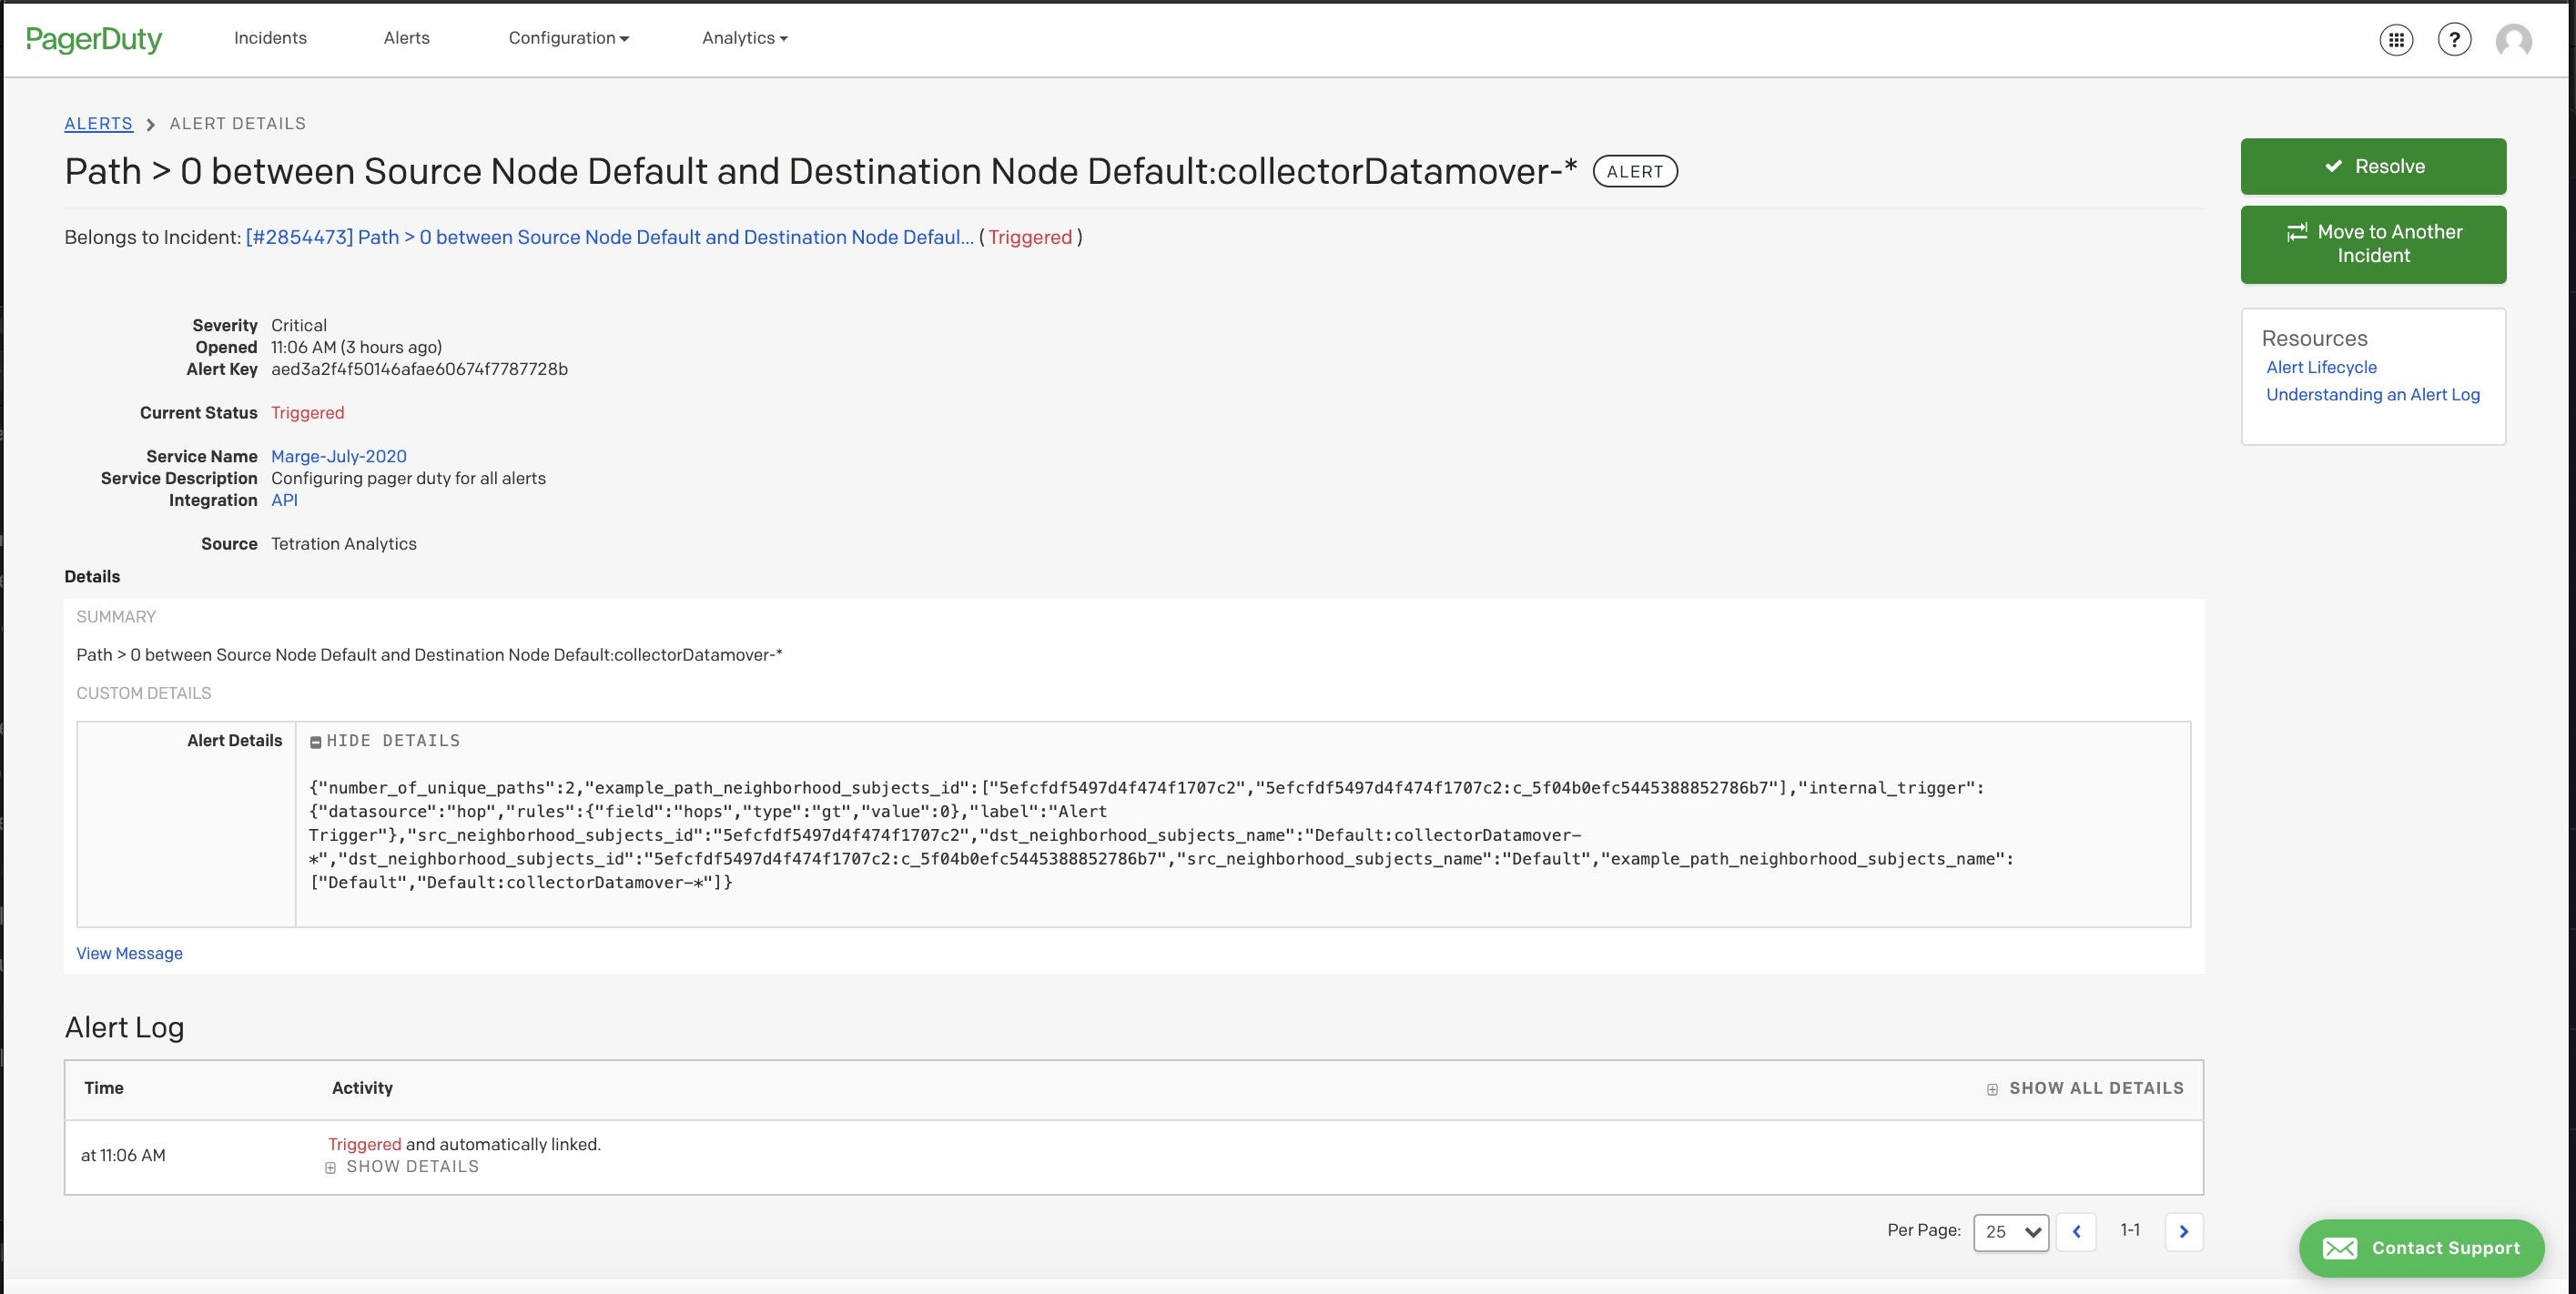
Edge Appliance: Pushes alerts to other systems such as Slack, PagerDuty, Email, and so on.
-
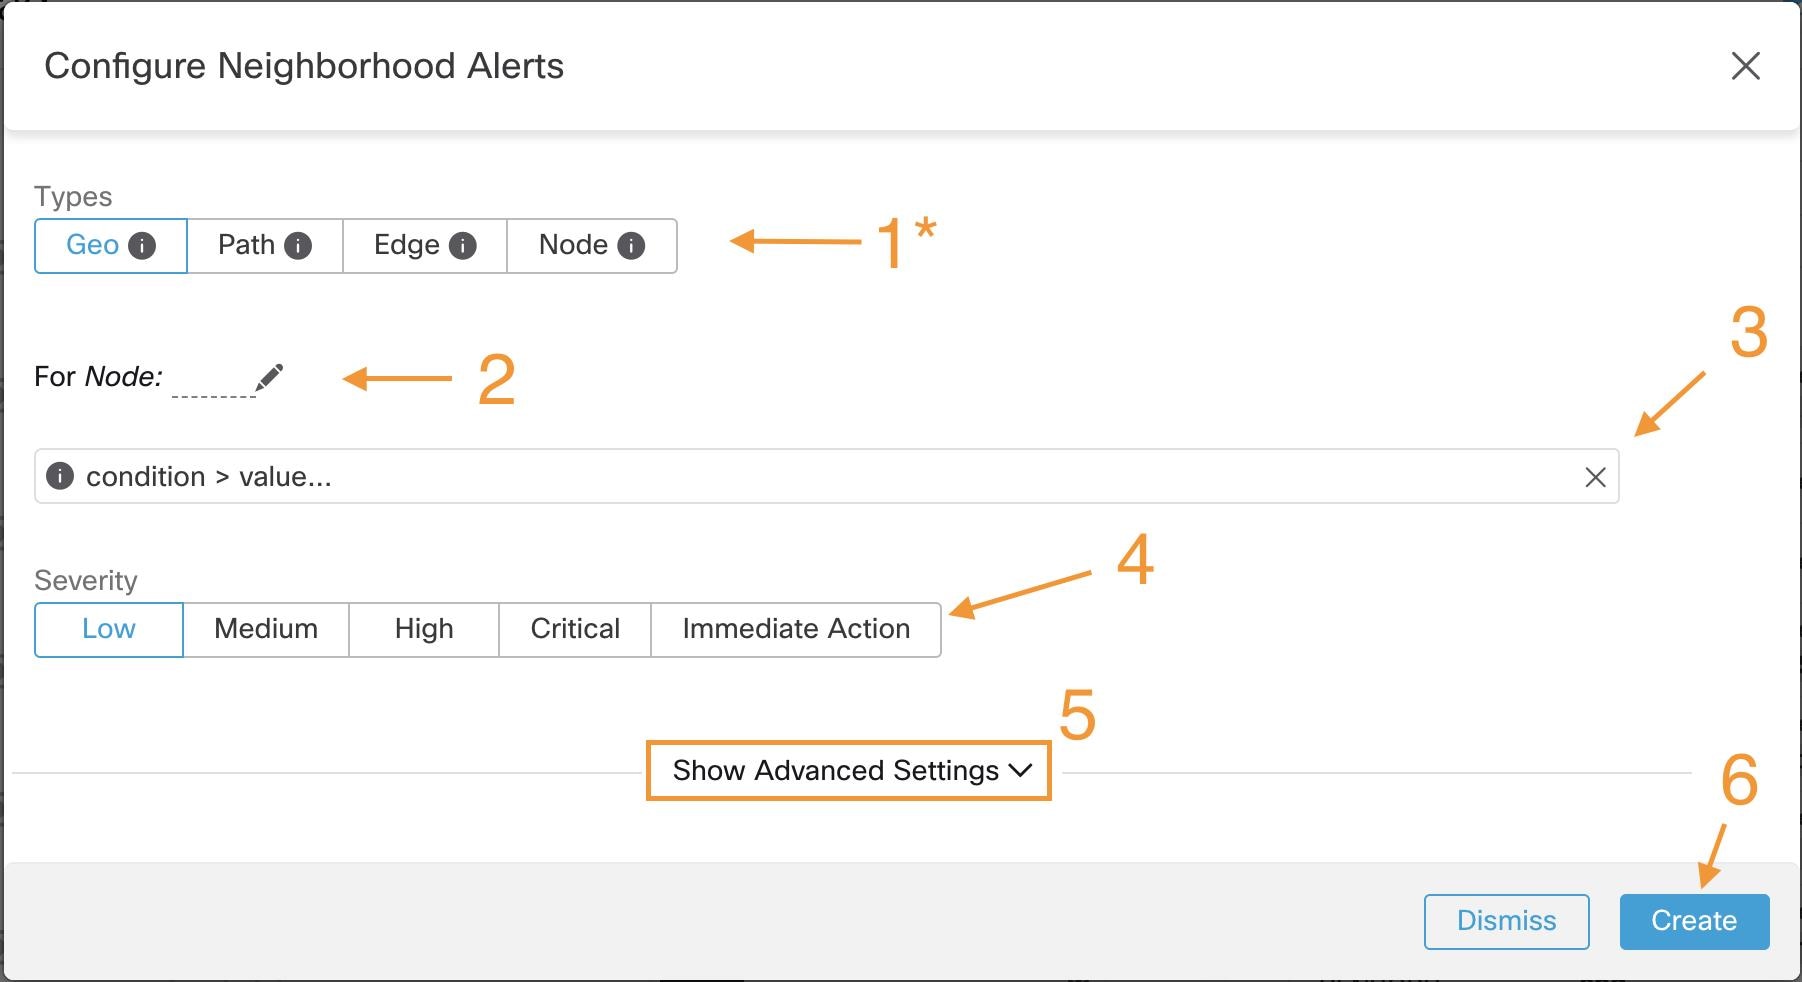
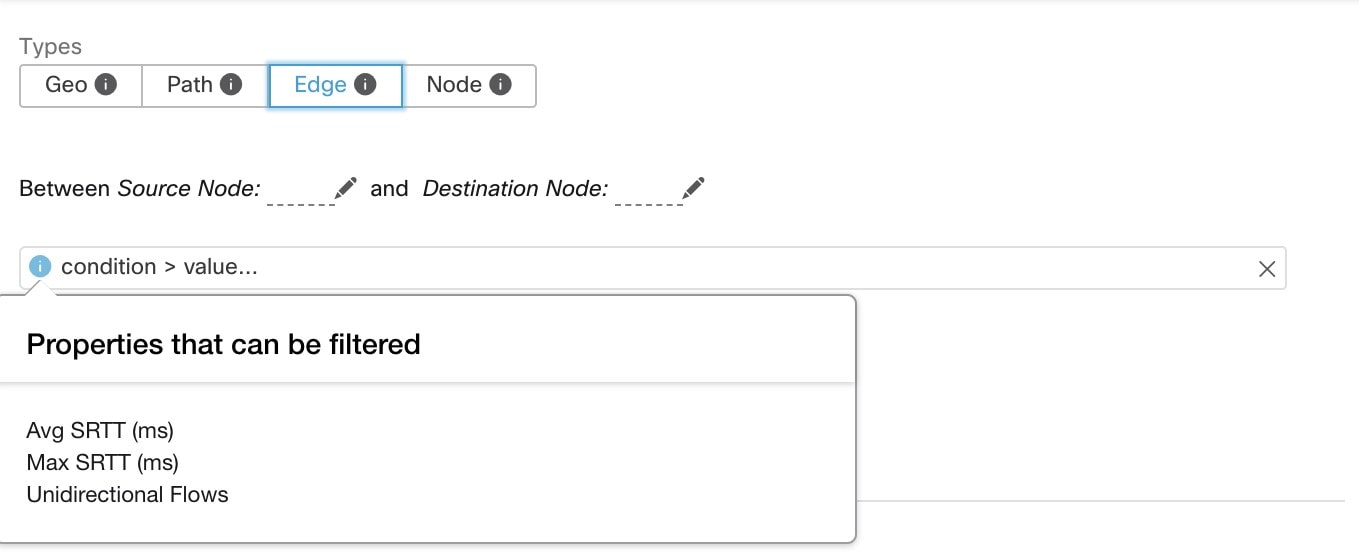
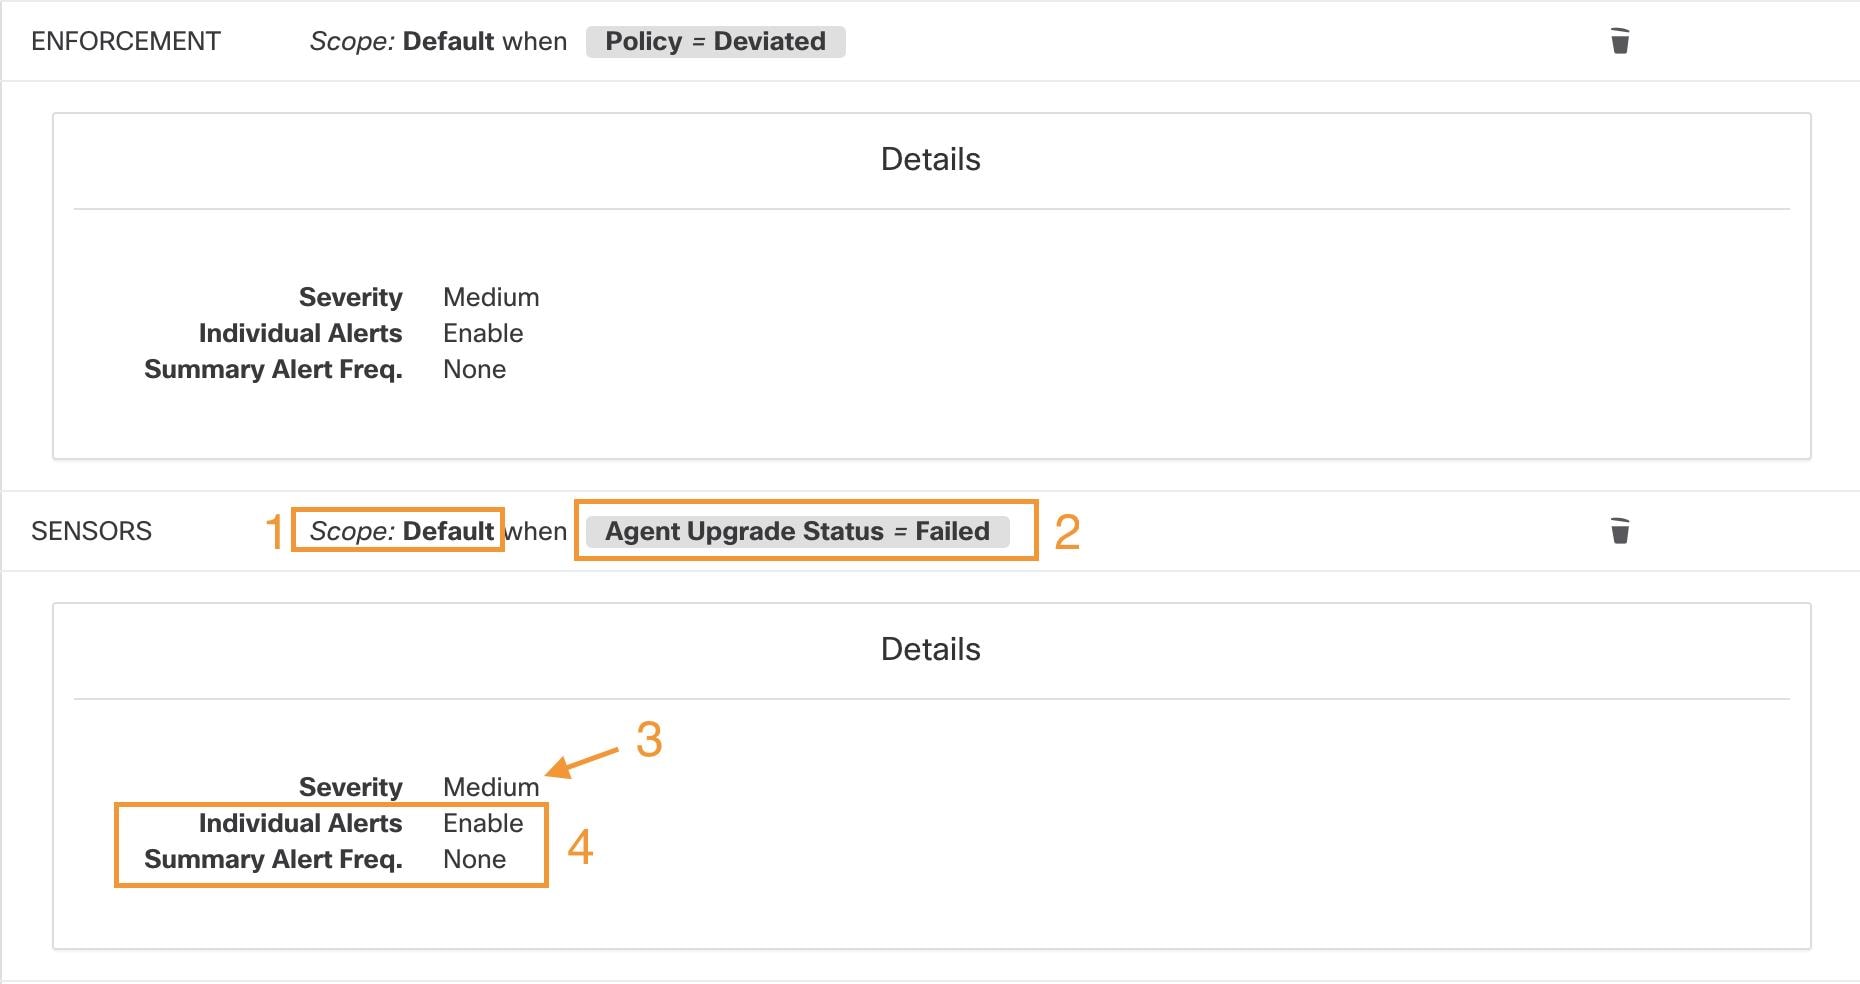
 Note: this list will show those conditions available specifically for the type of alert alert currently being configured.
 Feedback