Log Secure Firewall ASA Events

This chapter covers information on how to log Secure Firewall ASA events.

About Secure Event Connectors

The Secure Event Connector (SEC) is a component of the Security Analytics and Logging SaaS solution. It receives events from ASA , and FDM-managed devices and forwards them to the Cisco cloud. Security Cloud Control displays the events on the Event Logging page so that administrators can analyze them there or by using Cisco Secure Cloud analytics.

The SEC is installed on a Secure Device Connector deployed in your network, on its own Security Cloud Control Connector virtual machine deployed in your network, or on an AWS Virtual Private Cloud (VPC).

Secure Event Connector ID

You may need the ID of the SEC when working with Cisco Technical Assistance Center (TAC) or other Security Cloud Control Support. That ID is found on the Secure Connectors page in Security Cloud Control. To find the SEC ID:

  1. From the Security Cloud Control menu on the left, choose Administration > Secure Connectors.

  2. Click the SEC you wish to identify.

  3. The SEC ID is the ID listed above the Tenant ID in the Details pane.

Installing Secure Event Connectors

Secure Event Connectors (SECs) can be installed on a tenant with or without an SDC.

You can install one SEC on the same virtual machine as a Secure Device Connector, if you have one; or you can install the SEC on it's own Security Cloud Control Connector virtual machine that you maintain in your network.

Install a Secure Event Connector on an SDC Virtual Machine

The Secure Event Connector (SEC) receives events from ASA and FDM-managed devices and forwards them to the Cisco cloud. Security Cloud Control displays the events on the Event Logging page so that administrators can analyze them there or by using Cisco Secure Cloud Analytics.

You can install one SEC on the same virtual machine as a Secure Device Connector, if you have one; or you can install the SEC on it's own Security Cloud Control Connector virtual machine that you maintain in your network.

This article describes installing an SEC on the same virtual machine as an SDC. If you want to install more SECs see Installing an SEC Using a Security Cloud Control Image or Install an SEC Using Your VM Image.

Before you begin

  • Purchase the Cisco Security and Analytics Logging, Logging and Troubleshooting license. Or, If you want to try Cisco Security and Analytics Logging out first, log in to Security Cloud Control, and on the main navigation bar, choose Events & Logs > Events > Event Logging and click Request Trial. You may also purchase the Logging Analytics and Detection and Total Network Analytics and Monitoring licenses to apply Secure Cloud Analytics to the events.

  • Make sure your SDC has been installed. For more information, see Deploy a VM for Running the Secure Device Connector and Secure Event Connector.

  • Make sure the SDC is communicating with Security Cloud Control:

    1. In the left pane, click Administration > Secure Connectors.

    2. Make sure that the SDC's last heartbeat was less than 10 minutes prior to the installation of the SEC and that the SDC's status is active.

  • System Requirements - Assign additional CPUs and memory to the virtual machine running the SDC:

    • CPU: Assign an additional 4 CPUs to accommodate the SEC to make a total of 6 CPU.

    • Memory: Assign an additional 8 GB of memory for the SEC to make a total of 10 GB of memory.

      After you have updated the CPU and memory on the VM to accommodate the SEC, power on the VM and ensure that the Secure Connectors page indicates that the SDC is in the "Active" state.

Procedure


Step 1

Log in to Security Cloud Control.

Step 2

In the left pane, click Administration > Secure Connectors.

Step 3

Click the icon and then click Secure Event Connector.

Step 4

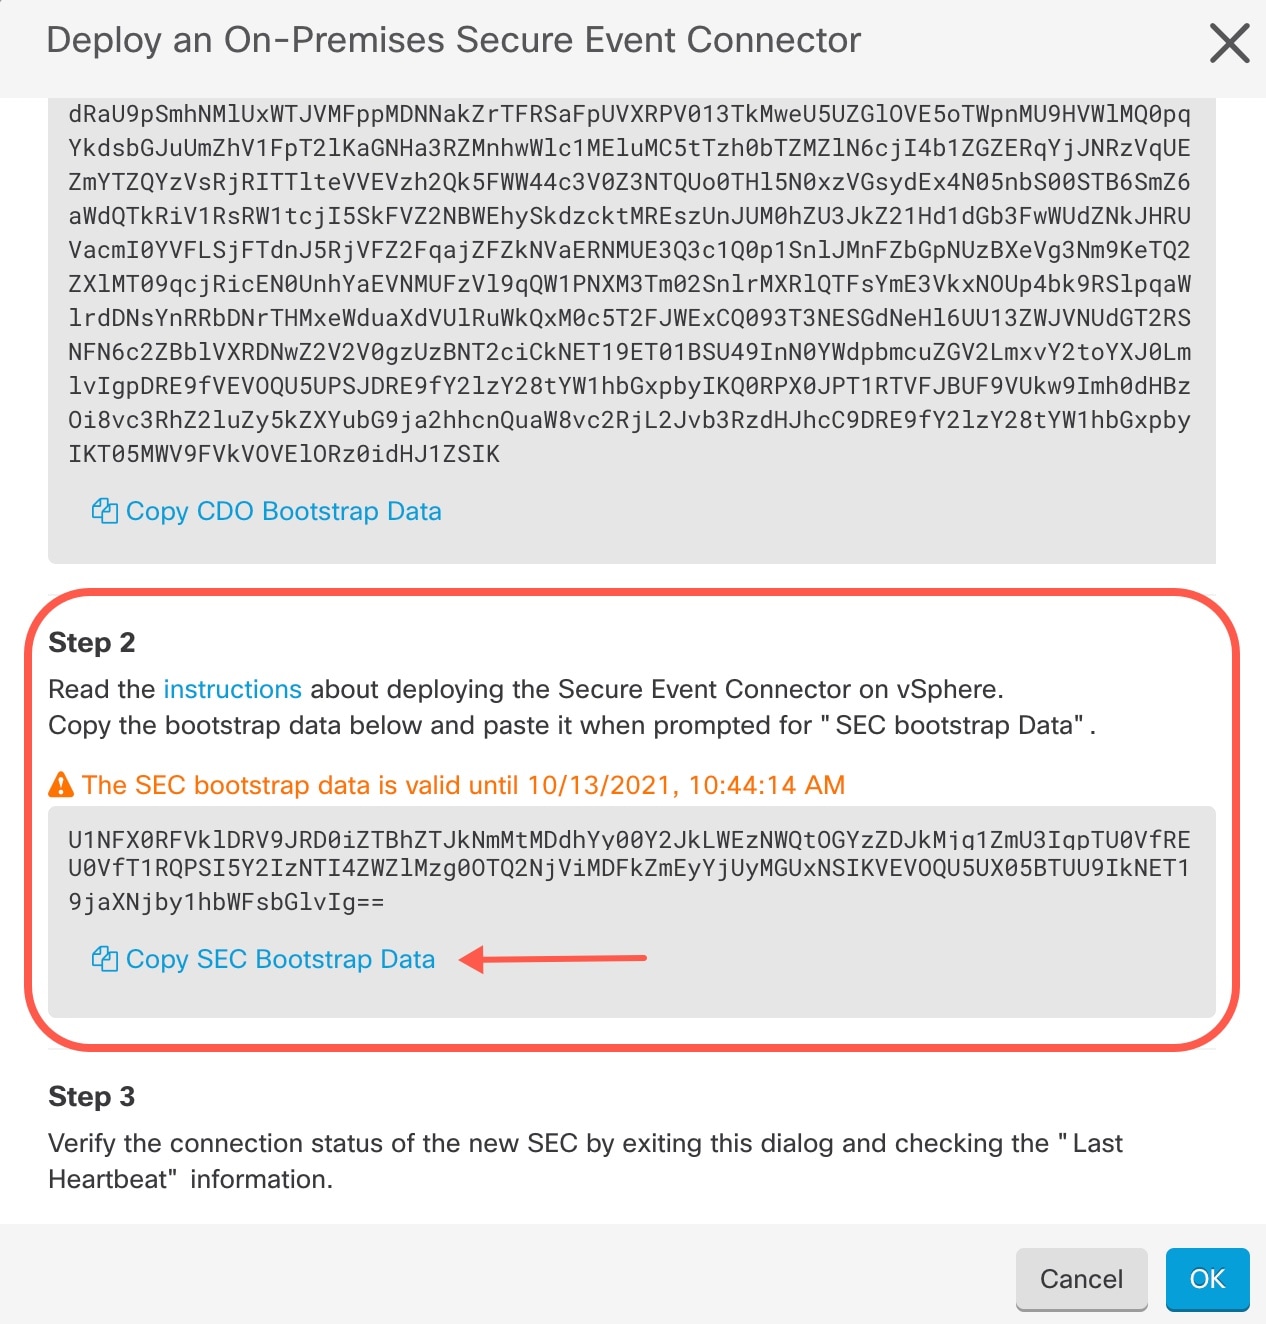
Skip Step 1 of the wizard and go to Step 2. In step 2 of the wizard, click the link to Copy SEC Bootstrap Data.

Step 5

Open a terminal window and log into the SDC as the "cdo" user.

Step 6

Once logged in, switch to the "sdc" user. When prompted for a password, enter the password for the "cdo" user. Here is an example of those commands:

[cdo@sdc-vm ~]$ sudo su sdc
[sudo] password for cdo: <type password for cdo user>
[sdc@sdc-vm ~]$

Step 7

At the prompt, run the sec.sh setup script:

[sdc@sdc-vm ~]$ /usr/local/cdo/toolkit/sec.sh setup

Step 8

At the end of the prompt, paste the bootstrap data you copied in step 4 and press Enter.

Please copy the bootstrap data from Setup Secure Event Connector page of Security
                                            Cloud Control: KJHYFuYTFuIGhiJKlKnJHvHfgxTewrtwE
RtyFUiyIOHKNkJbKhvhgyRStwterTyufGUihoJpojP9UOoiUY8VHHGFXREWRtygfhVjhkOuihIuyftyXtfcghvjbkhB=

After the SEC is onboarded, the sec.sh runs a script to check on the health of the SEC. If all the health checks are "green," the health check sends a sample event to the Event Log. The sample event shows up in the Event Log as a policy named "sec-health-check."

If you receive a message that the registration failed or that the SEC onboarding failed, go to Troubleshooting Secure Event connector Onboarding Failures.

Step 9

Determine if the VM on which the SDC and SEC are running needs additional configuration:


What to do next

Return to Implementing Secure Logging Analytics (SaaS) for ASA Devices .

Installing an SEC Using a Security Cloud Control Image

The Secure Event Connector (SEC) forwards events from ASA and FTD to the Cisco cloud so that you can view them in the Event Logging page and investigate them with Secure Cloud Analytics, depending on your licensing.

You can install more than one Secure Event Connector (SEC) on your tenant and direct events from your ASAs and FDM-managed devices to any of the SECs you install. Having multiple SECs allows you to have SECs installed in different locations and distribute the work of sending events to the Cisco cloud.

Installing an SEC is a two part process:

  1. Install a Security Cloud Control Connector, to Support a Secure Event Connector, Using a Security Cloud Control VM Image You need one Security Cloud Control Connector for every SEC you install. The Security Cloud Control Connector is different than a Secure Device Connector (SDC).

  2. Install the Secure Event Connector on your Security Cloud Control Connector Virtual Machine.


Note


If you want to create a Security Cloud Control Connector by creating your own VM, see Install Multiple SECs for Your Tenant Using a VM Image you Create.


What to do next:

Continue with Install a Security Cloud Control Connector, to Support a Secure Event Connector, Using a Security Cloud Control VM Image

Install a Security Cloud Control Connector, to Support a Secure Event Connector, Using a Security Cloud Control VM Image

Before you begin
  • Purchase the Cisco Security and Analytics Logging, Logging and Troubleshooting license, you may also purchase the Logging Analytics and Detection and Total Network Analytics and Monitoring licenses to apply Secure Cloud Analytics to the events.

    If you would rather, you can request a trial version of Security Analytics and Logging by logging in to Security Cloud Control, and on the main navigation bar, choose Events & Logs > Events > Event Logging and click Request Trial.

  • Security Cloud Control requires strict certificate checking and does not support Web/Content Proxy inspection between the Security Cloud Control Connector and the Internet. If using a proxy server, disable inspection for traffic between the Security Cloud Control Connector and Security Cloud Control.

  • The Security Cloud Control Connector installed in this process must have full outbound access to the Internet on TCP port 443.

  • Review Connect to Security Cloud Control using Secure Device Connector to ensure proper network access for the Security Cloud Control Connector.

  • Security Cloud Control supports installing its Security Cloud Control Connector VM OVF image using the vSphere web client or the ESXi web client.

  • Security Cloud Control does not support installing the Security Cloud Control Connector VM OVF image using the VM vSphere desktop client.

  • ESXi 5.1 hypervisor.

  • System requirements for a VM intended to host only a Security Cloud Control Connector and an SEC:

    • VMware ESXi host needs 4 vCPU.

    • VMware ESXi host needs a minimum of 8 GB of memory.

    • VMware ESXi requires 64GB disk space to support the virtual machine depending on your provisioning choice.

  • Gather this information before you begin the installation:

    • Static IP address you want to use for your Security Cloud Control Connector VM.

    • Passwords for the root and Security Cloud Control users that you create during the installation process.

    • The IP address of the DNS server your organization uses.

    • The gateway IP address of the network the SDC address is on.

    • The FQDN or IP address of your time server.

  • The Security Cloud Control Connector virtual machine is configured to install security patches on a regular basis and in order to do this, opening port 80 outbound is required.

Procedure

Step 1

Log on to the Security Cloud Control tenant you are creating the Security Cloud Control Connector for.

Step 2

In the left pane, click Administration > Secure Connectors.

Step 3

Click the icon and then click Secure Event Connector.

Step 4

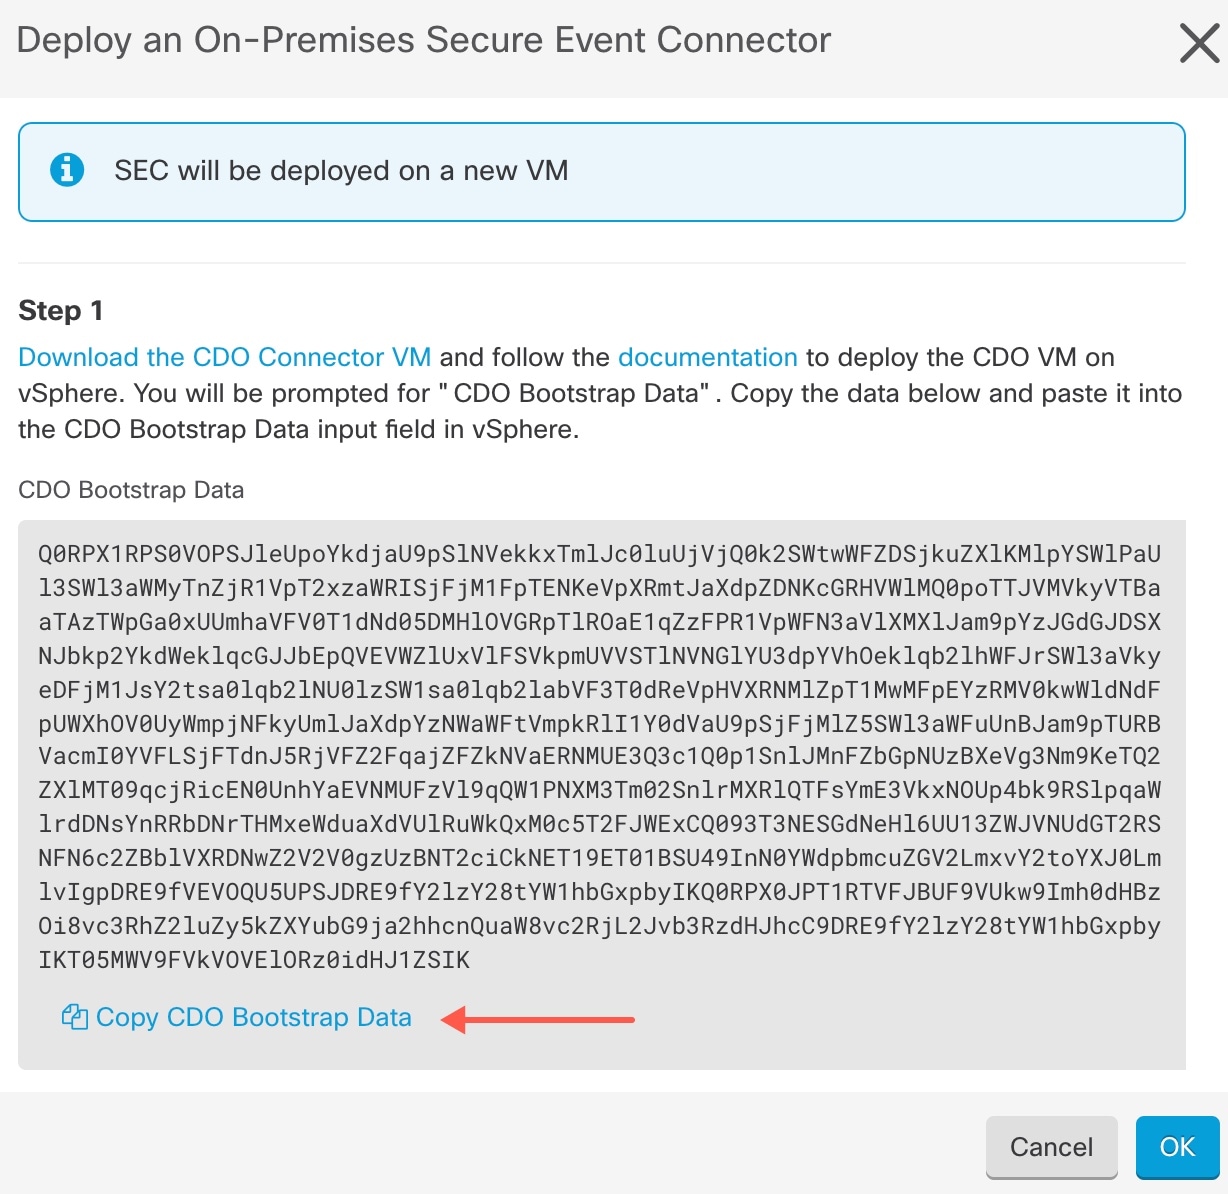
In Step 1, click Download the Security Cloud Control Connector VM image. This is a special image that you install the SEC on. Always download the Security Cloud Control Connector VM to ensure that you are using the latest image.

Step 5

Extract all the files from the .zip file. They will look similar to these:

  • Security Cloud Control-SDC-VM-ddd50fa.ovf

  • Security Cloud Control-SDC-VM-ddd50fa.mf

  • Security Cloud Control-SDC-VM-ddd50fa-disk1.vmdk

Step 6

Log on to your VMware server as an administrator using the vSphere Web Client.

Note


Do not use the VM vSphere desktop client.

Step 7

Deploy the on-premises Security Cloud Control Connector virtual machine from the OVF template by following the prompts. (You will need the .ovf, .mf, and .vdk files to deploy the template.)

Step 8

When the setup is complete, power on the VM.

Step 9

Open the console for your new Security Cloud Control Connector VM.

Step 10

Login as the Security Cloud Control user. The default password is adm123.

Step 11

At the prompt type sudo sdc-onboard setup

[cdo@localhost ~]$ sudo sdc-onboard setup

Step 12

When prompted, enter the default password for the Security Cloud Control user: adm123.

Step 13

Follow the prompts to create a new password for the root user.

Step 14

Follow the prompts to create a new password for the Security Cloud Control user.

Step 15

Follow the prompts to enter your Security Cloud Control domain information.

Step 16

Enter the static IP address you want to use for the Security Cloud Control Connector VM.

Step 17

Enter the gateway IP address for the network on which the Security Cloud Control Connector VM is installed.

Step 18

Enter the NTP server address or FQDN for the Security Cloud Control Connector.

Step 19

When prompted, enter the information for the Docker bridge or leave it blank if it is not applicable and press <Enter>.

Step 20

Confirm your entries.

Step 21

When prompted "Would you like to setup the SDC now?" enter n.

Step 22

Create an SSH connection to the Security Cloud Control Connector by logging in as the Security Cloud Control user.

Step 23

At the prompt type sudo sdc-onboard bootstrap

[cdo@localhost ~]$ sudo sdc-onboard bootstrap

Step 24

When prompted, enter the Security Cloud Control user's password.

Step 25

When prompted, return to Security Cloud Control and copy the Security Cloud Control bootstrap data, then paste it into your SSH session. To copy the Security Cloud Control bootstrap data:

  1. Log into Security Cloud Control.

  2. In the left pane, click Administration > Secure Connectors.

  3. Select the Secure Event Connector which you started to onboard. The status should show, "Onboarding."

  4. In the Actions pane, click Deploy an On-Premises Secure Event Connector.

  5. Copy the Security Cloud Control Bootstrap Data in step 1 of the dialog box.

Step 26

When prompted, Would you like to update these settings? enter n.

Step 27

Return to the Deploy an On-Premises Secure Event Connector dialog in Security Cloud Control and click OK. In the Secure Connectors page, you will see your Secure Event Connector is in the yellow Onboarding state.


What to do next

Continue to Install the Secure Event Connector on the Security Cloud Control Connector VM.

Install the Secure Event Connector on the Security Cloud Control Connector VM

Before you begin

You should have installed Security Cloud Control Connector VM as described inInstall a Security Cloud Control Connector, to Support a Secure Event Connector, Using a Security Cloud Control VM Image .

Procedure

Step 1

Log in to Security Cloud Control.

Step 2

In the left pane, choose Administration > Secure Connectors.

Step 3

Select the Security Cloud Control Connector that you onboarded above. In the Secure Connectors table, it will be called a Secure Event Connector and it should still be in the "Onboading" status.

Step 4

Click Deploy an On-Premises Secure Event Connector in the Actions pane on the right.

Step 5

In step 2 of the wizard, click the link to Copy SEC bootstrap data.

Step 6

Create an SSH connection to the Security Cloud Control Connector and log in as the CDO user.

Step 7

Once logged in, switch to the sdc user. When prompted for a password, enter the password for the "Security Cloud Control" user. Here is an example of those commands:

[cdo@sdc-vm ~]$ sudo su sdc
 [sudo] password for cdo: <type password for cdo user> 
[sdc@sdc-vm ~]$

Step 8

At the prompt, run the sec.sh setup script:

[sdc@sdc-vm ~]$ /usr/local/cdo/toolkit/sec.sh setup

Step 9

At the end of the prompt, paste the bootstrap data you copied in step 4 and press Enter.

Please copy the bootstrap data from Setup Secure Event Connector page of CDO: KJHYFuYTFuIGhiJKlKnJHvHfgxTewrtwE
 RtyFUiyIOHKNkJbKhvhgyRStwterTyufGUihoJpojP9UOoiUY8VHHGFXREWRtygfhVjhkOuihIuyftyXtfcghvjbkhB= 

After the SEC is onboarded, the sec.sh runs a script to check on the health of the SEC. If all the health checks are "green," the health check sends a sample event to the Event Log. The sample event shows up in the Event Log as a policy named "sec-health-check."

If you receive a message that the registration failed or that the SEC onboarding failed, go to Troubleshoot SEC Onboarding Failures.

If you receive the success message return to Security Cloud Control and click Done on the Deploy an ON-Premise Secure Event Connector dialog box.


What to do next

Return to Implementing Secure Logging Analytics (SaaS) for ASA Devices .

Deploy Secure Event Connector on Ubuntu Virtual Machine

Before you begin

You should have installed Secure Device Connector on your Ubuntu VM as described in Deploy a VM for Running the Secure Device Connector and Secure Event Connector.

Procedure


Step 1

Log on to Security Cloud Control.

Step 2

From the left pane, Administration > Secure Connectors.

Step 3

Click the icon and then click Secure Event Connector.

Step 4

Copy the SEC bootstrap data in step 2 on the window to a notepad.

Step 5

Execute the following commands:

[sdc@vm]:~$sudo su sdc
sdc@vm:/home/user$ cd /usr/local/cdo/toolkit

When prompted, enter the SEC bootstrap data that you have copied..

sdc@vm:~/toolkit$ ./sec.sh setup
Please input the bootstrap data from Setup Secure Event Connector page of CDO: 
Successfully on-boarded SEC
It may take a few minutes for the Secure Event Connector to become "Active" in Security Cloud Control.

Install an SEC Using Your VM Image

The Secure Event Connector (SEC) forwards events from ASA and FTD to the Cisco cloud so that you can view them in the Event Logging page and investigate them with Secure Cloud Analytics, depending on your licensing.

You can install more than one Secure Event Connector (SEC) on your tenant and direct events from your ASAs and FDM-managed devices to any of the SECs you install. Having multiple SECs allows you to have SECs installed in different regions and distribute the work of sending events to the Cisco cloud.

Installing multiple SECs using your own VM image is a three part process. You must perform each of these steps:

  1. Install a Security Cloud Control Connector to Support an SEC Using Your VM Image

  2. Additional Configuration for SDCs and Security Cloud Control Connectors Installed on a VM You Created

  3. Install the Secure Event Connector


Note


Using a Security Cloud Control VM image for the Security Cloud Control Connector is the easiest, most accurate, and preferred method of installing a Security Cloud Control connector. If you want to use that method, see Installing an SEC Using a Security Cloud Control Image.


What to do next:

Continue to Install a Security Cloud Control Connector to Support an SEC Using Your VM Image

Install a Security Cloud Control Connector to Support an SEC Using Your VM Image

The Security Cloud Control Connector VM is a virtual machine on which you install an SEC. The purpose of the Security Cloud Control Connector is solely to support an SEC for Cisco Security Analytics and Logging (SaaS) customers.

This is the first of three steps you need to complete in order install and configure your Secure Event Connector (SEC). After this procedure, you need to complete the following procedures:

Before you begin
  • Purchase the Cisco Security and Analytics Logging, Logging and Troubleshootinglicense, you may also purchase the Logging Analytics and Detection and Total Network Analytics and Monitoring licenses to apply Secure Cloud Analytics to the events.

    If you would rather, you can request a trial version of Security Analytics and Logging by logging in to Security Cloud Control, and on the main navigation bar, choose Events & Logs > Events > Event Logging and click Request Trial.

  • Security Cloud Control requires strict certificate checking and does not support a Web/Content Proxy between the Security Cloud Control Connector and the Internet.

  • The Security Cloud Control Connector must have full outbound access to the Internet on TCP port 443.

  • Review Connect to Security Cloud Control using Secure Device Connectorto ensure proper network access for the Security Cloud Control Connector.

  • VMware ESXi host installed with vCenter web client or ESXi web client.


    Note


    We do not support installation using the vSphere desktop client.
  • ESXi 5.1 hypervisor.

  • Ubuntu 22.04 and Ubuntu 24.04.

  • System requirements for a VM to host only a Security Cloud Control Connector and an SEC:

    • CPU: Assign 4 CPUs to accommodate the SEC.

    • Memory: Assign 8 GB of memory for the SEC.

    • Disk Space: 64 GB

  • Users performing this procedure should be comfortable working in a Linux environment and using the vi visual editor for editing files.

  • Gather this information before you begin the installation:

    • Static IP address you want to use for your Security Cloud Control Connector.

    • Passwords for the root and Security Cloud Control users that you create during the installation process.

    • The IP address of the DNS server your organization uses.

    • The gateway IP address of the network the Security Cloud Control Connector address is on.

    • The FQDN or IP address of your time server.

  • The Security Cloud Control Connector virtual machine is configured to install security patches on a regular basis and in order to do this, opening port 80 outbound is required.

  • Before you get started: Do not copy and paste the commands in this procedure into your terminal window, type them instead. Some commands include an "n-dash" and in the cut and paste process, these commands can be applied as an "m-dash" and that may cause the command to fail.

Procedure

Step 1

Log on to Security Cloud Control.

Step 2

From the left pane, Administration > Secure Connectors.

Step 3

Click the icon and then click Secure Event Connector.

Step 4

Using the link provided, copy the SEC Bootstrap Data in step 2 of the "Deploy an On-Premises Secure Event Connector" window.

Step 5

Once installed, configure basic networking such as specifying the IP address for the Security Cloud Control Connector, the subnet mask, and gateway.

Step 6

Configure a DNS (Domain Name Server) server.

Step 7

Configure a NTP (Network Time Protocol) server.

Step 8

Install an SSH server for easy interaction with Security Cloud Control Connector's CLI.

Step 9

Install the AWS CLI package (https://docs.aws.amazon.com/cli/latest/userguide/awscli-install-linux.html)

Note


Do not use the --user flag.

Step 10

Install the Docker CE packages (https://docs.docker.com/install/linux/docker-ce/centos/#install-docker-ce)

Note


Use the "Install using the repository" method.

Step 11

Start the Docker service and enable it to start on boot:

[root@sdc-vm ~]# systemctl start docker
 [root@sdc-vm ~]# systemctl enable docker 
Created symlink from /etc/systemd/system/multiuser.target.wants/docker.service to /usr/lib/systemd/system/docker.service. 

Step 12

Create two users: Security Cloud Control and sdc. The Security Cloud Control user will be the one you log-into to run administrative functions (so you don't need to use the root user directly), and the sdc user will be the user to run the Security Cloud Control Connector docker container.

[root@sdc-vm ~]# useraddSecurity
                                            Cloud Control
 [root@sdc-vm ~]# useradd sdc –d /usr/local/Security
                                            Cloud Control

Step 13

Configure the sdc user to use crontab:

[root@sdc-vm ~]# touch /etc/cron.allow
[root@sdc-vm ~]# echo "sdc" >> /etc/cron.allow

Step 14

Set a password for the Security Cloud Control user.

[root@sdc-vm ~]# passwd Security
                                            Cloud Control 
Changing password for user Security
                                            Cloud Control. 
New password: <type password>  
Retype new password: <type password> 
passwd: all authentication tokens updated successfully. 

Step 15

Add the Security Cloud Control user to the "wheel" group to give it administrative (sudo) privileges.

[root@sdc-vm ~]# usermod -aG wheelSecurity
                                            Cloud Control
 [root@sdc-vm ~]# 

Step 16

When Docker is installed, there is a user group created. Depending on the version of CentOS/Docker, this may be called either "docker" or "dockerroot". Check the /etc/group file to see which group was created, and then add the sdc user to this group.


 [root@sdc-vm ~]# grep docker /etc/group 
docker:x:993:
[root@sdc-vm ~]# 
[root@sdc-vm ~]# usermod -aG docker sdc 
[root@sdc-vm ~]# 

Step 17

If the /etc/docker/daemon.json file does not exist, create it, and populate with the contents below. Once created, restart the docker daemon.

Note


Make sure that the group name entered in the "group" key matches the group you found in the /etc/group file.

 [root@sdc-vm ~]# cat /etc/docker/daemon.json 
{
 "live-restore": true, 
 "group": "docker" 
} 
[root@sdc-vm ~]# systemctl restart docker 
[root@sdc-vm ~]# 

Step 18

If you are currently using a vSphere console session, switch over to SSH and log in as the Security Cloud Control user. Once logged in, change to the sdc user. When prompted for a password, enter the password for the Security Cloud Control user.

[Security
                                            Cloud Control@sdc-vm ~]$ sudo su sdc 
[sudo] password for Security
                                            Cloud Control: <type password for Security
                                            Cloud Control user > 
[sdc@sdc-vm ~]$ 

Step 19

Change directories to /usr/local/Security Cloud Control.

Step 20

Create a new file called bootstrapdata and paste the bootstrap data from Step 1 of the deployment wizrd into this file. Save the file. You can use vi or nano to create the file.

Step 21

The bootstrap data comes encoded in base64. Decode it and export it to a file called extractedbootstrapdata

 [sdc@sdc-vm ~]$ base64 -d /usr/local/Security
                                            Cloud Control/bootstrapdata > /usr/local/Security
                                            Cloud Control/extractedbootstrapdata 
[sdc@sdc-vm ~]$ 

Run the cat command to view the decoded data. The command and decoded data should look similar to this:

[sdc@sdc-vm ~]$ cat /usr/local/Security
                                            Cloud Control/extractedbootstrapdata 
Security
                                            Cloud Control_TOKEN="<token string>" 
Security
                                            Cloud Control_DOMAIN="www.defenseorchestrator.com" 
Security
                                            Cloud Control_TENANT="<tenant-name>" 
<Security
                                            Cloud Control_URL>/sdc/bootstrap/Security
                                            Cloud Control_acm="https://www.defenseorchestrator.com/sdc/bootstrap/tenant-name/<tenant-name-SDC>" 
ONLY_EVENTING="true" 

Step 22

Run the following command to export the sections of the decoded bootstrap data to environment variables.


[sdc@sdc-vm ~]$ sed -e 's/^/export /g' extractedbootstrapdata > secenv && source secenv 
[sdc@sdc-vm ~]$ 

Step 23

Download the bootstrap bundle from Security Cloud Control.

 [sdc@sdc-vm ~]$ curl -H "Authorization: Bearer $Security
                                            Cloud Control_TOKEN" "$Security
                                            Cloud Control_BOOTSTRAP_URL" -o $Security
                                            Cloud Control_TENANT.tar.gz 
100 10314 100 10314 0 0 10656 0 --:--:-- --:--:-- --:--:-- 10654 
[sdc@sdc-vm ~]$ ls -l /usr/local/Security
                                            Cloud Control/*SDC 
-rw-rw-r--. 1 sdc sdc 10314 Jul 23 13:48 /usr/local/Security
                                            Cloud Control/Security
                                            Cloud Control_<tenant_name>

Step 24

Extract the Security Cloud Control Connector tarball, and run the bootstrap_sec_only.sh file to install the Security Cloud Control Connector package.

 [sdc@sdc-vm ~]$ tar xzvf /usr/local/Security
                                            Cloud Control/tenant-name-SDC 
<snipped – extracted files> 
[sdc@sdc-vm ~]$ 
[sdc@sdc-vm ~]$ /usr/local/Security
                                            Cloud Control/bootstrap/bootstrap_sec_only.sh 
[2018-07-23 13:54:02] environment properly configured 
download: s3://onprem-sdc/toolkit/prod/toolkit.tar to toolkit/toolkit.tar 
toolkit.sh 
common.sh 
es_toolkit.sh 
sec.sh 
healthcheck.sh 
troubleshoot.sh 
no crontab for sdc 
-bash-4.2$ crontab -l 
*/5 * * * * /usr/local/Security
                                            Cloud Control/toolkit/es_toolkit.sh upgradeEventing 2>&1 >> /usr/local/Security
                                            Cloud Control/toolkit/toolkit.log 
0 2 * * * sleep 30 && /usr/local/Security
                                            Cloud Control/toolkit/es_toolkit.sh es_maintenance 2>&1 >> /usr/local/Security
                                            Cloud Control/toolkit/toolkit.log 
You have new mail in /var/spool/mail/sdc

What to do next
Continue to Additional Configuration for SDCs and Security Cloud Control Connectors Installed on a VM You Created .

Additional Configuration for SDCs and Security Cloud Control Connectors Installed on a VM You Created

If you installed your Security Cloud Control Connector on your own CentOS 7 virtual machine, perform one of the following additional configuration procedures to allow events to reach the SEC:

Before you begin:

This is the second of three steps you need to complete in order to install and configure your SEC. If you have not already, complete Install a Security Cloud Control Connector to Support an SEC Using Your VM Image before making these configuration changes.

After you complete one of the additional configuration changes described here, complete Install the Secure Event Connector

Disable the firewalld service on the CentOS 7 VM
  1. Log into the CLI of the SDC VM as the "Security Cloud Control" user.

  2. Stop the firewalld service, and then ensure that it will remain disabled upon subsequent reboots of the VM. If you are prompted, enter the password for the Security Cloud Control user:

    [Security
                                                Cloud Control@SDC-VM ~]$ sudo systemctl stop firewalld
    Security
                                                Cloud Control@SDC-VM ~]$ sudo systemctl disable firewalld
  3. Restart the Docker service to re-insert Docker-specific entries into the local firewall:

    [Security Cloud Control@SDC-VM ~]$ sudo systemctl restart docker

  4. Continue to Install the Secure Event Connector.

Allow the firewalld service to run and add firewall rules to allow event traffic to reach the SEC
  1. Log into the CLI of the SDC VM as the "Security Cloud Control" user.

  2. Add local firewall rules to allow incoming traffic to the SEC from the TCP, UDP, or NSEL ports you configured. See Finding Your Device's TCP, UDP, and NSEL Port Used for Cisco Security Analytics and Logging for the ports used by your SEC. If prompted, enter the password for the Security Cloud Control user. Here is an example of the commands. You may need to specify different port values.

    [Security
                                                Cloud Control@SDC-VM ~]$ sudo firewall-cmd --zone=public --permanent --add-port=10125/tcp 
    Security
                                                Cloud Control@SDC-VM ~]$ sudo firewall-cmd --zone=public --permanent --add-port=10025/udp
    [Security
                                                Cloud Control@SDC-VM ~]$ sudo firewall-cmd --zone=public --permanent --add-port=10425/udp
  3. Restart the firewalld service to make the new local firewall rules both active and persistent:

    [Security Cloud Control@SDC-VM ~]$ sudo systemctl restart firewalld

  4. Continue to Install the Secure Event Connector.

Install the Secure Event Connector on your Security Cloud Control Connector Virtual Machine

Before you begin

This is the third of three steps you need to complete in order to install and configure your Secure Event Connector (SEC). If you have not already, complete the following tasks before continuing with this procedure:

Procedure

Step 1

Log in to Security Cloud Control.

Step 2

In the left pane, Administration > Secure Connectors.

Step 3

Select the Security Cloud Control Connector that you installed using the procedure in the prerequisites above. In the Secure Connectors table, it will be displayed as Secure Event Connector.

Step 4

Click Deploy an On-Premises Secure Event Connector in the Actions pane on the right.

Step 5

In step 2 of the wizard, click the link to Copy SEC Bootstrap Data.

Step 6

Connect to the Secure Connector using SSH and log in as the Security Cloud Control user.

Step 7

Once logged in, switch to the sdc user. When prompted for a password, enter the password for the "Security Cloud Control" user. Here is an example of those commands:

[cdo@sdc-vm ~]$ sudo su sdc
[sudo] password for cdo: <type password for cdo user>
[sdc@sdc-vm ~]$ 

Step 8

At the prompt, run the sec.sh setup script:

[sdc@sdc-vm ~]$ /usr/local/cdo/toolkit/sec.sh setup

Step 9

At the end of the prompt, paste the bootstrap data you copied in step 4 and press Enter.

Please copy the bootstrap data from Setup Secure Event Connector page of CDO:
 KJHYFuYTFuIGhiJKlKnJHvHfgxTewrtwE RtyFUiyIOHKNkJbKhvhgyRStwterTyufGUihoJpojP9UOoiUY8VHHGFXREWRtygfhVjhkOuihIuyftyXtfcghvjbkhB=

After the SEC is onboarded, the sec.sh runs a script to check on the health of the SEC. If all the health checks are "green," the health check sends a sample event to the Event Log. The sample event shows up in the Event Log as a policy named "sec-health-check."

If you receive a message that the registration failed or that the SEC onboarding failed, go to Troubleshooting Secure Event Connector Onboarding Failures.

If you receive the success message, click Done in the Deploy an ON-Premise Secure Event Connector dialog box.You have finished installing an SEC on a your VM image.


What to do next

Return to this procedure to continue your implementation of SAL SaaS: Implementing Secure Logging Analytics (SaaS) for ASA Devices .

Install a Secure Event Connector on an AWS VPC Using a Terraform Module

Before you begin

  • To perform this task, you must enable SAL on your Security Cloud Control tenant. This section presumes that you have a SAL license. If you do not have one, purchase the Cisco Security and Analytics Logging, Logging and Troubleshooting license.

  • Ensure you have a new SEC installed. To create a new SEC, see Install a Secure Event Connector on an SDC Virtual Machine.

  • When installing the SEC, make sure you take a note of the Security Cloud Control bootstrap data and SEC bootstrap data.

Procedure


Step 1

Go to Secure Event Connector Terraform Module on the Terraform Registry and follow the instructions to add the SEC Terraform module to your Terraform code.

Step 2

Apply the Terraform code.

Step 3

Ensure that you print the instance_id and sec_fqdn outputs, because you will need them later in the procedure.

Note


To troubleshoot your SEC, you must connect to your SEC instance using the AWS Systems Manager Session Manager (SSM). See the AWS Systems Manager Session Manager documentation to know more about connecting to an instance using SSM.

Ports to connect to the SDC instance using SSH are not exposed for secuirty reasons.

Step 4

To enable sending of logs from your ASA to the SEC, obtain the certificate chain of the SEC you created and remove the leaf certificate by running the following command with the output from Step 3:

rm -f /tmp/cert_chain.pem && openssl s_client -showcerts -verify 5 -connect <FQDN>:10125 < /dev/null | awk '/BEGIN CERTIFICATE/,/END CERTIFICATE/{ if(/BEGIN CERTIFICATE/){a++}; out="/tmp/cert_chain.pem"; if(a > 1) print >>out}'

Step 5

Copy the contents of /tmp/cert_chain.pem to your clipboard.

Step 6

Take a note of the IP address of the SEC using the following command:

nslookup <FQDN>

Step 7

Log in to Security Cloud Control and start adding a new trustpoint object. See Adding a Trusted CA Certificate Object for more information. Ensure you uncheck the Enable CA flag in basic constraints extension checkbox in Other Options before clicking Add.

Step 8

Click Add, copy the CLI commands generated by Security Cloud Control in the Install Certificate page, and click Cancel.

Step 9

Below enrollment terminal, add no ca-check in a text clipboard.

Step 10

SSH into your ASA device or use the ASA CLI option in Security Cloud Control and execute the following commands:

DataCenterFW-1> en
Password: *****************
DataCenterFW-1# conf t
DataCenterFW-1(config)# <paste your modified ASA CLIs here and press Enter>
DataCenterFW-1(config)# wr mem
Building configuration...
Cryptochecksum: 6634f35f 4c5137f1 ab0c5cdc 9784bdb6

What to do next

You can check if your SEC is receiving packets using AWS SSM:
You should now see logs similar to this:
time="2023-05-10T17:13:46.135018214Z" level=info msg="[ip-10-100-5-19.ec2.internal][util.go:67 plugin.createTickers:func1] Events - Processed - 6/s, Dropped - 0/s, Queue size - 0"

Remove the Secure Event Connector

Warning: This procedure deletes the Secure Event Connector from the Secure Device Connector. Doing so will prevent you from using Secure Logging Analytics (SaaS). It is not reversible. If you have any questions or concerns, contact Security Cloud Control support before taking this action.

Removing the Secure Event Connector from your Secure Device Connector is a two-step process:

  1. Remove SEC from Security Cloud Control.

  2. Remove SEC files from the SDC.

What to do next: Continue to Remove SEC from Security Cloud Control

Remove an SEC from Security Cloud Control

Before you begin

See Remove the Secure Event Connector.

Procedure


Step 1

Log in to Security Cloud Control.

Step 2

From the left pane, choose Administration > Secure Connectors.

Step 3

Select the row with the device type, Secure Event Connector.

Warning


Be careful NOT to select your Secure Device Connector.

Step 4

In the Actions pane, click Remove.

Step 5

Click OK to confirm.


What to do next

Continue to Remove a Secure Event Connector from the Secure Device Connector VM.

Remove a Secure Event Connector from the Secure Device Connector VM

This is the second part of a two part procedure to remove the Secure Event Connector from your SDC. See Remove the Secure Event Connector before you begin.

Procedure


Step 1

Open your virtual machine hypervisor and start a console session for your SDC.

Step 2

Switch to the SDC user using the command [cdo@sdc]$ sudo su sdc.

Step 3

To remove an SEC from the SDC virtual machine, you can use one of the following commands:

  • If you want to use the tenant selector (or if there’s only one tenant on the VM):

    [sdc@tenant toolkit]$ sdc eventing delete
  • If you want to specify the tenant directly in the command arguments:

    [sdc@tenant toolkit]$ sdc eventing delete CDO_{tenant-name} 

Step 4

Confirm your intention to remove the SEC files.


Finding Your Device's TCP, UDP, and NSEL Port Used for Secure Logging Analytics (SaaS)

Secure Logging Analytics (SaaS) allows you to send events from your ASA or FDM-managed devices to certain UDP, TCP, or NSEL ports on the Secure Event Connector (SEC). The SEC then forwards those events to the Cisco cloud.

If these ports aren't already in use, the SEC makes them available to receive events and the Secure Logging Analytics (SaaS) documentation recommends using them when you configure the feature.

  • TCP: 10125

  • UDP: 10025

  • NSEL: 10425

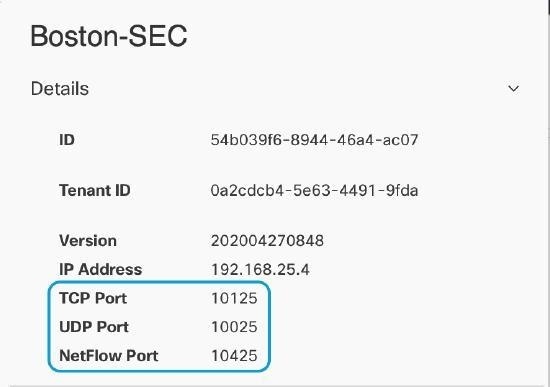
If those ports are already in use, before you configure Secure Logging Analytics (SaaS), look at your SEC device details to determine what ports it is actually using to receive events.

To find the port numbers the SEC uses:

Procedure


Step 1

From the left pane, click Administration > Integrations > Firewall Management Center and then click the Secure Connectors tab.

Step 2

In the Secure Connectors page, select the SEC you want to send events to.

Step 3

In the Details pane, you will see the TCP, UDP, and NetFlow (NSEL) port you should send events to.


About Security Analytics and Logging (SaaS) in Security Cloud Control

Terminology Note: In this documentation, when Cisco Security Analytics and Logging is used with the Secure Cloud Analytics portal (a software as a service product) you will see this integration referred to as Cisco Security Analytics and Logging (SaaS) or SAL (SaaS).

Cisco Security Analytics and Logging (SAL) allows you to capture connection, intrusion, file, malware, security intelligence, syslog, and Netflow Secure Event Logging (NSEL) events from all of your ASA and Secure Firewall Threat Defense devices and view them in one place in Security Cloud Control. The events are stored in the Cisco cloud and viewable from the Event Logging page in Security Cloud Control, where you can filter and review them to gain a clear understanding of what security rules are triggering in your network.

With additional licensing, after you capture these events, you can cross-launch from Security Cloud Control to a Secure Cloud Analytics portal provisioned for you. Secure Cloud Analytics is a software as a service (SaaS) solution that tracks the state of your network by performing a behavioral analysis on events and network flow data. By gathering information about your network traffic from sources including firewall events and network flow data, it creates observations about the traffic and automatically identifies roles for network entities based on their traffic patterns. Using this information combined with other sources of threat intelligence, such as Talos, Secure Cloud Analytics generates alerts, which constitute a warning that there is behavior that may be malicious in nature. Along with the alerts, Secure Cloud Analytics provides network and host visibility, and contextual information it has gathered to provide you with a better basis to research the alert and locate sources of malicious behavior.

Event Types in Security Cloud Control

When filtering the security events logged in Secure Logging Analytics (SaaS), you can choose from a list of ASA, FTD, and event types that Security Cloud Control supports. From the Security Cloud Control menu, navigate Analytics > Event Logging and click the filter icon to choose events. These event types represent groups of syslog IDs. The table that follows shows which syslog IDs are included in which event type. To learn more about a specific syslog ID, you can search for it in the Cisco ASA Series Syslog Messages or the Cisco Secure Firewall Threat Defense Syslog Messages guides.

Some syslog events have the additional attribute "EventName." You can filter the events table to find events using the EventName attribute by filtering by attribute:value pairs. See Event Name Attributes for Syslog Events.

Some syslog events will have the additional attributes "EventGroup" and "EventGroupDefinition". You will be able to filter the events table to find events using these additional attributes by filtering by attribute:value pairs. See EventGroup and EventGroupDefinition Attributes for Some Syslog Messages.

The NetFlow events are different from syslog events. The NetFlow filter searches for all NetFlow event IDs that resulted in an NSEL record. Those NetFlow event IDs are defined in the Cisco ASA NetFlow Implementation Guide.

The following table describes the event types that Security Cloud Control supports and lists the syslog or NetFlow event numbers that correspond to the event types:

Filter Name

Description

Corresponding Syslog Event or Netflow Event

AAA

These are events that the system generates when failed or invalid attempts happen to authenticate, authorize, or use up resources in the network, when AAA is configured.

109001-109035

113001-113027

BotNet

These events get logged when a user attempts to access a malicious network, which might contain a malware-infected host, possibly a BotNet, or when the system detects traffic to or from a domain or an IP address in the dynamic filter block list.

338001-338310

Failover

These events get logged when the system detects errors in stateful and stateless failover configurations or errors in the secondary firewall unit when a failover occurs.

101001-101005, 102001, 103001-103007, 104001-104004, 105001-105048

210001-210022

311001-311004

709001-709007

Firewall Denied

These events get generated when the firewall system denies traffic of a network packet for various reasons, ranging from a packet drop because of the security policy to a drop because the system received a packet with the same source IP and destination IP, which could potentially mean an attack on the network.

Firewall Denied events may be contained in a NetFlow and may be reported with NetFlow event IDs as well as syslog IDs.

106001, 106007, 106012, 106013, 106015, 106016, 106017, 106020, 106021, 106022, 106023, 106025, 106027

Firewall Traffic

These are events that get logged depending on the various connection attempts in the network, user identities, time stamps, terminated sessions, and so on.

Firewall Traffic events may be contained in a NetFlow and may be reported with NetFlow event IDs as well as syslog IDs.

106001-106100, 108001-108007, 110002-110003

201002-201013, 209003-209005, 215001

302002-302304, 302022-302027, 303002-303005, 313001-313008, 317001-317006, 324000-324301, 337001-337009

400001-400050, 401001-401005, 406001-406003, 407001-407003, 408001-408003, 415001-415020, 416001, 418001-418002, 419001-419003, 424001-424002, 431001-431002, 450001

500001-500005, 508001-508002

607001-607003, 608001-608005, 609001-609002, 616001

703001-703003, 726001

IPsec VPN

These events are logged in an IPsec VPN-configured firewall when mismatches occur in IPsec security associations or when the system detects an error in the IPsec packets it receives.

402001-402148, 602102-602305, 702304-702307

NAT

These events are logged in a NAT-configured firewall when NAT entries are created or deleted and when all the addresses in a NAT pool are used up and exhausted.

201002-201013, 202001-202011, 305005-305012

SSL VPN

These events are logged in an SSL VPN-configurated firewall when WebVPN sessions get created or terminated, user access errors, and user activities.

716001-716060, 722001-722053, 723001-723014, 724001-724004, 725001-725015

NetFlow

These events are logged around the IP network traffic as network packets enter and exit the interfaces, timestamps, user identities, and the amount of data transferred.

0, 1, 2, 3, 5

Connection

You can generate events for connections as users generate traffic that passes through the system. Enable connection logging on access rules to generate these events. You can also enable logging on Security Intelligence policies and SSL decryption rules to generate connection events.

Connection events contain data about the detected sessions. The information available for any individual connection event depends on several factors, but in general includes:

  • Basic connection properties: timestamp, source and destination IP address, ingress and egress zones, the device that handled the connection, and so on.

  • Additional connection properties discovered or inferred by the system: applications, requested URLs, or users associated with the connection, and so on.

  • Metadata about why the connection was logged: which configuration handled the traffic, whether the connection was allowed or blocked, details about encrypted and decrypted connections, and so on.

430002, 430003

Intrusion

The system examines the packets that traverse your network for malicious activity that could affect the availability, integrity, and confidentiality of a host and its data. When the system identifies a possible intrusion, it generates an intrusion event, which is a record of the date, time, type of exploit, and contextual information about the source of the attack and its target. Intrusion events are generated for any intrusion rule set to block or alert, regardless of the logging configuration of the invoking access control rule.

430001

File

File events represent files that the system detected, and optionally blocked, in network traffic based on your file policies. You must enable file logging on the access rule that applies the file policy to generate these events.

When the system generates a file event, the system also logs the end of the associated connection regardless of the logging configuration of the invoking access control rule.

430004

Malware

The system can detect malware in network traffic as part of your overall access control configuration. AMP for Firepower can generate a malware event, containing the disposition of the resulting event, and contextual data about how, where, and when the malware was detected. You must enable file logging on the access rule that applies the file policy to generate these events.

The disposition of a file can change, for example, from clean to malware or from malware to clean. If AMP for Firepower queries the AMP cloud about a file, and the cloud determines the disposition has changed within a week of the query, the system generates retrospective malware events.

430005

Security Intelligence

Security Intelligence events are a type of connection event generated by the Security Intelligence policy for each connection that is blocked or monitored by the policy. All Security Intelligence events have a populated Security Intelligence Category field.

For each of these events, there is a corresponding "regular" connection event. Because the Security Intelligence policy is evaluated before many other security policies, including access control, when a connection is blocked by Security Intelligence, the resulting event does not contain the information that the system would have gathered from subsequent evaluation, for example, user identity.

430002, 430003

Security Analytics and Logging license and Data Storage Plans

To obtain Security Analytics and Logging entitlement, you can purchase one of the following licenses:

  • Security Cloud Control Device License Subscription with Unlimited Logging: This license combines Cisco Defense Orchestrator management license for managing Cisco firewalls device with unlimited volume of event logging. By default, 90 days of storage retention is available with this license. You have the option to extend log retention period to 1, 2, or 3 years by purchasing additional data retention extension licenses.

  • Cisco Logging and Troubleshooting License Subscription: This license supports logging 1 GB volume per day with 90 days of storage retention. You can extend log retention to 1, 2, or 3 years by purchasing additional data retention extension licenses.

For more information, see About Security Cloud Control Licenses.

You need to purchase a data storage plan that corresponds to the volume of events the Cisco cloud receives from your onboarded security devices on a daily basis. This volume is referred to as your daily ingest rate. Data plans are available in whole number amounts of GB/day and in 1-, 3-, or 5-year terms. The most effective method to determine your ingest rate is to participate in a free trial of Secure Logging Analytics (SaaS) before making a purchase. This trial will provide an accurate estimate of your event volume.

With Security Cloud Control device license subscription, you receive 90 days of rolling data storage. This policy ensures that the most recent 90 days of events are stored in the Cisco cloud, and data older than 90 days is deleted.

You have the option to upgrade to additional event retention beyond the default 90 days or to increase daily volume (GB/day) through a change order to an existing subscription. Billing for these upgrades will be prorated for the remainder of the subscription term.

See the Subscriptions section of Guidelines for Quoting Secruity Cloud Control Products for more information about the storage and subscription plans.


Note


If you have a Security Analytics and Logging license and data plan, then obtain a different Security Analytics and Logging license, you are not required change your data plan. Similarly, if your network traffic throughput changes and you obtain a different data plan, this change alone does not require you to obtain a different Security Analytics and Logging license.


What data gets counted against my allotment?

All events sent to the Secure Event Connector accumulate in the Secure Logging Analytics (SaaS) cloud and count against your data allotment.

Filtering what you see in the events viewer does not decrease the number of events stored in the Secure Logging Analytics (SaaS) cloud, it reduces the number of events you can see in the events viewer.

We're using up our storage allotment quickly, what can we do?

Here are two approaches to address that problem:

  • Request more storage.

  • Consider reducing the number of rules that log events. You can log events from SSL policy rules, security intelligence rules, access control rules, intrusion policies, and file and malware policies. Review what you are currently logging to determine if it is necessary to log events from as many rules and policies.

View Security Analytics and Logging License Information

View your Security Analytics and Logging license information such as the entitled monthly storage limit and the event storage retention period. If you do not have a separate Security Analytics and Logging license and data plan, the 90-day rolling data storage details appear in the licensing information.

Procedure


Step 1

From the left navigation bar, click Administration > Logging Settings.

Step 2

Click the View Logging Storage Usage button.

Tip


Alternatively, navigate to Events & Logs > Events > Event Logging from the left navigation bar, and then click the Storage Utilization button to view the Security Analytics and Logging license information.


Extend Event Storage Duration and Increase Event Storage Capacity

To extend your rolling event storage or increase the amount of event cloud storage, do the following steps:

Procedure


Step 1

Log in to your account on Cisco Commerce.

Step 2

Select your Security Cloud Control PID.

Step 3

Follow the prompts to upgrade the length or capacity of your storage capacity.

The increased cost will be pro-rated based for the term remaining on your existing license. See the Guidelines for Quoting Cisco Defense Orchestrator Products for detailed instructions.


View Security Analytics and Logging Alerts

View alerts and notifications for the Security Analytics and Logging configurations and event settings for the managed firewall devices.

Procedure


Step 1

From the left navigation bar, click Administration > Logging Settings.

Step 2

Click the View Logging Storage Usage button.

Tip


Alternatively, navigate to Events & Logs > Events > Event Logging from the left navigation bar, and then click the Storage Utilization button to view the Security Analytics and Logging license information.

The Alerts and Notifications section displays alerts about the settings that impact event logging, enabling you to take action to resolve any issues. Some of these settings include:

  • Sending events to cloud setting is disabled.

  • Sending events to the cloud setting is disabled at device level.

  • Secure Event Connector becomes unavailable.

  • Increase in events ingestion rate.


View Security Analytics and Logging Storage Usage and Event Ingest Rate

View the current Security Analytics and Logging storage utilization and analyze event logging trends. You can analyze the storage utilization trends by event type, device type, and individual devices to gain deeper insights into storage utilization patterns. Use the data visualizations for quick and easy analysis, enabling you to assess the current storage capacity and take measures to reduce the logging rate if the storage utilization approaches the limits that are specified in your Security Analytics and Logging license.

Procedure


Step 1

From the left navigation bar, click Administration > Logging Settings.

Step 2

Click View Logging Storage Usage.

Tip


Alternatively, navigate to Events & Logs > Events > Event Logging from the left navigation bar, and then click the Storage Utilization button to view the Security Analytics and Logging storage usage and event ingestion trends.

Step 3

Use the following dashboards to customize and analyze the storage utilization and gain more insights into the event logging trends in your firewall deployment:

  • Usage Trends: Displays the event logging storage usage for the last 12 months. Hover over a bar to see the data usage for the corresponding month.

  • Events per second (EPS) trends: Displays the event ingest rate for the onboarded devices. Customize your events per second trends view for a specific time period or for a specific device to get more granular data. You can filter the data for the last 1 week, 2 weeks, 3 weeks, or 1 month.

    Note


    The device drop-down list displays the managed firewall devices that are sending events to the Cisco Security Cloud.

  • Utilization by event type trends: Displays event data storage used, in bytes per day, for different event types. Use this widget to monitor storage use by event types and identify surges, if any, or unusual changes in storage use for specific event types. This insight enables you to adjust logging settings for a specific event type and manage storage use.

  • Utilization by device type trends: Displays event data storage used, in bytes per day, for each managed device type. Use this widget to monitor storage use by the device type and identify surges, if any, or unusual changes in storage use for a specific type of device.

  • Utilization by device trends: Displays event data storage used, in bytes per day, for each security device that sends events to Security Cloud Control. This widget focuses on devices with storage use exceeding the average bytes per second value, showing only the top five devices to improve usability. Use this widget to monitor storage use for each device and identify surges or unusual changes. This insight allows you to adjust logging settings for specific devices and manage storage use effectively.


Deprovisioning Cisco Security Analytics and Logging (SaaS)

If you allow your Cisco Security Analytics and Logging (SaaS) paid license to lapse, you have a grace period of 90 days. If you renew your paid license during this grace period, there is no interruption in your service.

Otherwise, if you allow the 90-day grace period to elapse, the system purges all of your customer data. You can no longer view ASA, FTD, or events from the Event Logging page, nor have dynamic entity modeling behavioral analytics applied to your ASA, FTD, or events and network flow data.

About Security Analytics and Logging (SAL SaaS) for the ASA

Security Analytics and Logging (SaaS) allows you to capture all syslog events and Netflow Secure Event Logging (NSEL) from your ASA and view them in one place in Security Cloud Control.

The events are stored in the Cisco cloud and viewable from the Event Logging page in Security Cloud Control where you can filter and review them to gain a clear understanding of what security rules are triggering in your network. The Logging and Troubleshooting package gives you these capabilities.

With the Logging Analytics and Detection package (formerly Firewall Analytics and Logging package), the system can apply Secure Cloud Analytics dynamic entity modeling to your FTD events, and use behavioral modeling analytics to generate Secure Cloud Analytics observations and alerts. If you obtain a Total Network Analytics and Monitoring package, the system applies dynamic entity modeling to both your FTD events and your network traffic, and generates observations and alerts. You can cross-launch from Security Cloud Control to a Secure Cloud Analytics portal provisioned for you, using Cisco Single Sign-On.

How ASA Events are Displayed in the Security Cloud Control Events Viewer

Syslog events and NSEL events are generated when logging is enabled on the ASA, and network traffic matches access control rule criteria. After the events are stored in the Cisco cloud, you can view them in Security Cloud Control.

You can install multiple Secure Event Connectors (SECs) and send events generated by a rule, on any device, to any of the SECs as if it were a syslog server. The SEC then forwards the event to the Cisco cloud. Do not forward the same events to all of your SECs. You will be duplicating the events sent to the Cisco cloud and needlessly inflate your daily ingest rate.

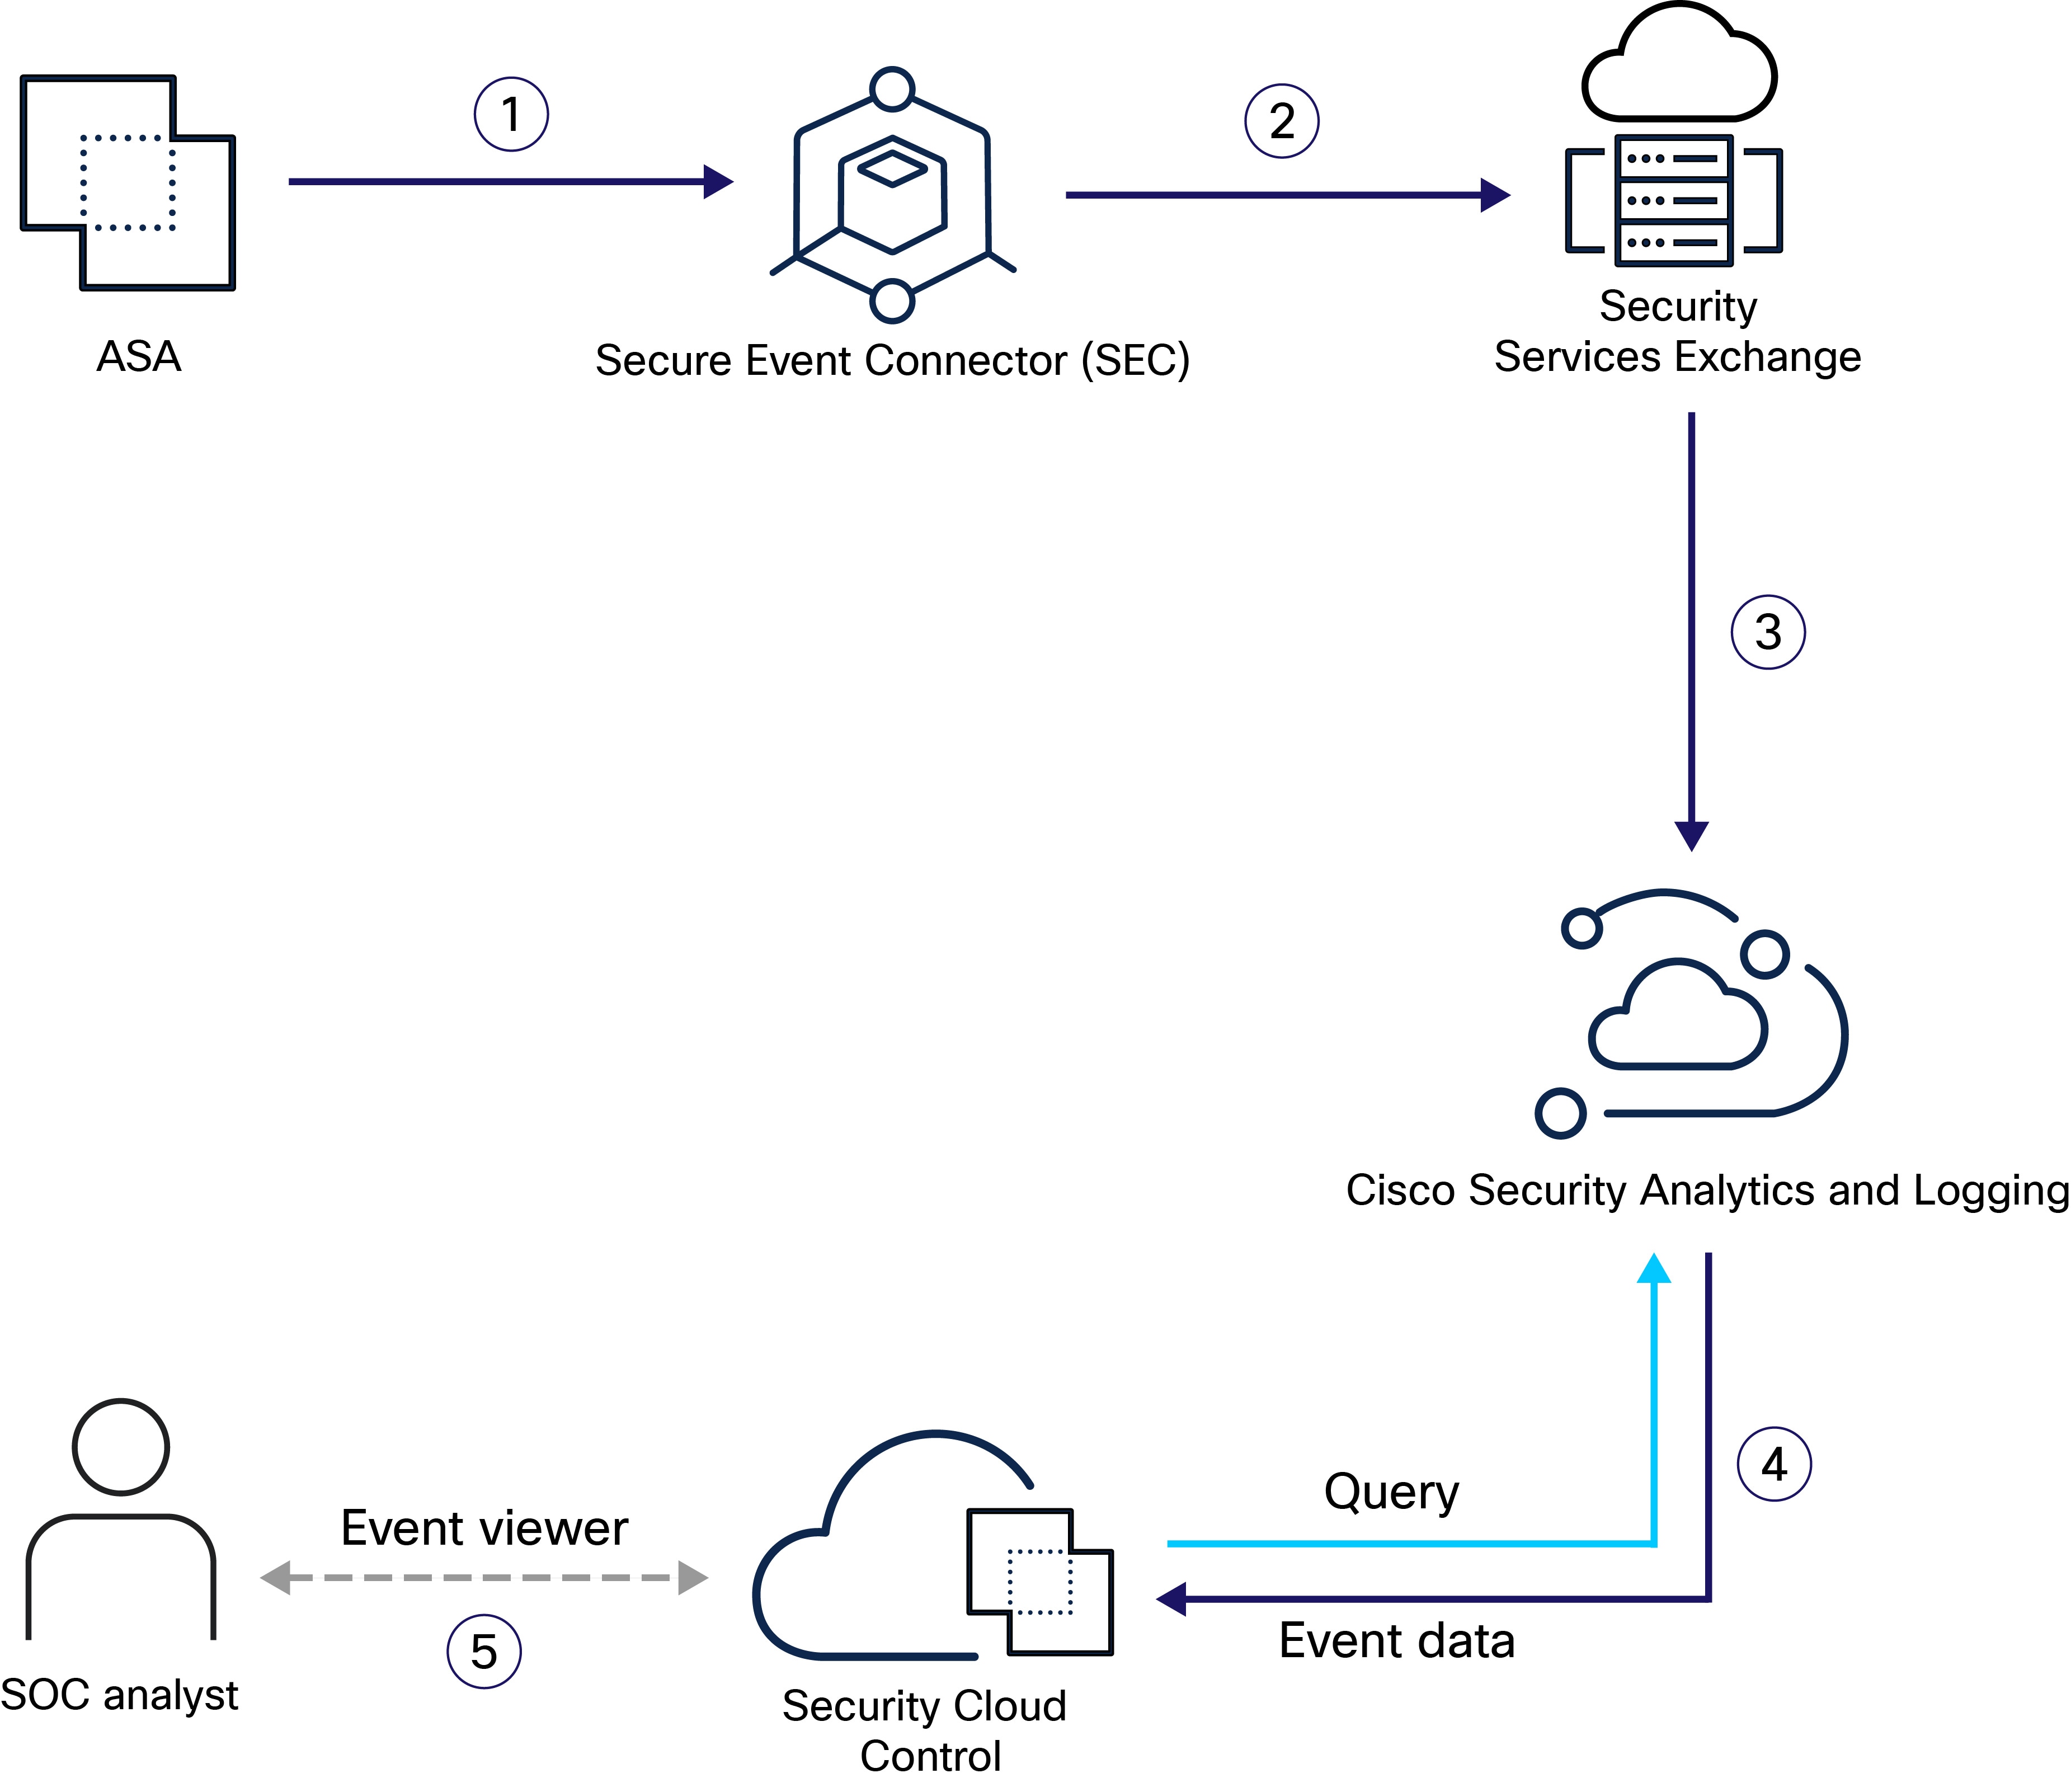
How Syslog and NSEL Events are Sent from an ASA to the Cisco Cloud by way of the Secure Event Connector

With the basic Logging and Troubleshooting license, this is how an ASA event reaches the Cisco cloud:

  1. You onboard your ASA to Security Cloud Control using username and password.

  2. You configure the ASA to forward syslog and NSEL events to any one of your SECs as if they were syslog servers and enable logging on the device.

  3. The SEC forwards the events to the Cisco cloud where the events are stored.

  4. Security Cloud Control displays events from the Cisco cloud in its Events Viewer based on the filters you set.

With the Logging Analytics and Detection or Total Network Analytics and Monitoring license, the following also occur:

  1. Cisco Secure Cloud Analytics applies analytics to the ASA syslog events stored in the Cisco cloud.

  2. Generated observations and alerts are accessible from the Secure Cloud Analytics portal associated with your Security Cloud Control portal.

  3. From the Security Cloud Control portal, you can cross-launch your Secure Cloud Analytics portal to review these observations and alerts.

Componets Used in the Solution

Secure Device Connector (SDC)-The SDC connects Security Cloud Control to your ASAs. The login credentials for the ASA are stored on the SDC.

See Secure Device Connector for more information.

Secure Event Connector (SEC)-The SEC is an application that receives events from your ASAs and forwards them to the Cisco cloud. Once in the Cisco cloud, you can view the events on Security Cloud Control's Event Logging page or analyze them with Secure Cloud Analytics. Depending on your environment, the SEC is installed on a Secure Device Connector, if you have one; or on its own Security Cloud Control Connector virtual machine that you maintain in your network. See About Secure Event Connectors for more information.

Adaptive Security Appliance (ASA)-The ASA provides advanced stateful firewall and VPN concentrator functionality as well as integrated services with add-on modules. The ASA includes many advanced features, such as multiple security contexts (similar to virtualized firewalls), clustering (combining multiple firewalls into a single firewall), transparent (Layer 2) firewall or routed (Layer 3) firewall operation, advanced inspection engines, IPsec VPN, SSL VPN, and clientless SSL VPN support, and many more features.

Secure Cloud Analytics applies dynamic entity modeling to ASA events, generating detections based on this information. This provides a deeper analysis of telemetry gathered from your network, allowing you to identify trends and examine anomalous behavior in your network traffic. You would make use of this service if you have a Logging Analytics and Detection or Total Network Analytics and Monitoring license.

Licensing

To configure this solution you need the following accounts and licenses:

  • Security Cloud Control. You must have a Security Cloud Control tenant.

  • Secure Device Connector. There is no separate license for a Secure Device Connector.

  • Secure Event Connector. There is no separate license for a Secure Event Connector.

  • Secure Logging Analytics (SaaS). See the Security Analytics and Logging License table.

  • Adaptive Security Appliance (ASA). Base license or higher.

Security Analytics and Logging Licensing

In order to implement Security Analytics and Logging (SaaS), you need to purchase one of these licenses:

License Name

Provided Functionality

Available License Durations

Functionality Prerequisites

Logging and Troubleshooting

  • View ASA events and event detail within Security Cloud Control, both as a live feed and as a historical view

  • 1 year

  • 3 years

  • 5 years

  • Security Cloud Control

  • An on-premises ASA deployment running software version 9.6 or greater.

  • Deployment of one or more SECs to pass ASA events to the Cisco cloud.

Logging Analytics and Detection (formerly Firewall Analytics and Monitoring)

Logging and Troubleshooting functionality, plus:

  • Apply dynamic entity modeling and behavioral analytics to your events.

  • Open alerts in Secure Cloud Analytics based on event data, cross-launching from the Security Cloud Control event viewer.

  • 1 year

  • 3 years

  • 5 years

  • Security Cloud Control

  • An on-premises ASA deployment running software version 9.6 or greater

  • Deployment of one or more SECs to pass ASA events to the Cisco cloud.

  • A newly provisioned or existing Cisco Secure Cloud Analytics portal.

Total Network Analytics and Monitoring

Logging Analytics and Detection, plus:

  • Apply dynamic entity modeling and behavioral analytics to ASA events, on-premises network traffic, and cloud-based network traffic

  • Open alerts in Cisco Secure Cloud Analytics based on the combination of ASA event data, on-premises network traffic flow data collected by Cisco Secure Cloud Analytics sensors, and cloud-based network traffic passed to Cisco Secure Cloud Analytics, cross-launching from the Security Cloud Control event viewer.

  • 1 year

  • 3 years

  • 5 years

  • Security Cloud Control

  • An on-premises ASA deployment running software version 9.6 or greater

  • Deployment of one or more SECs to pass events to the Cisco cloud.

  • Deployment of at least one Cisco Secure Cloud Analytics sensor version 4.1 or greater to pass network traffic flow data to the cloud OR integrating Cisco Secure Cloud Analytics with a cloud-based deployment, to pass network traffic flow data to Cisco Secure Cloud Analytics.

  • A newly provisioned or existing Cisco Secure Cloud Analytics portal.

Data Plans

You need to buy a data plan that reflects the number of events the Cisco cloud receives from your on-boarded ASAs on a daily basis. This is called your "daily ingest rate." You can use the Logging Volume Estimator Tool to estimate your daily ingest rate and as that rate changes you can update your data plan.

Data plans are available in 1 GB daily volumes increments, and in 1, 3 or 5 year terms. See the Secure Logging Analytics (SaaS) Ordering Guide for information about data plans.


Note


If you have a Security Analytics and Logging license and data plan, then obtain a different license at a later date, that alone does not require you to obtain a different data plan. If your network traffic throughput changes and you obtain a different data plan, that alone does not require you to obtain a different Security Analytics and Logging license.


30-day Free Trial

You can request a 30-day risk-free trial by logging in to Security Cloud Control and navigating Events & Logs > Events > Event Logging tab. On completion of the 30-day trial, you can order the desired event data volume to continue the service from Cisco Commerce Workspace (CCW), by following the instructions in the Secure Logging Analytics (SaaS) ordering guide.

Next Step

Go to Implementing Secure Logging Analytics (SaaS) for ASA Devices

Implementing Secure Logging Analytics (SaaS) for ASA Devices

Before you Begin

Workflow to Implement Cisco Security Analytics and Logging (SaaS) and Send Events through the Secure Event Connector to the Cisco Cloud

  1. Be sure to review "Before you Begin" above to make sure your environment is properly configured.

  2. Onboard ASA Device to Security Cloud Control using username and password.

  3. Send ASA Syslog Events to the Cisco Cloud.

  4. Configuring NSEL for ASA Devices Using a Security Cloud Control Macro.

  5. Confirm events are visible in Security Cloud Control. From the navigation bar, select Events & Logs > Events > Event Logging. Click the Live tab to view live events.

  6. If you have a Firewall Analytics and Monitoring or Total Network Analytics and Monitoring license, continue with the next section, Analyzing Events with Cisco Secure Cloud Analytics.

Analyzing Events with Cisco Secure Cloud Analytics

If you have a Firewall Analytics and Monitoring or Total Network Analytics and Monitoring license, perform the following in addition to the previous steps:

  1. Provision a Cisco Secure Cloud Analytics Portal.

  2. Deploy one or more Secure Cloud Analytics sensors to your internal network if you purchased a Total Network Analytics and Monitoring license. See Cisco Secure Cloud Analytics Sensor Deployment for Total Network Analytics and Reporting.

  3. Invite users to create Secure Cloud Analytics user accounts, tied to their Cisco Single Sign-On credentials. See Viewing Cisco Secure Cloud Analytics Alerts from Security Cloud Control.

  4. Cross-launch from Security Cloud Control to Secure Cloud Analytics to monitor the Secure Cloud Analytics alerts generated from FTD events. See Viewing Cisco Secure Cloud Analytics Alerts from Security Cloud Control.

Reviewing Cisco Secure Cloud Analytics Alerts by Cross-launching from Security Cloud Control

With a Firewall Analytics and Monitoring or Total Network Analytics and Monitoring license, you can cross-launch from Security Cloud Control to Secure Cloud Analytics to review the alerts generated by FTD events.

Review these articles for more information:

Troubleshooting Secure Event Connector Issues

Use these troubleshooting topics to gather status and logging information about

Workflows

Troubleshooting Using Security and Analytics Logging Events describes using the events generated from Cisco Security Analytics and Logging to determine why a user can't access a network resource.

See also Working with Alerts Based on Firepower Threat Defense Events.

Send ASA Syslog Events to the Cisco Cloud using a Security Cloud Control Macro

You can configure all your ASAs to send events to the Cisco cloud by creating a Security Cloud Control Macro that uses all the commands described in Send ASA Syslog Events to the Cisco Cloud Using the Command Line Interface and running that macro on all your ASA in the same batch.

Security Cloud Control's Macro tool allows you to assemble a list of CLI commands, turn elements of the command syntax into parameters, and then save the list of commands so that it can be used more than once. Macros can also be run on more than one device at a time.

Using proven macros promotes configuration consistencies between devices and prevents syntax errors that can occur when using the command line interface.

Before you read further, review macros in Security Cloud Control configuration guide so that you understand the mechanics of using macros. This article will only describe assembling the final macro.

Creating an ASA Security Analytics and Logging (SaaS) Macro

There are two types of formatting you'll see in the following procedure, ASA CLI commands and macro formatting. The ASA CLI commands are written to follow ASA syntax conventions. See Use command line interface for more information about using the CLI in Security Cloud Control.

Before you begin, open Send ASA Syslog Events to the Cisco Cloud in a separate window and read it in parallel with this procedure so you can read the command descriptions as you create your macros.


Note


If a logging config is already in place on the ASA, running the macro from Security Cloud Control will not first clear out all of the existing logging config. Rather, the settings defined in the Security Cloud Control macro will merge into whatever might already be in place.


Procedure


Step 1

Open a plain text editor and create a list of commands you are going to turn into a macro, based on the instructions and options below. Security Cloud Control will execute the commands in the order they are written in the macro. Some command will have values that you turn into {{parameters}} that you will fill in when it comes time to run the macro.

Step 2

Configure the ASA to send messages to an SEC as if it were a syslog server.

Use the logging host command to specify the SEC as the syslog server you send messages to. You can send events to any one of the SECs you have onboarded to your tenant.

The logging host command specifies a TCP or UDP port to send events to. See Finding Your Device's TCP, UDP, and NSEL Port Used for Cisco Security Analytics and Logging to determine what ports you should use.

logging hostinterface_nameSEC_IP_address{ tcp/port| udp/port}

Turn this command into one of two different macros depending on what protocol you use to send syslog events to the SEC:

logging host {{interface_name}} {{SEC_ip_address}} tcp/{{port_number}}

logging host {{interface_name}} {{SEC_ip_address}} udp/{{port)_number}}

(Optional) If you use TCP, you can add this command to your list of commands in your macro. It does not need any parameters.

logging permit-hostdown

Step 3

Specify which syslog messages should be sent to the syslog server.

Use the logging trap command to specify which syslog messages should be sent to the syslog server:

logging trap{ severity_level| message_list}

If you want to define the events sent to the SEC by severity level, turn the command into this macro:

logging trap {{severity_level}}

If you only want to send events to the SEC that are part of a message list, turn the command into this macro:

logging trap {{message_list_name}}

If you chose the logging trap message_list command in the previous step, you need to define the syslogs in your message list. Open Create a Custom Event List so you can read the command descriptions as you create the macro. Start with this command:

logging listname{ levellevel[ classmessage_class]| messagestart_id[ -end_id]}

And break it down into these variations:

logging list {{message_list_name}} level {{security_level}}

logging list {{message_list_name}} level {{security_level}} class {{message_class}}

logging list {{message_list_name}} message {{syslog_range_or_number}}

In the last variation, the message parameter {{syslog_range_or_number}} could be entered as a single syslog ID, 106023, or a range, 302013-302018. Use one or more of the command variations in as many lines as you like to create your message list. Keep in mind that, in a single macro, all parameters with the same name will use the same value you enter. Security Cloud Control will not run a macro with empty parameters.

Important


The logging list command has to come before the logging trap command in your macro. You define the list first and then the logging trap command can use it. See the sample macro below.

Step 4

(Optional) Add the syslog timestamp. Add this command if you want to add the date and time to the message that the syslog message originated on the ASA. The timestamp value is displayed in the SyslogTimestamp field. Add this command to your list of commands, it will not need any parameters:

logging timestamp

Note


Beginning with version 9.10(1), ASA provides the option to enable timestamp as per RFC 5424 in eventing syslogs. When this option is enabled, all timestamp of syslog messages would be displaying the time as per RFC 5424 format. Following is a sample output with RFC 5424 format:

 <166>2018-06-27T12:17:46Z asa : %ASA-6-110002: Failed to locate egress interface for protocol from src interface :src IP/src port to dest IP/dest port
.

Step 5

(Optional) Include a device ID in non-EMBLEM format syslog messages. Open Include the Device ID in Non-EMBLEM Format Syslog Messages so you can read the command descriptions as you create the macro. This is the CLI command you will base your macro on:

logging device-id{ cluster-id| context-name| hostname| ipaddress interface_name [ system]| stringtext}

And break it down into these variations:

logging device-id cluster-id

logging device-id context-name

logging device-id hostname

logging device-id ipaddress {{interface_name}} system

logging device-id string {{text_16_char_or_less}}

Step 6

Enable logging. Add this command to your macro as it is. It does not have any parameters:

logging enable

Step 7

Do not add write memory to the last line of the macro. Add the show running-config logging command instead to review the results of the logging commands you entered before committing them to the ASA's startup config.

show running-config logging

Step 8

After you are confident your configuration changes were made, you can create a separate macro for the write memory command or use Security Cloud Control's Bulk Command Line Interface tool to issue the command to all the devices you configured using your macro.

write memory

Step 9

(Optional) Enable logging on access control rule "permit" events. This step in the described in the Send ASA Syslog Events to the Cisco Cloud procedure but it is not included in this macro. It is performed in the Security Cloud Control GUI instead.

Step 10

Save the macro.


Example

Here is a sample of a list of commands combined into a single macro:


logging host {{interface_name}} {{SEC_ip_address}} {{tcp_or_udp}}/{{port_number}} 
logging permit-hostdown 
logging list {{message_list_name}} level {{security_level}} 
logging list {{message_list_name}} message {{syslog_range_or_number_1}} 
logging list {{message_list_name}} message {{syslog_range_or_number_2}} 
logging trap {{message_list_name}} 
logging device-id cluster-id 
logging enable 
show running-config logging 

Note


There are several logging list commands to add different specific syslog IDs or ranges. The {{syslog_range_or_number_X}} parameter requires a number or some other differentiator, otherwise their values will all be the same when the macro is filled in. Also keep in mind that Security Cloud Control will not run a macro if not all the parameters are given a value, so only include the commands in the macro you want to execute. We do want all the syslog IDs contained in the same list so event_list_name stays the same for in each line.


What to do next

Run the Macro

After you have created and saved the ASA Security Analytics and Logging Macro, run the macro to send ASA syslog events to the Cisco cloud.

Send ASA Syslog Events to the Cisco Cloud Using the Command Line Interface

This procedure explains how to forward ASA syslog events to a Secure Event Connector (SEC) and then enable logging. These procedures explain only what is needed to complete that workflow. For a broader discussion of all the ways you can configure logging on the ASA, see the Monitoring chapter of either ASDM1: Cisco ASA Series General Operations ASDM Configuration Guide or CLI Book 1: Cisco ASA Series General Operations CLI Configuration Guide.

Limitations on Supported ASA Commands

Security Cloud Control does not yet support these syslog commands or message formats:

  • EMBLEM format for syslogs

  • Secure Syslogs

Security Cloud Control Command Line Interface for ASA

For all the tasks in this procedure, you will be working on the Security Cloud Control's command line interface for ASA. To open the command line interface page:

Procedure


Step 1

From the left navigation bar, click Security Devices.

Step 2

Click the Devices tab.

Step 3

Click the appropriate device type tab and select the ASA for which you want to enable logging.

Step 4

In the Device Actions pane on the right, click >_ Command Line Interface.

Step 5

Click the Command Line Interface tab. You are now ready to enter the commands described below at the prompt.

After entering every command, you will click Send. Because Security Cloud Control's CLI Interface is a direct connection to the ASA, the command is written to the device's running configuration immediately. For changes to be written to the ASA's startup configuration, you need to issue the write memory command in addition.


Forward ASA Syslog Events to the Secure Event Connector

To forward ASA syslog events to one of the Secure Event Connectors (SECs) you have onboarded and then enable logging, you need complete these tasks in the procedure that follows.

Procedure


Step 1

Configure the ASA to send messages to the SEC as if it were a syslog server.

Step 2

Decide what severity level of all logs, or what list of syslog events, you want to send to the SEC.

Step 3

Enable logging.

Step 4

Save the changes to the ASA's startup config.


Send ASA Syslog Events to the Cisco Cloud Using CLI

Procedure


Step 1

Configure the ASA to send messages to the SEC as if it were a syslog server

When sending syslog events from the ASA to the Cisco cloud, you forward them to the SEC as if it were an external syslog server, and it forwards the messages to the Cisco cloud.

To send syslog messages to the SEC, perform the following steps:

  1. Configure the ASA to send messages, using TCP or UDP, to the SEC as if it were a syslog server. The SEC can use an IPv4 or IPv6 addresss. You will be sending events to either a TCP or UDP port. See Finding Your Device's TCP, UDP, and NSEL Port Used for Cisco Security Analytics and Logging to determine what ports you should use.

    Here is an example of the logging host command syntax:

    logging host interface_name SEC_IP_address [[ tcp/port ]|[ udp/port ]]

    Examples:

    
     > logging host mgmt 192.168.1.5 tcp/10125 
    > logging host mgmt 192.168.1.5 udp/10025 
    > logging host mgmt 2002::1:1 tcp/10125 
    > logging host mgmt 2002::1:1 udp/10025 
    • The interface_name argument specifies the ASA interface from which messages are sent to the syslog server. It is a "best practice" to send the syslog messages to the SDC over the same ASA interface already in use for communication with the SDC.

    • The SEC_IP_address argument should contain the IP address of the VM on which the SEC is installed.

    • The tcp/port or udp/port keyword-argument pair specifies that syslog messages should be sent using either TCP protocol and relevant port, or the UDP protocol and relevant port. You can configure the ASA to send data to a syslog server using either UDP or TCP, but not both. The default protocol is UDP if you do not specify a protocol.

      If you specify TCP, the ASA will discover syslog server failures and as a security protection, new connections through the ASA are blocked. To allow new connections regardless of connectivity to a TCP syslog server, see step b. If you specify UDP, the ASA continues to allow new connections whether or not the syslog server is operational. Valid port values

      Note


      If you want to send ASA messages to two separate syslog servers, you can run a second logging host command with the appropriate interface, IP address, protocol and port of the other syslog server.

  2. (Optional) If you send events to the SEC over TCP, and if either the SEC is down or the log queue on the ASA is full, then new connections are blocked. New connections are allowed again after the syslog server is back up and the log queue is no longer full. To allow new connections regardless of connectivity to a TCP syslog server, disable the feature to block new connections when a TCP-connected syslog server is down using this command:

    logging permit-hostdown

    Example:

     > logging permit-hostdown 

Step 2

Specify which syslog messages should be sent to the syslog server with the following command:

logging trap { severity_level | message_list }

Examples:

> logging trap 3 
> logging trap asa_syslogs_to_cloud 

You can specify the severity level number (1 through 7) or name. For example, if you set the severity level to 3, then the ASA sends syslog messages for severity levels 3, 2, and 1.

The message_list argument is replaced with the name of a custom event list, if you have created one. When specifying a custom event list, you only send the syslog messages that are in that list to the Secure Event Connector. In the example above, asa_syslogs_to_cloud is the name of the event list.

Using a message_list could save you money by tightly defining which syslog messages are sent to the Cisco cloud.

See Create a Custom Event List to create a message_list. See Security Analytics and Logging Event Storage for more information about data ingest and storage costs.

Step 3

(Optional) Add the syslog timestamp

Add the date and time that the syslog message originated on the ASA to the message using the logging timestamp command. The timestamp value is displayed in the SyslogTimestamp field.

Example:

> logging timestamp 

Note


Beginning with version 9.10(1), ASA provides the option to enable timestamp as per RFC 5424 in eventing syslogs. When this option is enabled, all timestamp of syslog messages would be displaying the time as per RFC 5424 format. Following is a sample output with RFC 5424 format:

<166>2018-06-27T12:17:46Z asa : %ASA-6-110002: Failed to locate egress interface for protocol from src interface :src IP/src port to dest IP/dest port. 

Step 4

(Optional) Include a device ID in non-EMBLEM format syslog messages

A device ID is an identifier you can insert in a syslog message that will help you easily distinguish all syslog messages sent from a particular ASA. See Include the Device ID in Non-EMBLEM Format Syslog Messages for instructions.

Step 5

(Optional) Enable logging on access control rule "permit" events

When an access control rule denies access to a resource, the event is automatically logged. If you also want to log events generated when an access control rule allows access to a resource, you need to turn on logging for the access control rule and configure a severity type. See Log Rule Activity for instructions on how to turn on logging for an individual network access control rule.

Note


Enabling logging on access control rule "permit" events will use-up more of your purchased data plan as it is based on your daily ingest rate of events.

Step 6

Enable logging

At the command prompt, type logging enable. On the ASA, logging is enabled for the entire device, not for individual rules.

Example:

 > logging enable 

Note


At this time, Security Cloud Control does not support enabling secure logging.

Step 7

Save your Changes to the Startup Config

At the command prompt, type write memory. On the ASA, logging is enabled for the entire device, not for individual rules.

Example:

> write memory 

Create a Custom Event List

Create a custom event list when you are sending ASA syslog events to the Cisco Cloud using one of these methods:

You can create an event list, also referred to as a message_list, based on the following three criteria:

  • Event Class

  • Severity

  • Message ID

To create a custom event list to send to a specific logging destination (for example, a syslog server or a Secure Event Connector), perform the following steps:

Procedure


Step 1

From the left navigation bar, click Security Devices.

Step 2

Click the Devices tab.

Step 3

Click the appropriate tab and select the ASA whose syslog messages you want to include in a custom event list.

Step 4

In the Device Actions pane, click >_ Command Line Interface.

Step 5

Use this command syntax to issue the logging list command to the ASA:

logging list name { level level [ class message_class ]| message start_id [ -end_id ]}

The name argument specifies the name of the list. The level level keyword and argument pair specify the severity level. The class message_class keyword-argument pair specify a particular message class. The message start_id [-end_id] keyword-argument pair specify an individual syslog message number or a range of numbers.

Note


Do not use the names of severity levels as the name of a syslog message list. Prohibited names include emergencies, alert, critical, error, warning, notification, informational, and debugging. Similarly, do not use the first three characters of these words at the beginning of an event list name. For example, do not use an event list name that starts with the characters "err."

  • Add syslog messages to the event list based on severity. For example, if you set the severity level to 3, then the ASA sends syslog messages for severity levels 3, 2, and 1.

    Example:

    > logging list asa_syslogs_to_cloud level 3 
  • Add syslog messages based on other criteria to the event list:

    Enter the same command as in the previous step, specifying the name of the existing message list and the additional criterion. Enter a new command for each criterion that you want to add to the list. For example, you can specify criteria for syslog messages to be included in the list as the following:

    • Syslog message IDs that fall into the range of 302013-302018.

    • All syslog messages with the critical severity level or higher (emergency, alert, or critical).

    • All HA class syslog messages with the warning severity level or higher (emergency, alert, critical, error, or warning).

      Example:

      > logging list asa_syslogs_to_cloud message 302013-302018 
      > logging list asa_syslogs_to_cloud level critical 
      > logging list asa_syslogs_to_cloud level warning class ha 

      Note


      A syslog message is logged if it satisfies any of these conditions. If a syslog message satisfies more than one of the conditions, the message is logged only once.

Step 6

Save your Changes to the Startup Config

At the command prompt, type write memory.

Example:

> write memory

Include the Device ID in Non-EMBLEM Format Syslog Messages

You can configure the ASA to include a device ID in non-EMBLEM-format syslog messages. You can specify only one type of device ID for syslog messages. This procedure is referred to by these procedures:

This device identifier will be reflected in the SensorID field of a syslog event displayed on the Event Logging page.

Procedure


Step 1

Select the ASA whose syslog messages you want to assign a device-id to.

Step 2

In the Device Actions pane, click >_ Command Line Interface.

Step 3

Use this command syntax to issue the logging device-id commands to the device.

logging device-id{ cluster-id| context-name| hostname| ipaddressinterface_name[ system]| stringtext}

Example:

> logging device-id hostname 
> logging device-id context-name 
> logging device-id string Cambridge 

The context-name keyword indicates that the name of the current context should be used as the device ID (applies to multiple context mode only). If you enable the logging device ID for the admin context in multiple context mode, messages that originate in the system execution space use a device ID of system, and messages that originate in the admin context use the name of the admin context as the device ID.

Note


In an ASA cluster, always use the primary unit IP address for the selected interface.

The cluster-id keyword specifies the unique name in the boot configuration of an individual ASA unit in the cluster as the device ID.

The hostname keyword specifies that the hostname of the ASA should be used as the device ID.

The ipaddress interface_name keyword-argument pair specifies that the interface IP address specified as interface_name should be used as the device ID. If you use the ipaddress keyword, the device ID becomes the specified ASA interface IP address, regardless of the interface from which the syslog message is sent. In the cluster environment, the system keyword dictates that the device ID becomes the system IP address on the interface. This keyword provides a single, consistent device ID for all syslog messages that are sent from the device.

The string text keyword-argument pair specifies that the text string should be used as the device ID. The string can include as many as 16 characters.

You cannot use blank spaces or any of the following characters:

  • & (ampersand)

  • ‘ (single quote)

  • " (double quote)

  • < (less than)

  • > (greater than)

  • ? (question mark)

Step 4

Save your Changes to the Startup Config

At the command prompt, type write memory.

Example:

  > write memory 

NetFlow Secure Event Logging (NSEL) for ASA Devices

Basic syslog messages from the ASA lack much of the data that Secure Cloud Analytics needs to determine if events reported by the ASA indicate a threat. Netflow Secure Event Logging (NSEL) provides the Secure Cloud Analytics with that data.

"A flow is defined as a unidirectional sequence of packets with some common properties that pass through a network device. These collected flows are exported to an external device, the NetFlow collector. Network flows are highly granular; for example, flow records include details such as IP addresses, packet and byte counts, timestamps, Type of Service (ToS), application ports, input and output interfaces, etc."1

The Cisco ASA supports NetFlow Version 9 services. The ASA implementation of NSEL provides a stateful, IP flow tracking method that exports only those records that indicate significant events in a flow. In stateful flow tracking, tracked flows go through a series of state changes.

This documentation describes a straight forward approach to configuring NetFlow for your ASAs using a Security Cloud Control macro. The Cisco ASA NetFlow Implementation Guide provides an extremely detailed discussion of configuring NetFlow on the ASA and you may find it a valuable resource to accompany this content.

What to do Next

Go to Configuring NSEL for ASA Devices Using a Security Cloud Control Macro.

Related Articles

1. ("Cisco Systems NetFlow Services Export Version 9." Internet Engineering Task Force, Network Working Group, Request for Comments: 3954, October 2004, B. Claise, Ed. https://www.ietf.org/rfc/rfc3954.txt)

Configuring NSEL for ASA Devices by Using a Security Cloud Control Macro

ASAs report detailed connection event data using Netflow Secure Event Logging (NSEL). You can apply Secure Cloud Analytics to this connection event data, which includes bidirectional flow statistics. This procedure describes how to configure NSEL on an ASA device and send those NSEL events to a flow collector. In this case, the flow collector is a Secure Event Connector (SEC).

This procedure refers to this macro, Configure NSEL:

 flow-export destination {{interface}} {{SEC_IPv4_address}} {{SEC_NetFlow_port}}
flow-export template timeout-rate {{timeout_rate_in_mins}}
flow-export delay flow-create {{delay_flow_create_rate_in_secs}}
flow-export active refresh-interval {{refresh_interval_in_mins}}
class-map {{flow_export_class_name}}
     match {{add_this_traffic_to_class_map}}
policy-map {{global_policy_map_name}}
     class {{flow_export_class_name}}
          flow-export event-type {{event_type}} destination {{SEC_IPv4_address}}
service-policy {{global_policy_map_name}} global
logging flow-export-syslogs disable
show run flow-export
show run policy-map {{global_policy_map_name}}
show run class-map {{flow_export_class_name}}

Here is an example of the Configure NSEL macro with all the default values filled in, a generic name for the class-map, and the class map added to the global_policy, When you are done with these procedures, your macro will resemble this:

 flow-export destination {{interface}} {{SEC_IPv4_address}} {{SEC_NetFlow_port}}
flow-export template timeout-rate 60
flow-export delay flow-create 55
flow-export active refresh-interval 1
class-map flow_export_class_map
     match any
policy-map global_policy
     class flow_export_class_map
          flow-export event-type all destination {{SEC_IPv4_address}}
logging flow-export-syslogs disable
show run flow-export
show run policy-map global_policy
show run class-map flow_export_class_map

Before you Begin

Gather the following information:

Workflow

Follow this workflow to configure NSEL for ASA devices by using a Security Cloud Control macro. You need to follow each step:

  1. Open the Configuring NSEL Macro.

  2. Define the Destination of NSEL Messages and the Interval at Which They Are Sent to the SEC.

  3. Create a Class-Map that Defines which NSEL Events Will Be Sent to the SEC.

  4. Define a Policy-Map for NSEL Events.

  5. Disable Redundant Syslog Messages.

  6. Review and Send the Macro.

What to do next

Begin the workflow above by going to Open the Configuring NSEL Macro.

Open the Configuring NSEL Macro

Before you begin
This is first part in a longer workflow, see Configuring NSEL for ASA Devices by Using a Security Cloud Control Macro before getting started.
Procedure

Step 1

On the Security Devices page, click the Devices tab.

Step 2

Click the appropriate device type tab and select the ASA(s) on which you want to configure NetFlow Secure Event Logging (NSEL).

Step 3

In the Device Actions pane, click Command Line Interface.

Step 4

Click the Macro star to show the list of available macros.

Step 5

From the list of macros, select Configuring NSEL.

Step 6

Under the Macro box, click View Parameters.


What to do next
Continue to Define the Destination of NSEL Messages and the Interval at Which They Are Sent to the SEC.

Define the Destination of NSEL Messages and the Interval at Which They Are Sent to the SEC

NSEL messages can be sent to any one of the SECs you have onboarded to your tenant. These instructions refer to this section of the macro:

flow-export destination {{interface}} {{SEC_IPv4_address}} {{SEC_NetFlow_port}}

flow-export template timeout-rate {{timeout_rate_in_mins}}

flow-export delay flow-create {{delay_flow_create_rate_in_secs}}

flow-export active refresh-interval {{refresh_interval_in_mins}}

Before you begin
This is part of a larger workflow. See Configuring NSEL for ASA Devices by Using a Security Cloud Control Macro before getting started.
Procedure

Step 1

The flow-export destination command defines the collector to which the NetFlow packets are sent. In this case, you are sending them to an SEC. Fill in the fields for these parameters:

  • {{interface}}-Enter the name of the interface on the ASA from which the NetFlow events are sent.

  • {{SEC_IPv4_address}}-Enter the IPv4 address of the SEC. The SEC functions as the flow collector.

  • {{SEC_NetFlow_port}}-Enter the UDP port number on the SEC to which NetFlow packets are sent.

Step 2

The flow-export template timeout-rate command specifies the interval at which template records are sent to all configured output destinations.

  • {{timeout_rate_in_mins}}-Enter the number of minutes before templates are resent. We recommend using a value of 60 minutes. The SEC does not process the templates. A large number reduces traffic to the SEC.

Step 3

The flow-export delay flow-create command delays the sending of flow-create events by the specified number of seconds. This value matches the recommended Active Timeout value and reduces the number of flow events exported from the ASA. At that rate, expect NSEL events to first appear in Security Cloud Control at the close of a connection or within 55 seconds of the creation of the connection, whichever happens earlier. If this command is not configured, there is no delay, and the flow-create event is exported as soon as the flow is created.

  • {{delay_flow_create_rate_in_secs}}-Enter the number of seconds delay between sending flow-create events. We recommend using a value of 55 seconds.

Step 4

The flow-export active refresh-interval command defines the frequency that status updates for long-lived flows will be sent from ASA. Valid values are from 1-60 minutes. In the Flow Update Interval field, configuring the flow-export active refresh-interval to be at least 5 seconds more than the flow-export delay flow-create interval prevents flow-update events from appearing before flow-creation events.

  • {{refresh_interval_in_mins}}-We recommend using a value of 1 minute. Valid values are from 1-60 minutes.


What to do next
Continue to Create a Class-Map that Defines which NSEL Events Will Be Sent to the SEC.

Create a Class-Map that Defines which NSEL Events Will Be Sent to the SEC

The following commands in the macro group all NSEL events in a class and then export that class to the Secure Event Connector (SEC). These instructions refer to this section of the macro:

class-map {{flow_export_class_name}}

match {{add_this_traffic_to_class_map}}

Before you begin
This is part of a larger workflow. See Configuring NSEL for ASA Devices by Using a Security Cloud Control Macro before getting started.
Procedure

Step 1

The class-map command names the class map that identifies NSEL traffic that will be exported to the SEC.

  • {{flow-export-class-name}}-Enter a name for your class map. The name may be up to 40 characters in length. The names "class-default" and any name that begins with "_internal" or "_default" are reserved. All types of class maps use the same name space, so you cannot re-use a name already used by another type of class map.

Step 2

Identify the traffic that is going to be associated with (matched with) your class-map. Choose one of these options for the value of {{add_this_traffic_to_class_map}}:


What to do next
Continue to, Define a Policy-Map for NSEL Events.

Define a Policy-Map for NSEL Events

The task assigns NetFlow export actions to the class you created in the previous task, and the class to a new policy map. These instructions refer to this section of the macro:

policy-map {{global_policy_map_name}}

class {{flow_export_class_name}}

flow-export event-type {{event_type}} destination {{SEC_IPv4_address}}

Before you begin
This is part of a larger workflow. See Configuring NSEL for ASA Devices by Using a Security Cloud Control Macro before getting started.
Procedure

Step 1

The policy-map command creates a policy-map. In the next task, you associate this policy map with the global policy.

Step 2

The class command inherits the name of the class-map you created in Create a Class-Map that Defines which NSEL Events Will Be Sent to the SEC.

Step 3

The flow-export event-type {{event-type}} destination {{IPv4_address}} command defines which event types should be sent to flow collector, (in this case the SEC).


What to do next
Continue to, Disable Redundant Syslog Messages.

Disable Redundant Syslog Messages

These instructions refer to this section of the macro. You do not need to modify the command.

logging flow-export-syslogs disable

Enabling NetFlow to export flow information makes the syslog messages in the following table redundant. In the interest of performance, we recommend that you disable redundant syslog messages, because the same information is exported through NetFlow.


Note


When NSEL and syslog messages are both enabled, there is no guarantee of chronological ordering between the two logging types.


Syslog Message

Description

NSEL Event ID

NSEL Extended Event ID

106100

Generated whenever an access control rule (ACL) is encountered.

1-Flow was created (if the ACL allowed the flow).

3-Flow was denied (if the ACL denied the flow).

0-If the ACL allowed the flow.

1001-Flow was denied by the ingress ACL.

1002-Flow was denied by the egress ACL.

106015

A TCP flow was denied because the first packet was not a SYN packet.

3-Flow was denied.

1004-Flow was denied because the first packet was not a TCP SYN packet.

106023

When a flow was denied by an ACL attached to an interface through the access-group command.

3-Flow was denied.

1001-Flow was denied by the ingress ACL.

1002-Flow was denied by the egress ACL.

302013, 302015, 302017, 302020

TCP, UDP, GRE, and ICMP connection creation.

1-Flow was created.

0-Ignore.

302014, 302016, 302018, 302021

TCP, UDP, GRE, and ICMP connection teardown.

2-Flow was deleted.

0-Ignore.

> 2000-Flow was torn down.

313001

An ICMP packet to the device was denied.

3-Flow was denied.

1003-To-the-box flow was denied because of configuration.

313008

An ICMP v6 packet to the device was denied.

3-Flow was denied.

1003-To-the-box flow was denied because of configuration.

710003

An attempt to connect to the device interface was denied.

3-Flow was denied.

1003-To-the-box flow was denied because of configuration.

If you do not want to disable redundant syslog messages, you can edit this macro and delete only this line from it:

logging flow-export-syslogs disable

You can later enable or disable individual syslog messages by following the procedure in the Disabling and Reenabling NetFlow-related Syslog Messages.

Review and Send the Macro

Before you begin
This is part of a larger workflow. See Configuring NSEL for ASA Devices by Using a Security Cloud Control Macro, before getting started.
Procedure

Step 1

After filling in the fields of the macro, click Review to review the commands before they are sent to the ASA.

Step 2

If you are satisfied with your responses to the commands, click Send.

Step 3

After you send the command, you may see the message, "Some commands may have made changes to the running config" along with two links.

  • Clicking Write to Disk saves the changes made by this command, and any other changes in the running-configuration, to the device's startup configuration.

  • Clicking Dismiss dismisses the message.


You have finished the workflow descried in Configuring NSEL for ASA Devices by Using a Security Cloud Control Macro.

Delete NetFlow Secure Event Logging (NSEL) Configuration from an ASA

This procedure explains how to DELETE the NetFlow Secure Event Logging (NSEL) Configuration on an ASA, which specifies the Secure Event Connector (SEC) as the NSEL flow collector. This procedure reverses the macro described in Configuring NSEL for ASA Devices Using a Security Cloud Control Macro.

This procedure refers to this macro, DELETE NSEL:

policy-map {{flow_export_policy_name}} 
no class {{flow_export_class_name}} 
no class-map {{flow_export_class_name}} 
no flow-export destination {{interface}} {{IPv4_address}} {{NetFlow_port}} 
no flow-export template timeout-rate {{timeout_rate_in_mins}} 
no flow-export delay flow-create {{delay_flow_create_rate_in_secs}} 
no flow-export active refresh-interval {{refresh_interval_in_mins}} 
logging flow-export-syslogs enable 
show run flow-export 
show run policy-map {{flow_export_policy_name}} 
show run class-map {{flow_export_class_name}} 

Open the DELETE-NSEL Macro

Procedure

Step 1

On the Security Devices page, click the Devices tab.

Step 2

Click the appropriate device type tab and select the ASA(s) on which you want to delete the configuration of NetFlow Secure Event Logging (NSEL).

Step 3

In the Device Actions pane, click Command Line Interface.

Step 4

Click the Macros star to show the list of available macros.

Step 5

In the list of macros, select DELETE-NSEL.

Step 6

Under the Macro box, click View Parameters.


Enter the Values in the Macro to Complete the No Commands

The ASA CLI uses the "no" form of a command to delete it. Fill in the fields in the macro to complete the "no" form of the command:

Procedure

Step 1

policy-map {{flow_export_policy_name}}

  • {{flow_export_policy_name}}-Enter the value of the policy-map name.

Step 2

no class {{flow_export_class_name}}

  • {{flow_export_class_name}}-Enter the value of the class-map name.

Step 3

no class-map {{flow_export_class_name}}

  • {{flow_export_class_name}}-The value of the class-map name is inherited from the step above.

Step 4

no flow-export destination {{interface}} {{IPv4_address}} {{NetFlow_port}}

  • {{interface}}-Enter the name of the interface on the ASA from which the NetFlow events were sent.

  • {{IPv4_address}}-Enter the IPv4 address of the SEC. The SEC functions as the flow collector.

  • {{NetFlow_port}}-Enter the UDP port number on the SEC to which NetFlow packets were sent.

Step 5

no flow-export template timeout-rate {{timeout_rate_in_mins}}

  • {{timeout_rate_in_mins}}-Enter the flow-export template timeout-rate.

Step 6

no flow-export delay flow-create {{delay_flow_create_rate_in_secs}}

  • {{delay_flow_create_rate_in_secs}}-Enter the flow-export delay flow-create rate.

Step 7

no flow-export active refresh-interval {{refresh_interval_in_mins}}

  • {{refresh_interval_in_mins}}-Enter the flow-export active refresh-interval interval.


Determine the Name of an ASA Global Policy

To determine the name of the ASA's global policy, follow this procedure:

Procedure


Step 1

From the Security Devices page, select the device for which you want to find the name of the global policy.

Step 2

In the Device Actions pane, select >_Command Reference.

Step 3

In the Command Line Interface window, at the prompt, type:

show running-config service-policy

In the output of the example below, global_policy is the name of the global policy.

Example:

> show running-config service-policy

service-policy global_policy global


Troubleshooting NSEL Data Flows

Once you have configured Netflow Secure Event Logging (NSEL) , use these procedures to verify that NSEL events are being sent from your ASA to the Cisco Cloud and that the Cisco Cloud is receiving them.

Note that once your ASA is configured to send NSEL events to the Secure Event Connector (SEC) and then on to the Cisco Cloud, data does not flow immediately. It could take a few minutes for the first NSEL packets to arrive assuming there is NSEL-related traffic being generated on the ASA.


Note


This workflow shows you a straight-forward use of the "flow-export counters" command and "capture" commands to Troubleshoot NSEL Data Flows. See "Packet Captures" CLI Book 1: Cisco ASA Series General Operations CLI Configuration Guide and "Monitoring NSEL" in the Cisco ASA NetFlow Implementation Guide for a more detailed discussion of the usage of these commands.


Perform these tasks:

  • Verify that NetFlow Packets are Being Sent to the SEC

  • Verify that NetFlow Packets are Being Received by the Cisco Cloud

Verify that NSEL Events are Being Sent to the SEC

Use one of two commands to verify that NSEL packets are being sent to the SEC:

  • flow-export counters

  • capture

Use the "flow-export counters" Command to Check for flow-export Packets Being Sent and for NSEL errors

Use the command line interface in Security Cloud Control to send these commands to the ASAs that you have configured for NSEL.

Procedure

Step 1

In the navigation pane, click Security Devices.

Step 2

Click the Devices tab.

Step 3

Click the appropriate device tab and select the ASA you configured to send NSEL events to the SEC.

Step 4

In the Device Actions pane on the right, click Command Line Interface.

Step 5

Reset the flow export counters by running the clear flow-export counters command. This resets the clear export flow counters to zero so that you can easily tell if new events are coming in.

example:

> clear flow-export counters

Done!

Step 6

Run the show flow-export counters command to see the destination of the NSEL packets, how many packets were sent and any errors:

example:

>show flow-export counters

destination: management 209.165.200.225 10425

Statistics:

packets sent 25000

Errors:

block allocation errors 0

invalid interface 0

template send failure 0

no route to collector 0

source port allocation 0

In the output above, the destination line shows the interface on the ASA from which NSEL events are sent, the IP address of the SEC, port 10425 of the SEC. It also shows packets sent of 25000.

If there are no errors and packets are being sent, skip to Verify that NetFlow Packets are Being Received by the Cisco Cloud below.


Error descriptions:

  • block allocation errors-If you receive a block allocation error, the ASA did not allocate memory to the flow-exporter.

    • Recovery action: Call Cisco Technical Assistance Center (TAC).

  • invalid interface-Indicates that you are trying to send NSEL events to the SEC but the interface you've defined for flow export isn't configured to do so.

    • Recovery action: Review the interface you chose when configuring NSEL. We recommend using the management interface, your interface may be different.

  • template send failure-The template you had to define NSEL was not parsed correctly.

  • no route to collector-Indicates there is no network route from the ASA to the SEC.

    • Recovery actions:

      • Make sure that the IP address you used for the SEC when you configured NSEL is correct.

      • Make sure the SEC's status is Active and it has sent a recent heartbeat. See SDC is Unreachable.

      • Make sure the Secure Device Connector's status is Active and it has sent a recent heartbeat.

  • source port allocation-May indicate that there is a bad port on your ASA.

Use the "capture" Command to Capture NSEL Packets Sent from the ASA to the SEC

Use the command line interface in Security Cloud Control to send these commands to the ASAs that you have configured for NSEL.

Procedure

Step 1

In the navigation pane, click Security Devices.

Step 2

Click the Devices tab.

Step 3

Click the appropriate device type tab and select the ASA you configured to send NSEL events to the SEC.

Step 4

In the Device Actions pane on the right, click Command Line Interface.

Step 5

In the command window, run this capture command:

> capturecapture_nameinterfaceinterface_name match udp any host IP_of_SECeqNetFlow_port

Where

  • capture_name is the name of the packet capture.

  • interface_name is the name of the interface from which NSEL packets leave the ASA.

  • IP_of_SEC is the IP address of the SEC VM.

  • NetFlow_port is the port to which NSEL events are sent.

This starts the packet capture.

Step 6

Run the show capture command to view the captured packets:

> show capturecapture_name

Where capture_name is the name of the packet capture you defined in the previous step.

Here is an example of the output showing the time of the capture, the IP address from which the packet was sent, the IP address, and the port the packet was sent to. In this example, 192.168.25.4 is the IP address of the SEC and port 10425 is the port on the SEC that receives NSEL events.

6 packets captured

1: 14:23:51.706308 192.168.0.169.16431 > 192.168.25.4.10425: udp 476

2: 14:23:53.923017 192.168.0.169.16431 > 192.168.25.4.10425: udp 248

3: 14:24:07.411904 192.168.0.169.16431 > 192.168.25.4.10425: udp 1436

4: 14:24:07.411920 192.168.0.169.16431 > 192.168.25.4.10425: udp 1276

5: 14:24:21.021208 192.168.0.169.16431 > 192.168.25.4.10425: udp 112

6: 14:24:27.444755 192.168.0.169.16431 > 192.168.25.4.10425: udp 196

Step 7

Run the capture stop command to manually stop the packet capture:

> capture capture_namestop

Where capture_name is the name of the packet capture you defined in the previous step.


Verify that NetFlow Packets are Being Received by the Cisco Cloud

Before you Begin

Verify that NSEL events are being sent from the ASA.

Check for Live NSEL Events

Check for both live and historical events.

This procedure will filter for NSEL events that the Cisco Cloud has received within the last hour.

Procedure

Step 1

In the left pane, choose Events & Logs > Events > Event Logging.

Step 2

Click the Live tab.

Step 3

Pin-open the event filter.

Step 4

In the ASA Events section, make sure NetFlow is checked.

Step 5

In the Sensor ID field, enter the IP address of the ASA you configured to send NSEL events.

Step 6

At the bottom of the filter, make sure that Include NetFlow Events is checked.


Check for Historical NSEL Events

This procedure will filter for NSEL events that the Cisco Cloud has received within the time-frame you specify.

Procedure

Step 1

In the left pane, choose Events & Logs > Events > Event Logging.

Step 2

Click the Historical tab.

Step 3

Pin-open the event filter.

Step 4

In the ASA Events section, make sure NetFlow is checked.

Step 5

Set the Start time far enough back in time to check if Security Cloud Control ever did receive NSEL events.

Step 6

In the Sensor ID field, enter the IP address of the ASA you configured to send NSEL events.

Step 7

At the bottom of the filter, make sure that Include NetFlow events is checked.


Parsed ASA Syslog Events

Parsed syslog events contain more event attributes than other syslog events and let you search on any specific parsed field. The SEC forwards all ASA events you specify to the Cisco cloud but only the syslog messages in the table below are parsed. All parsed Syslogs events are shown with their EvenTypes italicised to help you identify.

For detailed explanations of syslogs see, Cisco ASA Series Syslog Messages.

Syslog ID

Syslog Category

Purpose of syslog messge

106015

Firewall

Represents out of state TCP Deny

106023

Firewall

A real IP packet was denied by the ACL. This message appears even if you do not have the log option enabled for an ACL.

106100

Access Lists/User Session

Packet was permitted or denied by an ACL.

113019

User Authentication

Critical AnyConnect

302013, 302015, 302017, 302020

User Session

Connection start and end syslogs for TCP, UDP, GRE, and ICMP connection creation.

302014, 302016, 302018, 302021

User Session

Connection start and end syslogs for TCP, UDP, GRE, and ICMP connection creation.

302020 - 302021

User Session

ICMP session establishment and teardown.

305006

User Session/NAT and PAT

NAT connection failure

305011-305014

User Session/NAT and PAT

NAT Build/Teardown related

313001, 313008

IP Stack

Represents denied connections to the box.

414004

System

Critical AnyConnect

609001 - 609002

Firewall

A network state container was reserved/removed for host ip-address connected to a zone.

710002,710004 710005

User Session

To the box connections failures

710003

User Session

Represents denied connections to the box.

746012, 746013

User Session

Critical AnyConnect