View Events in Security Cloud Control

Viewing Live Events

The Live events page shows the most recent 500 events that match the filter and search criteria you entered. If the Live events page displays the maximum of 500 events, and more events stream in, Security Cloud Control displays the newest live events, and transfers the oldest live events to the Historical events page, keeping the total number of live events at 500. That transfer takes roughly a minute to perform. If no filtering criteria is added, you will see all the latest Live 500 events generated by rules configured to log events.

The event timestamps are shown in UTC.

Changing the filtering criteria, whether live events are playing or paused, clears the events screen and restarts the collection process.

To see live events in the Security Cloud Control Events viewer:

Procedure


Step 1

In the left pane, choose Events & Logs > Events > Event Logging.

Step 2

Click the Live tab.


What to do next

See how to play and pause events by reading .

Play/Pause Live Events

You can "play" or "pause" live events as they stream in. If live events are "playing," Security Cloud Control displays events that match the filtering criteria specified in the Events viewer in the order they are received. If events are paused, Security Cloud Control does not update the Live events page until you restart playing live events. When you restart playing events, Security Cloud Control begins populating events in the Live page from the point at which you restarted playing events. It doesn't back-fill the ones you missed.

To view all the events that Security Cloud Control received whether you played or paused live event streaming, click the Historical tab.

Auto-pause Live Events

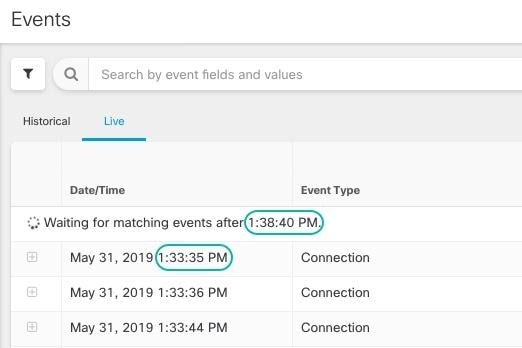
After displaying events for about 5 consecutive minutes, Security Cloud Control warns you that it is about to pause the stream of live events. At that time, you can click the link to continue streaming live events for another 5 minutes or allow the stream to stop. You can restart the live events stream when you are ready.

Receiving and Reporting Events

There may be a small lag between the Secure Event Connector or the Security Service Exchange receiving events and Security Cloud Control posting events in the Live events viewer. You can view the gap on the Live page. The time stamp of the event is the time it was received by Secure Event Connector or the Security Service Exchange.

View Historical Events

The Live events page shows the most recent 500 events that match the filter and search criteria you entered. Events older than the most recent 500 are transferred to the Historical events table. That transfer takes roughly a minute to perform. You can then filter all the events you have stored to find events you're looking for.

To view historical events:

Procedure


Step 1

In the navigation pane, choose Events & Logs > Events > Event Logging.

Step 2

Click the Historical tab. By default, when you open the Historical events table, the filter is set to display the events collected within the last hour.

The event attributes are largely the same as what is reported by Firepower Device Manager (FDM) or the Adaptive Security Device Manager (ASDM).


Customize the Events View

Any changes made to the Event Logging page are automatically saved for when you navigate away from this page and come back at a later time.


Note


The Live and Historical events view have the same configuration. When you customize the events view, these changes are applied to both the Live and Historical view.


Show or Hide Columns

You can modify the event view for both live and historical events to only include column headers that apply to the view you want. Click the column filter icon located to the right of the columns, select or deselect the columns you want, and then click Apply.

Figure 1. Show or Hide Columns
Screen capture of Customize Table pane

Columns with asterisks are provided within the event table by default, although you can remove them at any time.

Search and Add Columns

You can search for more columns, which are not part of the default list, and add them to the event view for both live and historical events. Note that adding many columns for customizing the table may reduce performance. Consider using fewer columns for faster data retrieval.

Alternatively, click the + icon next to an event to expand it and view the hidden columns.

Reorder the Columns

You can reorder the columns of the event table. Click the column filter icon located to the right of the columns to view the list of selected columns. Then, drag and drop the columns into the order you want. The column at the top of the list in the drop-down menu appears as the left-most column in the event table.

Show and Hide Columns on the Event Logging Page

The Event Logging page displays events sent to the Cisco cloud from configured ASA and FDM-managed devices.

You can show or hide columns on the Event Logging page by using the Show/Hide widget with the table:

Procedure


Step 1

In the left pane, choose Events & Logs > Events > Event Logging.

Step 2

Scroll to the far right of the table and click the column filter icon .

Step 3

Check the columns you want to see and uncheck the columns you want to hide.


Other users logging into the tenant will see the same columns you chose to show until columns are shown or hidden again.

This table describes the default column headers:

Column Header

Description

Date/Time

The time the device generated the event. By default, event timestamps are displayed in your Local time zone. To view event timestamps in UTC, see Change the Time Zone for the Event Timestamps

Device Type

ASA (Adaptive Security Appliance)

FTD (Firepower Threat Defense)

Event Type

This composite column can have any of the following:

  • FTD Event Types

    • Connection: Displays connection events from access control rules.

    • File: Displays events reported by file policies in access control rules.

    • Intrusion: Displays events reported by intrusion policy in access control rules.

    • Malware: Displays events reported by malware policies in access control rules.

  • ASA Event Types: These event types represent groups of syslog or NetFlow events. See ASA Event Types for more information about which syslog ID or which NetFlow ID is included in which group.

    • Parsed Events: Parsed syslog events contain more event attributes than other syslog events and Security Cloud Control is able to return search results based on those attributes more quickly. Parsed events are not a filtering category; however, parsed event IDs are displayed in the Event Types column in italics. Event IDs that are not displayed in italics are not parsed.

    • ASA NetFlow Event IDs: All Netflow (NSEL) events from ASA appear here.

Sensor ID / Hostname

The Sensor ID is the IP address from which events are sent to Security Service Exchange or Secure Event Connector.

This is typically the management interface on the threat defense or the ASA.

Initiator IP

This is the IP address of the source of the network traffic. The value of the Initiator address field corresponds to the value of the InitiatorIP field in the event details. You can enter a single address, such as 10.10.10.100, or a network defined in CIDR notation such as 10.10.10.0/24.

Responder IP

This is the destination IP address of the packet. The value of the Destination address field corresponds to the value in the ResponderIP field in the event details. You can enter a single address, such as 10.10.10.100, or a network defined in CIDR notation such as 10.10.10.0/24.

Port

The port or ICMP code used by the session responder. The value of the destination port corresponds to the value of the ResponderPort in the event details.

Protocol

It represents the protocol in the events.

Action

Specifies the security action defined by the rule. The value you enter must be an exact match to what you want to find; however, the case doesn't matter. Enter different values for connection, file, intrusion, malware, syslog, and NetFlow event types:

  • For connection event types, the filter searches for matches in the AC_RuleAction attribute. Those values could be Allow, Block, Trust.

  • For file event types, the filter searches for matches in the FileAction attribute. Those values could be Allow, Block, Trust.

  • For intrusion event types, the filter searches for matches in the InLineResult attribute. Those values could be Allowed, Blocked, Trusted.

  • For malware event types, the filter searches for matches in the FileAction attribute. Those values could be Cloud Lookup Timeout.

  • For syslog and NetFlow events types, the filter searches for matches in the Action attribute.

Policy

The name of the policy that triggered the event. Names will be different for ASA and FDM-managed devices.

Change the Time Zone for the Event Timestamps

Change the time zone display for event timestamps on the Security Cloud Control Event Logging page.

Procedure


Step 1

From the left pane, choose Events & Logs > Events > Event Logging.

Step 2

Click the UTC Time or Local Time button on the top right side of the Event Logging page to display the event timestamps in the selected time zone.

By default, event timestamps are displayed in your local time zone.


Customizable Event Filters

If you are a Secure Logging Analytics (SaaS) customer, you can create and save custom filters that you use frequently.

The elements of your filter are saved to a filter tab as you configure them. Whenever you return to the Event Logging page, these searches will be available to you. They will not be available to other Security Cloud Control users of the tenant. They will not be available to you on a different tenant, if you manage more than one tenant.


Note


Be aware that when you are working in a filter tab, if you modify any filter criteria, those changes are saved to your custom filter tab automatically.


Procedure


Step 1

From the main menu, choose Events & Logs > Events > Event Logging.

Step 2

Clear the Search field of any values.

Step 3

Above the event table, click the blue plus button to add a View tab. Filter views are labeled "View 1", "View 2", "View 3" and so on until you give them a name.

Step 4

Select a view tab.

Step 5

Open the filter bar and select the filters attributes you want in your custom filter. See Search and Filter Events Using the Event Logging Page. Remember that only filter attributes are saved in the custom filter.

Step 6

Customize the columns you want to show in the event logging table. See Show and Hide Columns on the Event Logging Page for a discussion of showing and hiding columns.

Step 7

Double-click the filter tab with the "View X" label and rename it.

Step 8

(Optional) Now that you have created a custom filter, you can fine tune the results displayed on the Event Logging page, without changing the custom filter, by adding search criteria to the Search field. See Search and Filter Events Using the Event Logging Page.


Search and Filter Events Using the Event Logging Page

Searching and filtering the historical and live event tables for specific events, works the same way as it does when searching and filtering for other information in Security Cloud Control. As you add filter criteria, Security Cloud Control starts to limit what it displays on the Event Logging page. You can also enter search criteria in the search field to find events with specific values. If you combine the filtering and searching mechanisms, search tries to find the value you entered from among the results displayed after filtering the events.

Following are the options to conduct a search for event logs:

Filtering works the same way for live events as it does for historical events with the exception that live events cannot be filtered by time.

Learn about these filtering methods:

Filter Live or Historical Events

This procedure explains how to use event filtering to see a subset of events in the Event Logging page. If you find yourself repeatedly using certain filter criteria, you can create a customized filter and save it. See Customizable Event Filters for more information.

Procedure


Step 1

In the navigation bar, choose Events & Logs > Events > Event Logging

Step 2

Click either the Historical or Live tab.

Step 3

Click the filter icon (). Click the pin icon () to pin the Filter pane and keep it open.

Step 4

Click a view tab that has no saved filter elements.

Step 5

Select the event details you want to filter by:

  • FTD Events:

    • Connection: Displays connection events from access control rules.

    • File: Displays events reported by file policies in access control rules.

    • Intrusion: Displays events reported by intrusion policy in access control rules.

    • Malware: Displays events reported by malware policies in access control rules.

  • ASA Events: These event types represent groups of syslog or NetFlow events.

    See Security Cloud Control Event Types for more information about events.

    • Parsed Events: Parsed syslog events contain more event attributes than other syslog events and Security Cloud Control is able to return search results based on those attributes more quickly. Parsed events are not a filtering category; however, parsed event IDs are displayed in the Event Types column in italics. Event IDs that are not displayed in italics are not parsed.

  • Time Range: Click the Start or End time fields to select the beginning and end of the time period you want to display. The time stamp is displayed in the local time of your computer.

  • Action: Specifies the security action defined by the rule. The value you enter must be an exact match to what you want to find; however, the case doesn't matter. Enter different values for connection, file, intrusion, malware, syslog, and NetFlow event types:

    • For connection event types, the filter searches for matches in the AC_RuleAction attribute. Those values could be Allow, Block, Trust.

    • For file event types, the filter searches for matches in the FileAction attribute. Those values could be Allow, Block, Trust.

    • For intrusion event types, the filter searches for matches in the InLineResult attribute. Those values could be Allowed, Blocked, Trusted.

    • For malware event types, the filter searches for matches in the FileAction attribute. Those values could be Cloud Lookup Timeout.

    • For syslog and NetFlow events types, the filter searches for matches in the Action attribute.

  • Sensor ID / Hostname: The Sensor ID is the management IP address from which events are sent to the Secure Event Connector or Security Service Exchange.

    For an FDM-managed device, the Sensor ID is typically the IP address of the device's management interface.

  • IP addresses

    • Initiator : This is the IP address of the source of the network traffic. The value of the Initiator address field corresponds to the value of the InitiatorIP field in the event details. You can enter a single address, such as 10.10.10.100, or a network defined in CIDR notation such as 10.10.10.0/24.

    • Responder: This is the destination IP address of the packet. The value of the Destination address field corresponds to the value in the ResponderIP field in the event details. You can enter a single address, such as 10.10.10.100, or a network defined in CIDR notation such as 10.10.10.0/24.

  • Ports

    • Initiator: The port or ICMP type used by the session initiator. The value of the source port corresponds to the value fo the InitiatorPort in the event details. (Add a range - starting port ending port and space in between or both initiator and responder)

    • Reponder: The port or ICMP code used by the session responder. The value of the destination port corresponds to the value of the ResponderPort in the event details.

  • NetFlow: ASA NetFlow events are different than syslog events. The NetFlow filter searches for all NetFlow events IDs that resulted in an NSEL record. Those "NetFlow event IDs" are defined in the Cisco ASA NetFlow Implementation Guide.

Step 6

(Optional) Save your filter as a custom filter by clicking out of the view tab.


Filter Only NetFlow Events

This procedure finds only ASA NetFlow events:

Procedure


Step 1

From the left menu, choose Events & Logs > Events > Event Logging.

Step 2

Click the Filter icon and pin the filter open.

Step 3

Check Netflow ASA Event filter.

Step 4

Clear all other ASA Event filters.

Only ASA NetFlow events are displayed in the Event Logging table.


Filter for ASA or FDM-Managed Device Syslog Events but not ASA NetFlow Events

This procedure finds only syslog events:

Procedure


Step 1

In the left pane, choose Events & Logs > Events > Event Logging.

Step 2

Click the Filter icon and pin the filter open.

Step 3

Scroll to the bottom of the Filter pane and make sure the Include NetFlow events filter is unchecked.

Step 4

Scroll back up to the ASA Events filter tree, and make sure the NetFlow box is unchecked.

Step 5

Select the rest of your ASA or FTD filter criteria.


Combine Filter Elements

Filtering events generally follows the standard filtering rules in Security Cloud Control: The filtering categories are "AND-ed" and the values within the categories are "OR-ed." You can also combine the filter with your own search criteria. In the case of event filters; however, the device event filters are also "OR-ed." For example, if these values were chosen in the filter:

With this filter in use, Security Cloud Control would display Firewall Threat Defense device connection events or ASA BotNet or Firewall Traffic events, and those events that occurred between the two times in the time range, and those events that also contain the ResponderPort 443. You can filter by historical events within a time range. The live events page always displays the most recent events.

Search for Specific Attribute: Value Pairs

You can search for live or historical events by entering an event attribute and a value in the search field. The easiest way to do this is to click the attribute in the Event Logging table that you want to search for, and Security Cloud Control enters it in the Search field. The events you can click on will be blue when you roll over them. Here is an example:

In this example, the search started by rolling over the InitiatorIP value of 10.10.11.11 and clicking it. Initiator IP and it's value were added to the search string. Next, Event Type, 3 was rolled-over and clicked and added to the search string and an AND was added by Security Cloud Control. So the result of this search will be a list of events that were initiated from 10.10.11.11 AND that are 3 event types.

Notice the magnifying glass next to the value 3 in the example above. If you roll-over the magnifying glass, you could also choose an AND, OR, AND NOT, OR NOT operator to go with the value you want to add to the search.

In the example below, "OR" is chosen. The result of this search will be a list of events that were initiated from 10.10.11.11 OR are a 106023 event type. Note that if the search field is empty and you right click a value from the table, only NOT is available as there is no other value.

As long as you rollover a value and it is highlighted blue, you can add that value to the search string.

AND, OR, NOT, AND NOT, OR NOT Filter Operators

Here are the behaviors of "AND", "OR", "NOT", "AND NOT", and "OR NOT" used in a search string:

AND

Use the AND operator in the filter string, to find events that include all attributes. The AND operator cannot begin a search string.

For example, the search string below will search for events that contain the TCP protocol AND that originated from InitiatorIP address 10.10.10.43, AND that were sent from the Initiator port 59614. One would expect that with each additional AND statement, the number of events that meet the criteria would be small and smaller.

Protocol: "tcp" AND InitiatorIP: "10.10.10.43" AND InitiatorPort: "59614" 

OR

Use the OR operator in the filter string, to find events that include any of the attributes. The OR operator cannot begin a search string.

For example, the search string below will display events in the event viewer that include events that include the TCP protocol, OR that originated from InitiatorIP address 10.10.10.43, OR that were sent from the Initiator port 59614. One would expect that with each additional OR statement, the number of events that meet the criteria would be bigger and bigger.

Protocol: "tcp" OR InitiatorIP: "10.10.10.43" OR InitiatorPort: "59614" 

NOT

Use this only at the beginning of a search string to exclude events with certain attribtues. For example, this search string would exclude any event with the InitiatorIP 192.168.25.3 from the results.

 NOT InitiatorIP: "192.168.25.3" 

AND NOT

Use the AND NOT operator in the filter string to exclude events that contain certain attributes. AND NOT cannot be used at the beginning of a search string.

For example, this filter string will display events with the InitiatorIP 192.168.25.3 but not those whose ResponderIP address is also 10.10.10.1.

 InitiatorIP: "192.168.25.3" AND NOT ResponderIP: "10.10.10.1" 

You can also combine NOT and AND NOT to exclude several attributes. For example this filter string, will exclude events with InitiatorIP 192.168.25.3 and events with ResponderIP 10.10.10.1

NOT InitiatorIP: "192.168.25.3" AND NOT ResponderIP: "10.10.10.1" 

OR NOT

Use the OR NOT operator to include search results that exclude certain elements. The OR NOT operator cannot be used at the beginning of a search string.

For example, this search string will find events with the Protocol of TCP, OR that have the InitiatorIP of 10.10.10.43, or those NOT from InitiatorPort 59614.

Protocol: "tcp" OR InitiatorIP: "10.10.10.43" OR NOT InitiatorPort: "59614" 

You could also think of it this way: Search for (Protocol: "tcp") OR (InitiatorIP: "10.10.10.43") OR (NOT InitiatorPort: "59614").

Wildcard Searches

Use an asterisk (*) to represent a wildcard in the value field of an attribute:value search to find results within events. For example, this filter string,

 URL:*feedback* 

will find strings in the URL attribute field of events that contain the string feedback.

Search Events Using the Events Logging Page

Use the search and report capabilities in the Event Logging page to search all logged events and find the information you need. Note that you can generate reports only for historical events.

Procedure


Step 1

In the navigation bar, choose Events & Logs > Events > Event Logging.

Step 2

Click either the Historical or Live tab.

Step 3

Type the search query in the search bar and click Search to execute the search.

Alternatively, click the search box to choose from a list of Sample Filters to quickly search for events. Use the sample filters to quickly populate a search query in the search bar and then modify it to match your specific needs. Find more information about using the sample filters in Use Sample Filters to Search Events.

Step 4

(optional)To run a search in the background and generate a report while you move away from the search page, do the following:

  1. Type your search query and choose Schedule Report from the Search drop-down list.

  2. Click Generate Report.

    The search is queued, and you are notified when it is complete. You can run multiple searches in the background.

    For more information about scheduling a report, refer to Schedule to Generate a Search Report in the Background

Step 5

(Optional) If you want to view and manage your search reports, click Reports. From this view, you can do the following:

  • The Reports page allows you to view, download, or delete the search reports.

  • Click Schedule a Report to generate a one-time report or to schedule a recurring report.

  • Click View Notification Settings to navigate to the Notification Preferences page to view or modify your notification settings.


What to do next

You can convert any one-time report into a recurring report schedule if you need recurring searches. For more information, refer to Schedule to Generate a Search Report in the Background.

Use Sample Filters to Search Events

Sample filters allow you to construct common search queries quickly without requiring you to type the full query. Select the filter and modify the query parameters to fit your specific needs.

Procedure

Step 1

In the Event Logging page, click the search bar. A list of Sample Filters appears below the search bar.

Step 2

Choose a filter from the drop-down list. The search bar automatically populates with the corresponding search query.

Step 3

Modify the values in the predefined query to refine your search.

Examples
  • To search for events related to a specific website, select Wildcard URL. The search bar displays URL: "*.sharepoint.com". You can then change sharepoint.com to any other domain you wish to investigate.

  • To search for events involving a specific device, select Specific Host. The search bar displays InitiatorIP: "192.168.55.55" OR ResponderIP: "192.168.55.55". Change 192.168.55.55 to the IP address of the device you want to monitor.

Step 4

Click Search.


Search Historical Events in the Background

Security Cloud Control allows you to define a search criteria and search for event logs based on that criteria. The Reports feature enables you to perform the event log searches in the background and generate reports.

You receive a notification when the report generation is complete, based on your configured notification preferences.

You can view, download, or delete the reports from the Reports page. Additionally, you can schedule to generate either a one-time report or a recurring report. Navigate to the Notification Settings page to view or modify the subscription options.

Download a Search Report

Search results and schedules queries are stored for seven days before Security Cloud Control automatically removes them. You can download a copy of the search report in CSV format.

Procedure

Step 1

In the navigation bar, choose Events & Logs > Events > Event Logging.

Step 2

Click Reports.

Step 3

In the Actions column, click Download next to the report to download it. The report file in CSV format is automatically downloaded to the default storage location on your local drive.

Step 4

(Optional) To view the search query and download the report, follow these steps:

  1. click Queries tab.

  2. Expand the report to see the search query details.

  3. Click View Reports next to the report you want to view and download.

  4. Click Download.


Event Attributes in Security Analytics and Logging

Event Attribute Descriptions

The event attribute descriptions used by Security Cloud Control are largely the same as what is reported by Firepower Device Manager (FDM) and Adaptive Security Device Manager (ASDM).

Some ASA syslog events are "parsed" and others have additional attributes which you can use when filtering the contents of the Event Logging table using attribute:value pairs. See these additional topics for other important attributes of syslog events:

EventGroup and EventGroupDefinition Attributes for Some Syslog Messages

Some syslog events will have the additional attributes "EventGroup" and "EventGroupDefinition". You will be able to filter the events table to find events using these additional attributes by filtering by attribute:value pairs. For example, you could filter for Application Firewall events by entering apfw:415* in the search field of the Event Logging table.

Syslog Message Classes and Associated Message ID Numbers

EventGroup

EventGroupDefinition

Syslog Message ID Numbers (first 3 digits)

aaa/auth User Authentication 109, 113
acl/session Access Lists/User Session 106
apfw Application Firewall 415
bridge Transparent Firewall 110, 220
ca PKI Certification Authority 717
citrix Citrix Client 723
clst Clustering 747
cmgr Card Management 323
config Command Interface 111, 112, 208, 308
csd Secure Desktop 724
cts Cisco TrustSec 776
dap Dynamic Access Policies 734
eap, eapoudp EAP or EAPoUDP for Network Admission Control 333, 334
eigrp EIGRP Routing 336
email E-mail Proxy 719
ipaa/envmon Environment Monitoring 735
ha Failover 101, 102, 103, 104, 105, 210, 311, 709
idfw Identity-based Firewall 746
ids Intrusion Detection System 733
ids/ips Intrusion Detection System / Intrusion Protection System 400
ikev2 IKEv2 Toolkit 750, 751, 752
ip IP Stack 209, 215, 313, 317, 408
ipaa IP Address Assignment 735
ips Intrusion Protection System 401, 420
ipv6 IPv6 325
l4tm Block lists, Allow lists, grey lists 338
lic Licensing 444
mdm-proxy MDM Proxy 802
nac Network Admission Control 731, 732
vpn/nap IKE and IPsec / Network Access Point 713
np Network Processor 319
ospf OSPF Routing 318, 409, 503, 613
passwd Password Encryption 742
pp Phone Proxy 337
rip RIP Routing 107, 312
rm Resource Manager 321
sch Smart Call Home 120
session User Session 108, 201, 202, 204, 302, 303, 304, 314, 405, 406, 407, 500, 502, 607, 608, 609, 616, 620, 703, 710
session/natpat User Session/NAT and PAT 305
snmp SNMP 212
ssafe ScanSafe 775
ssl/np ssl SSL Stack/NP SSL 725
svc SSL VPN Client 722
sys System 199, 211, 214, 216, 306, 307, 315, 414, 604, 605, 606, 610, 612, 614, 615, 701, 711, 741
tre Transactional Rule Engine 780
ucime UC-IME 339
tag-switching Service Tag Switching 779
td Threat Detection 733
vm VLAN Mapping 730
vpdn PPTP and L2TP Sessions 213, 403, 603
vpn IKE and IPsec 316, 320, 402, 404, 501, 602, 702, 713, 714, 715
vpnc VPN Client 611
vpnfo VPN Failover 720
vpnlb VPN Load Balancing 718
vxlan VXLAN 778
webfo WebVPN Failover 721
webvpn WebVPN and AnyConnect Client 716
session/natpat User Session / NAT and PAT 305

EventName Attributes for Syslog Events

Some syslog events will have the additional attribute "EventName". You will be able to filter the events table to find events using the EventName attribute by filtering by attribute:value pairs. For example, you could filter events for a "Denied IP packet" by entering EventName:"Denied IP Packet" in the search field of the Event Logging table.

Syslog Event ID and Event Names Tables

AAA Syslog Event IDs and Event Names

EventID

EventName

109001

AAA Begin

109002

AAA Failed

109003

AAA Server Failed

109005

Authentication Success

109006

Authentication Failed

109007

Authorization Success

109008

Authorization Failed

109010

AAA Pending

109011

AAA Session Started

109012

AAA Session Ended

109013

AAA

109014

AAA Failed

109016

AAA ACL not found

109017

AAA Limit Reach

109018

AAA ACL Empty

109019

AAA ACL error

109020

AAA ACL error

109021

AAA error

109022

AAA HTTP limit reached

109023

AAA auth required

109024

Authorization Failed

109025

Authorization Failed

109026

AAA error

109027

AAA Server error

109028

AAA Bypassed

109029

AAA ACL error

109030

AAA ACL error

109031

Authentication Failed

109032

AAA ACL error

109033

Authentication Failed

109034

Authentication Failed

109035

AAA Limit Reach

113001

AAA Session limit reach

113003

AAA overridden

113004

AAA Successful

113005

Authorization Rejected

113006

AAA user locked

113007

AAA User unlocked

113008

AAA successful

113009

AAA retrieved

113010

AAA Challenge received

113011

AAA retrieved

113012

Authentication Successful

113013

AAA error

113014

AAA error

113015

Authentication Rejected

113016

AAA Rejected

113017

AAA Rejected

113018

AAA ACL error

113019

AAA Disconnected

113020

AAA error

113021

AAA Logging Fail

113022

AAA Failed

113023

AAA reactivated

113024

AAA Client certification

113025

AAA Authentication fail

113026

AAA error

113027

AAA error

Botnet Syslog Event IDs and Event Names

EventID

EventName

338001

Botnet Source Block List

338002

Botnet Destination Block List

338003

Botnet Source Block List

338004

Botnet Destination Block List

338101

Botnet Source Allow List

338102

Botnet destination Allow List

338202

Botnet destination Grey

338203

Botnet Source Grey

338204

Botnet Destination Grey

338301

Botnet DNS Intercepted

338302

Botnet DNS

338303

Botnet DNS

338304

Botnet Download successful

338305

Botnet Download failed

338306

Botnet Authentication failed

338307

Botnet Decrypt failed

338308

Botnet Client

338309

Botnet Client

338310

Botnet dyn filter failed

Failover Syslog Event IDs and Event Names

EventID

EventName

101001

Failover Cable OK

101002

Failover Cable BAD

101003

Failover Cable not connected

101004

Failover Cable not connected

101005

Failover Cable reading error

102001

Failover Power failure

103001

No response from failover mate

103002

Failover mate interface OK

103003

Failover mate interface BAD

103004

Failover mate reports failure

103005

Failover mate reports self failure

103006

Failover version incompatible

103007

Failover version difference

104001

Failover role switch

104002

Failover role switch

104003

Failover unit failed

104004

Failover unit OK

106100

Permit/Denied by ACL

210001

Stateful Failover error

210002

Stateful Failover error

210003

Stateful Failover error

210005

Stateful Failover error

210006

Stateful Failover error

210007

Stateful Failover error

210008

Stateful Failover error

210010

Stateful Failover error

210020

Stateful Failover error

210021

Stateful Failover error

210022

Stateful Failover error

311001

Stateful Failover update

311002

Stateful Failover update

311003

Stateful Failover update

311004

Stateful Failover update

418001

Denied Packet to Management

709001

Failover replication error

709002

Failover replication error

709003

Failover replication start

709004

Failover replication complete

709005

Failover receive replication start

709006

Failover receive replication complete

709007

Failover replication failure

710003

Denied access to Device

Firewall Denied Syslog Event IDs and Event Names

EventID

EventName

106001

Denied by Security Policy

106002

Outbound Deny

106006

Denied by Security Policy

106007

Denied Inbound UDP

106008

Denied by Security Policy

106010

Denied by Security Policy

106011

Denied Inbound

106012

Denied due to Bad IP option

106013

Dropped Ping to PAT IP

106014

Denied Inbound ICMP

106015

Denied by Security Policy

106016

Denied IP Spoof

106017

Denied due to Land Attack

106018

Denied outbound ICMP

106020

Denied IP Packet

106021

Denied TCP

106022

Denied Spoof packet

106023

Denied IP Packet

106025

Dropped Packet failed to Detect context

106026

Dropped Packet failed to Detect context

106027

Dropped Packet failed to Detect context

106100

Permit/Denied by ACL

418001

Denied Packet to Management

710003

Denied access to Device

Firewall Traffic Syslog Event IDs and Event Names

EventID

EventName

108001

Inspect SMTP

108002

Inspect SMTP

108003

Inspect ESMTP Dropped

108004

Inspect ESMTP

108005

Inspect ESMTP

108006

Inspect ESMTP Violation

108007

Inspect ESMTP

110002

No Router found

110003

Failed to Find Next hop

209003

Fragment Limit Reach

209004

Fragment invalid Length

209005

Fragment IP discard

302003

H245 Connection Start

302004

H323 Connection start

302009

Restart TCP

302010

Connection USAGE

302012

H225 CALL SIGNAL CONN

302013

Built TCP

302014

Teardown TCP

302015

Built UDP

302016

Teardown UDP

302017

Built GRE

302018

Teardown GRE

302019

H323 Failed

302020

Built ICMP

302021

Teardown ICMP

302022

Built TCP Stub

302023

Teardown TCP Stub

302024

Built UDP Stub

302025

Teardown UDP Stub

302026

Built ICMP Stub

302027

Teardown ICMP Stub

302033

Connection H323

302034

H323 Connection Failed

302035

Built SCTP

302036

Teardown SCTP

303002

FTP file download/upload

303003

Inspect FTP Dropped

303004

Inspect FTP Dropped

303005

Inspect FTP reset

313001

ICMP Denied

313004

ICMP Drop

313005

ICMP Error Msg Drop

313008

ICMP ipv6 Denied

324000

GTP Pkt Drop

324001

GTP Pkt Error

324002

Memory Error

324003

GTP Pkt Drop

324004

GTP Version Not Supported

324005

GTP Tunnel Failed

324006

GTP Tunnel Failed

324007

GTP Tunnel Failed

337001

Phone Proxy SRTP Failed

337002

Phone Proxy SRTP Failed

337003

Phone Proxy SRTP Auth Fail

337004

Phone Proxy SRTP Auth Fail

337005

Phone Proxy SRTP no Media Session

337006

Phone Proxy TFTP Unable to Create File

337007

Phone Proxy TFTP Unable to Find File

337008

Phone Proxy Call Failed

337009

Phone Proxy Unable to Create Phone Entry

400000

IPS IP options-Bad Option List

400001

IPS IP options-Record Packet Route

400002

IPS IP options-Timestamp

400003

IPS IP options-Security

400004

IPS IP options-Loose Source Route

400005

IPS IP options-SATNET ID

400006

IPS IP options-Strict Source Route

400007

IPS IP Fragment Attack

400008

IPS IP Impossible Packet

400009

IPS IP Fragments Overlap

400010

IPS ICMP Echo Reply

400011

IPS ICMP Host Unreachable

400012

IPS ICMP Source Quench

400013

IPS ICMP Redirect

400014

IPS ICMP Echo Request

400015

IPS ICMP Time Exceeded for a Datagram

400017

IPS ICMP Timestamp Request

400018

IPS ICMP Timestamp Reply

400019

IPS ICMP Information Request

400020

IPS ICMP Information Reply

400021

IPS ICMP Address Mask Request

400022

IPS ICMP Address Mask Reply

400023

IPS Fragmented ICMP Traffic

400024

IPS Large ICMP Traffic

400025

IPS Ping of Death Attack

400026

IPS TCP NULL flags

400027

IPS TCP SYN+FIN flags

400028

IPS TCP FIN only flags

400029

IPS FTP Improper Address Specified

400030

IPS FTP Improper Port Specified

400031

IPS UDP Bomb attack

400032

IPS UDP Snork attack

400033

IPS UDP Chargen DoS attack

400034

IPS DNS HINFO Request

400035

IPS DNS Zone Transfer

400036

IPS DNS Zone Transfer from High Port

400037

IPS DNS Request for All Records

400038

IPS RPC Port Registration

400039

IPS RPC Port Unregistration

400040

IPS RPC Dump

400041

IPS Proxied RPC Request

400042

IPS YP server Portmap Request

400043

IPS YP bind Portmap Request

400044

IPS YP password Portmap Request

400045

IPS YP update Portmap Request

400046

IPS YP transfer Portmap Request

400047

IPS Mount Portmap Request

400048

IPS Remote execution Portmap Request

400049

IPS Remote execution Attempt

400050

IPS Statd Buffer Overflow

406001

Inspect FTP Dropped

406002

Inspect FTP Dropped

407001

Host Limit Reach

407002

Embryonic limit Reached

407003

Established limit Reached

415001

Inspect Http Header Field Count

415002

Inspect Http Header Field Length

415003

Inspect Http body Length

415004

Inspect Http content-type

415005

Inspect Http URL length

415006

Inspect Http URL Match

415007

Inspect Http Body Match

415008

Inspect Http Header match

415009

Inspect Http Method match

415010

Inspect transfer encode match

415011

Inspect Http Protocol Violation

415012

Inspect Http Content-type

415013

Inspect Http Malformed

415014

Inspect Http Mime-Type

415015

Inspect Http Transfer-encoding

415016

Inspect Http Unanswered

415017

Inspect Http Argument match

415018

Inspect Http Header length

415019

Inspect Http status Matched

415020

Inspect Http non-ASCII

416001

Inspect SNMP dropped

419001

Dropped packet

419002

Duplicate TCP SYN

419003

Packet modified

424001

Denied Packet

424002

Dropped Packet

431001

Dropped RTP

431002

Dropped RTCP

500001

Inspect ActiveX

500002

Inspect Java

500003

Inspect TCP Header

500004

Inspect TCP Header

500005

Inspect Connection Terminated

508001

Inspect DCERPC Dropped

508002

Inspect DCERPC Dropped

509001

Prevented No Forward Cmd

607001

Inspect SIP

607002

Inspect SIP

607003

Inspect SIP

608001

Inspect Skinny

608002

Inspect Skinny dropped

608003

Inspect Skinny dropped

608004

Inspect Skinny dropped

608005

Inspect Skinny dropped

609001

Built Local-Host

609002

Teardown Local Host

703001

H225 Unsupported Version

703002

H225 Connection

726001

Inspect Instant Message

Identity Based Firewall Syslog Event IDs and Event Names

EventID

EventName

746001

Import started

746002

Import complete

746003

Import failed

746004

Exceed user group limit

746005

AD Agent down

746006

AD Agent out of sync

746007

Netbios response failed

746008

Netbios started

746009

Netbios stopped

746010

Import user failed

746011

Exceed user limit

746012

User IP add

746013

User IP delete

746014

FQDN Obsolete

746015

FQDN resolved

746016

DNS lookup failed

746017

Import user issued

746018

Import user done

746019

Update AD Agent failed

IPSec Syslog Event IDs and Event Names

EventID

EventName

402114 Invalid SPI received
402115 Unexpected protocol received
402116 Packet doesn't match identity
402117 Non-IPSEC packet received
402118 Invalid fragment offset
402119 Anti-Replay check failure
402120 Authentication failure
402121 Packet dropped
426101 cLACP Port Bundle
426102 cLACP Port Standby
426103 cLACP Port Moved To Bundle From Standby
426104 cLACP Port Unbundled
602103 Path MTU updated
602104 Path MTU exceeded
602303 New SA created
602304 SA deleted
702305 SA expiration - Sequence rollover
702307 SA expiration - Data rollover

NAT Syslog Event ID and Event Names

EventID

EventName

201002 Max connection Exceeded for host
201003 Embryonic limit exceed
201004 UDP connection limit exceed
201005 FTP connection failed
201006 RCMD connection failed
201008 New connection Disallowed
201009 Connection Limit exceed
201010 Embryonic Connection limit exceeded
201011 Connection Limit exceeded
201012 Per-client embryonic connection limit exceeded
201013 Per-client connection limit exceeded
202001 Global NAT exhausted
202005 Embryonic connection error
202011 Connection limit exceeded
305005 No NAT group found
305006 Translation failed
305007 Connection dropped
305008 NAT allocation issue
305009 NAT Created
305010 NAT teardown
305011 PAT created
305012 PAT teardown
305013 Connection denied

SSL VPN Syslog Event IDs and Event Names

EventID

EventName

716001 WebVPN Session Started
716002 WebVPN Session Terminated
716003 WebVPN User URL access
716004 WebVPN User URL access denied
716005 WebVPN ACL error
716006 WebVPN User Disabled
716007 WebVPN Unable to Create
716008 WebVPN Debug
716009 WebVPN ACL error
716010 WebVPN User access network
716011 WebVPN User access
716012 WebVPN User Directory access
716013 WebVPN User file access
716014 WebVPN User file access
716015 WebVPN User file access
716016 WebVPN User file access
716017 WebVPN User file access
716018 WebVPN User file access
716019 WebVPN User file access
716020 WebVPN User file access
716021 WebVPN user access file denied
716022 WebVPN Unable to connect proxy
716023 WebVPN session limit reached
716024 WebVPN User access error
716025 WebVPN User access error
716026 WebVPN User access error
716027 WebVPN User access error
716028 WebVPN User access error
716029 WebVPN User access error
716030 WebVPN User access error
716031 WebVPN User access error
716032 WebVPN User access error
716033 WebVPN User access error
716034 WebVPN User access error
716035 WebVPN User access error
716036 WebVPN User login successful
716037 WebVPN User login failed
716038 WebVPN User Authentication Successful
716039 WebVPN User Authentication Rejected
716040 WebVPN User logging denied
716041 WebVPN ACL hit count
716042 WebVPN ACL hit
716043 WebVPN Port forwarding
716044 WebVPN Bad Parameter
716045 WebVPN Invalid Parameter
716046 WebVPN connection terminated
716047 WebVPN ACL usage
716048 WebVPN memory issue
716049 WebVPN Empty SVC ACL
716050 WebVPN ACL error
716051 WebVPN ACL error
716052 WebVPN Session Terminated
716053 WebVPN SSO Server added
716054 WebVPN SSO Server deleted
716055 WebVPN Authentication Successful
716056 WebVPN Authentication Failed
716057 WebVPN Session terminated
716058 WebVPN Session lost
716059 WebVPN Session resumed
716060 WebVPN Session Terminated
722001 WebVPN SVC Connect request error
722002 WebVPN SVC Connect request error
722003 WebVPN SVC Connect request error
722004 WebVPN SVC Connect request error
722005 WebVPN SVC Connect update issue
722006 WebVPN SVC Invalid address
722007 WebVPN SVC Message
722008 WebVPN SVC Message
722009 WebVPN SVC Message
722010 WebVPN SVC Message
722011 WebVPN SVC Message
722012 WebVPN SVC Message
722013 WebVPN SVC Message
722014 WebVPN SVC Message
722015 WebVPN SVC invalid frame
722016 WebVPN SVC invalid frame
722017 WebVPN SVC invalid frame
722018 WebVPN SVC invalid frame
722019 WebVPN SVC Not Enough Data
722020 WebVPN SVC no address
722021 WebVPN Memory issue
722022 WebVPN SVC connection established
722023 WebVPN SVC connection terminated
722024 WebVPN Compression Enabled
722025 WebVPN Compression Disabled
722026 WebVPN Compression reset
722027 WebVPN Decompression reset
722028 WebVPN Connection Closed
722029 WebVPN SVC Session terminated
722030 WebVPN SVC Session terminated
722031 WebVPN SVC Session terminated
722032 WebVPN SVC connection Replacement
722033 WebVPN SVC Connection established
722034 WebVPN SVC New connection
722035 WebVPN Received Large packet
722036 WebVPN transmitting Large packet
722037 WebVPN SVC connection closed
722038 WebVPN SVC session terminated
722039 WebVPN SVC invalid ACL
722040 WebVPN SVC invalid ACL
722041 WebVPN SVC IPv6 not available
722042 WebVPN invalid protocol
722043 WebVPN DTLS disabled
722044 WebVPN unable to request address
722045 WebVPN Connection terminated
722046 WebVPN Session terminated
722047 WebVPN Tunnel terminated
722048 WebVPN Tunnel terminated
722049 WebVPN Session terminated
722050 WebVPN Session terminated
722051 WebVPN address assigned
722053 WebVPN Unknown client
723001 WebVPN Citrix connection Up
723002 WebVPN Citrix connection Down
723003 WebVPN Citrix no memory issue
723004 WebVPN Citrix bad flow control
723005 WebVPN Citrix no channel
723006 WebVPN Citrix SOCKS error
723007 WebVPN Citrix connection list broken
723008 WebVPN Citrix invalid SOCKS
723009 WebVPN Citrix invalid connection
723010 WebVPN Citrix invalid connection
723011 WebVPN citrix Bad SOCKS
723012 WebVPN Citrix Bad SOCKS
723013 WebVPN Citrix invalid connection
723014 WebVPN Citrix connected to Server
724001 WebVPN Session not allowed
724002 WebVPN Session terminated
724003 WebVPN CSD
724004 WebVPN CSD
725001 SSL handshake Started
725002 SSL Handshake completed
725003 SSL Client session resume
725004 SSL Client request Authentication
725005 SSL Server request authentication
725006 SSL Handshake failed
725007 SSL Session terminated
725008 SSL Client Cipher
725009 SSL Server Cipher
725010 SSL Cipher
725011 SSL Device choose Cipher
725012 SSL Device choose Cipher
725013 SSL Server choose cipher
725014 SSL LIB error
725015 SSL client certificate failed

Time Attributes in a Syslog Event

Understanding the purposes of the different time-stamps in the Event Logging page will help you filter and find the events that interest you.

Number

Label

Description

1

Date/Time

The time the Secure Event Connector (SEC) processed the event. This may not be the same as the time the firewall inspected that traffic. Same value as timestamp.

2

EventSecond

Equals with LastPacketSecond.

3

FirstPacketSecond

The time at which the connection opened. The firewall inspects the packet at this time.

The value of the FirstPacketSecond is calculated by subtracting the ConnectionDuration from the LastPacketSecond.

For connection events logged at the beginning of the connection, the value of FirstPacketSecond, LastPacketSecond, and EventSecond will all be the same.

4

LastPacketSecond

The time at which the connection closed. For connection events logged at the end of the connection, LastPacketSecond and EventSecond will be equal.

5

timestamp

The time the Secure Event Connector (SEC) processed the event. This may not be the same as the time the firewall inspected that traffic. Same value as Date/Time.

6

Syslog TimeStamp

Represents the syslog originated time if ‘logging timestamp’ is used. If the syslog does not have this info, the time the SEC received the event is reflected.

7

NetflowTimeStamp

The time at which the ASA finished gathering enough flow records/events to fill a NetFlow packet to then send them off to a flow collector.