Cisco Prime Collaboration Assurance and Analytics - Business Guide, 11.6
Bias-Free Language
The documentation set for this product strives to use bias-free language. For the purposes of this documentation set, bias-free is defined as language that does not imply discrimination based on age, disability, gender, racial identity, ethnic identity, sexual orientation, socioeconomic status, and intersectionality. Exceptions may be present in the documentation due to language that is hardcoded in the user interfaces of the product software, language used based on RFP documentation, or language that is used by a referenced third-party product. Learn more about how Cisco is using Inclusive Language.
- Updated:
- January 16, 2017
Chapter: Analyze SIP Call Signaling Flow
Analyze SIP Call
Signaling Flow
- Analyze SIP Call Signaling Flow
- Supported Call Flows
- Create a Call Ladder Diagram
- Filter a Message in the Call Ladder Diagram
- Understand a Call Ladder Diagram
Analyze SIP Call Signaling Flow
The page enables you to determine the reason of call failure. analyzes calls at a high level and then drills down to a lower level within the components themselves using the same tool.
- View the high-level view of the signaling path that includes originator, intermediate destination and final destination of calls to know the complete path of the call.
- View the signaling call ladder diagram to isolate any issues in the call.
- Drill down to individual components in that call to fix errors.
- View error messages, and possible root causes and recommendations.
- Automatically identify and highlight signaling errors and capability mismatches.
- Add any additional logs of Unified CCE to generate the Call Ladder Diagrams for Unified CCE deployments.
| Device Type | Supported Release in Advanced Mode | Supported Release in Standard Mode | Components or Type Of Log |
|---|---|---|---|
| Cisco Unified Contact Center Enterprise (Unified CCE) | 9.x and later | Not supported | Router |
| Cisco Voice Portal (CVP) | 9.x and later | Not supported | All |
| Cisco Unified Communications Manager (Unified CM) | 9.x and later | 9.x and later | Call logs, and SDL logs |
| IOS Gateways (TDM, CUBE (Enterprise Edition), VXML GWs) | 15.1(4)M and later | Not supported | Output of show logging command |
- You must add the Contact Center Assurance license to analyze call logs of Unified CCE and CVP devices. However, you can continue to use this feature for Unified CM.
- Ensure that you complete the configuration mentioned in following sections in the Configure Devices for Prime Collaboration Assurance 11.5 wiki page:
- For Standard mode, the devices must be in Managed state in .
 Note |
|
The following is required/supported by this feature:
| Maximum disk size required for this feature. | 18 GB for small, 35 GB for medium, and large profiles | ||
| Maximum file size that can be imported. | 0.5 GB for small, and 1 GB for other profiles. | ||
| Maximum number of calls that can be selected for ladder generation at a time. | 25 | ||
| Maximum number of devices from which log collection to be done at a time. | 100 | ||
| Maximum size of a zipped log file that can be parsed at one instance. | 0.5 GB for small, and 1 GB for other profiles.
|
||
| Maximum number of call records displayed on the user interface. | 10,000 | ||
| Maximum number of jobs supported concurrently. | Only one analysis job should be performed at a time. | ||
| Time to perform analysis of one log file. | It depends on the size of the file; however for a 1 GB file, the estimated time is 2 hours. |
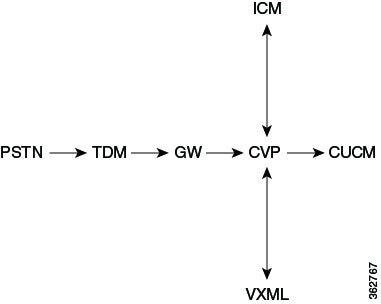
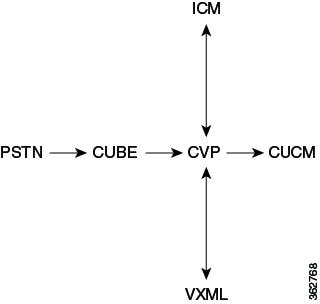
Supported Call Flows
The Call Trace feature enables you to analyze SIP-based calls.
Note | The correlation of analysis of all the call legs of the same call (end-to-end call analysis) is only supported for Call Flow 1 and 2. To support end-to-end call analysis for these calls (Call Flow 1 and 2), the CISCO-GUID (SIP Message property) should be same across different products. End-to-end call analysis is not supported for the other call flows except Call Flow 1 and 2. |
It supports the following call flows:
Create a Call Ladder Diagram
| Step 1 | Select a data
source. Choose from the following options:
| ||||||||||||||||||||||||
| Step 2 | (Optional)
Filter Calls - You can search for a call from the files selected from the
preceding data sources, using the following parameters:
| ||||||||||||||||||||||||
| Step 3 | Click the Retrieve Calls button. If you have selected the Live Log Collection option, Log Parsing In Progress status bar is displayed. After the log parsing process in completed, the Log Download In Progress status bar is displayed, indicating the process completeness. If you have selected the Local File System option, the Log Download In Progress status bar is displayed directly. If you try to parse an uploaded or existing log file, the Log Analysis In progress status bar does nor appear as that file is already parsed. The IOS Gateways and Unified CM call logs can have older data. You need to apply appropriate filters to get the specific time range call list. In case of Local File System option, the file is first unzipped, parsed and then analyzed. In case of Live Log Collection option, the file is first downloaded, unzipped, parsed, and then analyzed. | ||||||||||||||||||||||||
| Step 4 | The Call List is
displayed. Select the calls from this list, and click on
Show
Ladder Diagram for those calls. The Call Ladder diagram page is
displayed.
 |
Filter a Message in the Call Ladder Diagram
Understand a Call Ladder Diagram
The Call Ladder diagram helps to visualize the SIP signaling for selected calls (both line and trunk side).
- Direction of the messages
- Sender and Receiver
- Time Stamp of the individual messages. The Call Ladder diagram shows UTC time zone only.
- Message and the Message
Label. You can click on the message arrow to launch the Call Details popup window that displays the details of the call. You can do the following:
- View details of the call.
- You can filter the on the Call ID through this window.
- You can view the device time stamp and time zone. This time stamp is converted into UTC and displayed too.
- You can click on Click here for log to see the log snippet of the message (highlighted in yellow) you had clicked on.
Note | By default, the log snippets of the last message selected by clicking on the Click here for log button on the Call Details popup window appear. To see the logs for a particular message, click on the message arrow on the Call Ladder diagram to launch the Call Details popup window. Now, click the Click here for log button. |
Note | If there are no details of the device type in the log, you see a plain grey device icon without any markings in the Call Ladder diagram. This shows that the device is unknown. |
If you filter calls by selecting only certain devices in the Device Types to Parse field for creating a diagram, there may be components of the call (devices which have not been selected in the Device Types to Parse field) which can help in troubleshooting the call. Logs related to that device are also parsed and displayed to help you debug. These devices appear with a plus sign icon. Click the plus sign to expand the Call Ladder Diagram. The dotted line represents that a new component is added as part of the expansion. Based on time stamp order of the messages, rearrangement of the devices may happen.
If there is any error in the call, that message arrow is shown in red color. You can click on the arrow to open the Call Details popup window to view the Root Cause of the error and also the Recommendation to help you troubleshoot the cause of the call failure.
Each Call Id is differently color coded and the schema is represented below the diagram.
You can zoom in and zoom out the diagram.
 Feedback