Fault Management
Available Languages
Table Of Contents
Heartbeat Polling—Inactive Interfaces
Viewing the ATM Interface Faults Window
ATM Interface Faults Window—Detailed Description
Fault Management
This chapter contains the following information:
CGM Alarms
CGM enables you to identify faults or alarms generated by a Cisco 12000 GSR. Within the Map Viewer, you are notified of alarms on individual objects by the colored status dots next to each managed object. The following table details all status colors and their related severities.
Alarms are propagated up the object hierarchy, and are reflected up to the highest level. For example, say a critical (red) alarm occurs on an interface. If you do not have the chassis map open, and if the interface text is not apparent, how would you know an alarm had occurred at that level? The answer is: propagation. The interface alarm would be propagated up the hierarchy to site level. This means that whatever level you are working at, you will see that an alarm has occurred. You can follow the path to discover where the alarm exists.

Note
You can complement CGM by adding the Event Manager application. Among other features, the Event Manager enables you to set thresholds for certain system parameters and to monitor any supported CGM MIB variables.
Viewing Alarms
You can open the Event Browser (Events) in two different ways:
•
–
•
Figure 12-1 Query Editor Icon

For detailed information on the Query Editor, refer to the Cisco EMF User Guide.
CGM Traps
When a fault occurs on a managed object in the network, CGM receives immediate notification, through a "trap" that is sent through the network. This trap manifests itself as an alarm in CGM. The following areas support traps in CGM:
•
•
•
•
A trap on any of these objects can be one of three severity types:
•
•
•
When an alarm situation gets fixed, CGM detects the fixed situation and an "ok" trap is sent through the network, which clears the alarm.
Heartbeat Polling
Heartbeat polling takes place automatically when you commission a chassis. The chassis and all objects within the chassis are polled every five minutes. There are two types of heartbeat polling: Connectivity Management and Operational Status Polling.
The Heartbeat Polling section covers the following areas:
•
Connectivity Management
Connectivity Management—The chassis polls the management interface to see if there is management connectivity, for a Chassis, this is every 60 seconds. If management connectivity is lost, the chassis goes into a lost comms state and this state ripples down to all subchassis objects. The chassis continues to poll. If it detects re-establishment, it puts the chassis state back to the relevant state and this state ripples down to all subchassis objects as well.
Operational Status Polling
Operational Status Polling— Occurs at module and interface levels. Each module and interface polls for its own operational status, for Modules\Interfaces, this is every 5 minutes. If a module detects that its operational status is down, it goes into an Errored state. This Errored state does not propagate down to PVCs, SVCs, and subinterfaces. The interface polls for up or down status as well. If an interface goes down, you can see this in the Generic Interface Status window.
Heartbeat Polling—Inactive Interfaces
You can stop heartbeat polling on an individual interface by decommissioning the interface. You might want to do this if you have interfaces that are not yet connected or live. For example, when you commission a chassis, subchassis discovery is automatically initiated. If you have pre-deployed interfaces that are not yet live, these are discovered and put into an Errored state, after no connectivity is detected on them. An alarm is also be raised on the interface. To correct this situation, you need to decommission the inactive interface and clear the alarm manually.
Performance logging
Heartbeat polling will be unaffected if an object is in the performance logging state.
ATM Interface Faults
The ATM Interface Faults section covers the following areas:
•
•
Viewing the ATM Interface Faults Window
To view the ATM Interface Faults window, follow these steps:
Step 1
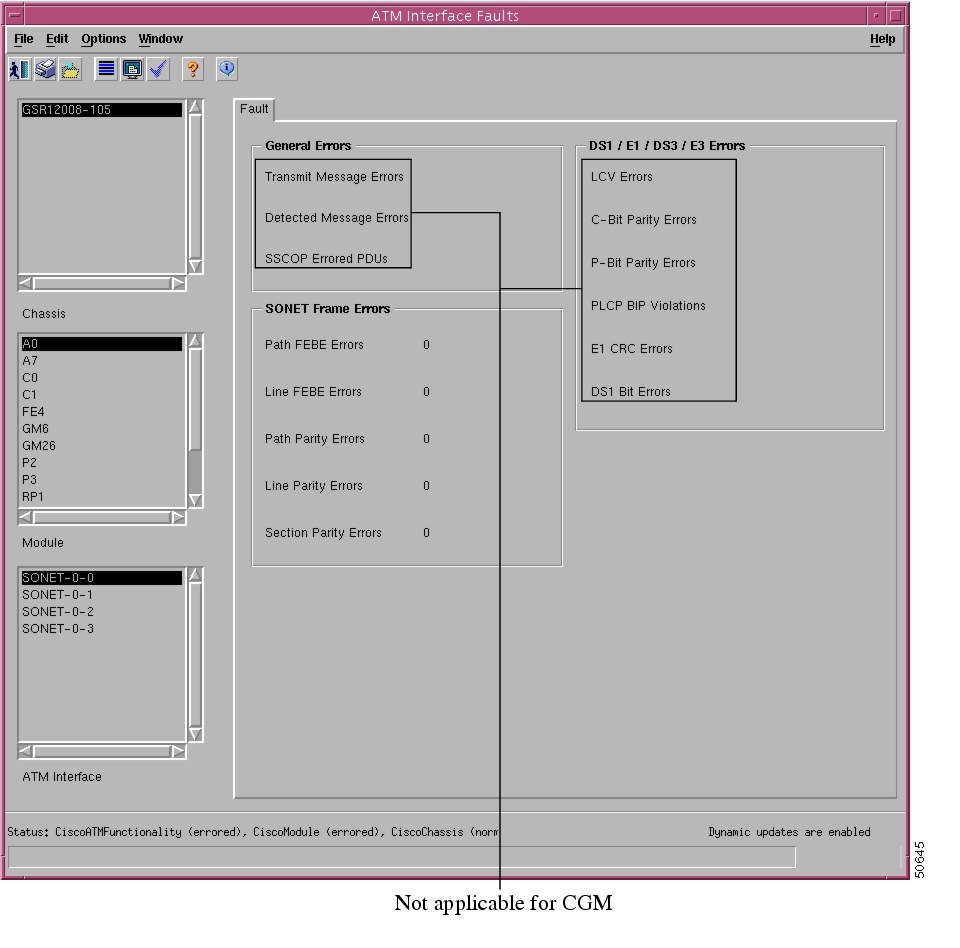
ATM>Fault. The ATM Interface Faults window appears.Figure 12-2 ATM Interface Faults Window
Step 2
ATM Interface Faults Window—Detailed Description
The ATM Interface Faults window contains a single Fault tab.
Fault Tab
The Fault tab (see Figure 12-2) contains three areas: General Errors, SONET Frame Errors, and DS1/E1/DS3/E3 Errors.
General Errors
The General Errors area is not applicable to CGM.
SONET Frame Errors
The SONET Frame Errors area displays the following information:
Path FEBE Errors—Number of G1 (path FEBE) errors on the physical interface.
Line FEBE Errors—Number of Z2 (line FEBE) errors on the physical interface.
Path Parity Errors—Number of B3 (BIP) errors on the physical interface.
Line Parity Errors—Number of B2 (BIP) errors on the physical interface.
Section Parity Errors—Number of B1 (BIP) errors on the physical interface.
DS1/E1/SD3/E3 Errors
The DS1/E1/DS3/E3 Errors area is not applicable to CGM.
 Feedback