- Cisco netManager Overview
- Managing Devices
- Understanding Workspaces and Workspace Content
- Using Topology Views
- Polling
- Using Actions
- Using Notifications
- Using Active Monitors
- Using Passive Monitors
- Using Performance Monitors
- Using Reports
- Using SNMP
- Administrative Tasks
- Events Processed
- Processed SNMP Traps and Corresponding Events
- Open Source Acknowledgements
- Using the Service Level View
- Using the Physical Connectivity View
- Topology Views Legend
- Launching Cisco netManager Tools
Using Topology Views
There are two types of topology views available in Cisco netManager: the Service Level View and the Physical Connectivity View.

Note ![]() The Service Level View is available only if you have purchased a license that monitors Unified Communication devices.
The Service Level View is available only if you have purchased a license that monitors Unified Communication devices.
Using the Service Level View
Note ![]() The Service Level View is available only if you have purchased a license that monitors Unified Communication devices.
The Service Level View is available only if you have purchased a license that monitors Unified Communication devices.
Cisco netManager's Service Level View displays a logical topology view of your Cisco Unified Communications network. You can access the Service Level View from your Home Page View or from GO > Views > Service Level.
The Service Level View shows all the Cisco Unified Communications Manager clusters: all instances of Cisco Unified Communications Manager Express, associated gateways and application servers. The Service Level View is designed so that you can set it up and leave it running, providing an ongoing monitoring tool that signals you when something needs attention.
Note ![]() When changing a Cisco Unified Communications application's registration from one Cisco Unified Communications Manager cluster to another, you must remove the registration of the application to the old Cisco Unified Communications Manager cluster in both the application and the old Cisco Unified Communications Manager cluster. If you do not do this, registration of the application with the old Cisco Unified Communications Manager cluster will continue to appear in the Down state in the Service Level View.
When changing a Cisco Unified Communications application's registration from one Cisco Unified Communications Manager cluster to another, you must remove the registration of the application to the old Cisco Unified Communications Manager cluster in both the application and the old Cisco Unified Communications Manager cluster. If you do not do this, registration of the application with the old Cisco Unified Communications Manager cluster will continue to appear in the Down state in the Service Level View.
You can use the Service Level View to:
•![]() Display a logical topology view of your Unified Communications deployment. See Starting the Service Level View.
Display a logical topology view of your Unified Communications deployment. See Starting the Service Level View.
•![]() View recent events releated to the IP telephony devices associated with Cisco Unified Communications Manager clusters. This allows you to see a visual representation of your Unified Communications deployment while, at the same time, actively monitoring all devices in your network.
View recent events releated to the IP telephony devices associated with Cisco Unified Communications Manager clusters. This allows you to see a visual representation of your Unified Communications deployment while, at the same time, actively monitoring all devices in your network.
•![]() Run other Cisco netManager tools. For more information, see "Launching Network Tools" section.
Run other Cisco netManager tools. For more information, see "Launching Network Tools" section.
•![]() Launch administration pages for devices. For more information, see "Launching Administration Pages for Devices" section.
Launch administration pages for devices. For more information, see "Launching Administration Pages for Devices" section.
Starting the Service Level View
To start the Service Level View, select GO > Views > Service Level View.
Understanding the Layout of the Service Level View
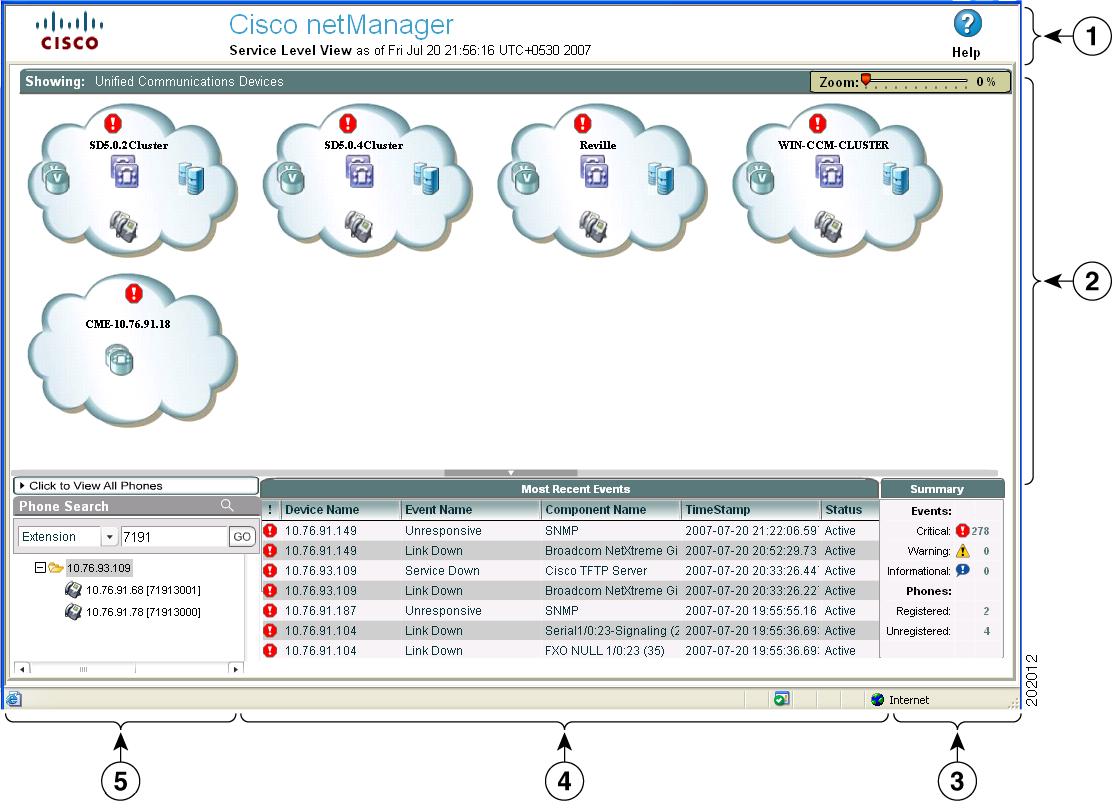
Figure 4-1 shows an example of the Service Level View.
Figure 4-1 Service Level View
|
|
Launch Information and View Status Bar Area—The launch information area shows the time on the server when the Service Level View was started. The view status bar lists the selected view, which is shown in the map display pane. |
|
Most Recent Events Pane—This displays real-time active monitoring and displays the top 7 critical events sorted by severity and the time the event occurred (including those devices not represented in the map). You can sort these events by clicking the column name. |
|
|
Map Display Pane—The map display pane shows a map-based view. For details on working with the map display pane, see Map Display Pane. |
|
Phones Pane—The phones pane allows you to locate a phone or view a phone's reports. |
|
|
Summary Pane—Displays the total number of critical, warning and informational events. It also displays the number of registered and unregistered phones. |
Phones Pane
In the phones pane, you can search for a specific phone endpoint and view the phones report. For more information, see the following topics:
•![]() Using the Search Tool to Locate a Phone
Using the Search Tool to Locate a Phone
•![]() Launching a Phone Report from the Service Level View
Launching a Phone Report from the Service Level View
Using the Search Tool to Locate a Phone
When you click a phone from the phone endpoint search results, the map display pane displays a drilled-down view, with the phone highlighted. The phone will have a logical link to the Cisco Unified Communications Manager to which it is registered.
Step 1 ![]() In the search field located in the phones pane, select whether you want to search by extension number, IP address, or MAC address.
In the search field located in the phones pane, select whether you want to search by extension number, IP address, or MAC address.
Step 2 ![]() Enter the appropriate number for the phone.
Enter the appropriate number for the phone.
Step 3 ![]() Click Go.
Click Go.
Launching a Phone Report from the Service Level View
Step 1 ![]() Do one of the following:
Do one of the following:
•![]() Click Click to View All Phones in the phones pane. The phones report for all phones opens in another window.
Click Click to View All Phones in the phones pane. The phones report for all phones opens in another window.
•![]() Right-click a phone or a Cisco Unified Communications Manager icon in the map display pane, then select Associated Phones. The phones report for the selected phone opens in another window.
Right-click a phone or a Cisco Unified Communications Manager icon in the map display pane, then select Associated Phones. The phones report for the selected phone opens in another window.
Map Display Pane
The map display pane shows the registration status of IP telephony devices. This information is displayed in a map-based view. You can drill down to devices in the display pane by clicking the cluster cloud. To get back to the cluster cloud view, click the Unified Communications Devices link (located just at the bottom of the View Status Bar Area).
Drilling down on these clouds shows the individual devices with relevant information. This gives you a quick snapshot of the overall health of your Unified Communications network.You can easily locate devices and links that may cause problems and view the underlying infrastructure of your Unified Communications network.You can view link or port status and device information by moving your cursor over any link or device icon. For more information on device icons and links, see Topology Views Legend. In general, the colors of the icons represent the following:
•![]() Green—Devices that are managed by Cisco netManager.
Green—Devices that are managed by Cisco netManager.
•![]() Gray—Devices that are not managed by Cisco netManager.
Gray—Devices that are not managed by Cisco netManager.
•![]() Red—Devices that are down.
Red—Devices that are down.
Note ![]() If a device icon is not connected to anything, it means that Cisco netManager is unable to get its connectivity details because CDP protocols are not enabled on the device.
If a device icon is not connected to anything, it means that Cisco netManager is unable to get its connectivity details because CDP protocols are not enabled on the device.
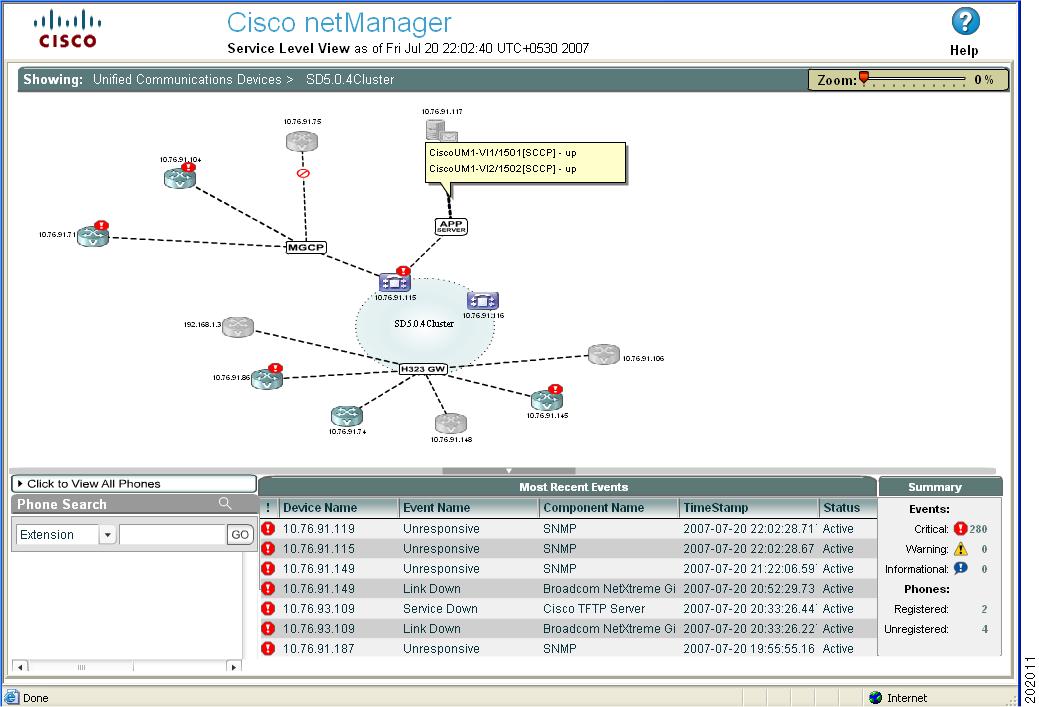
For example, in Figure 4-2, the following Service Level View information is displayed:
•![]() The large circle represents the logical grouping of Cisco Unified Communications Managers in this cluster.
The large circle represents the logical grouping of Cisco Unified Communications Managers in this cluster.
•![]() The H323 icon shows that the voice gateways are registered to the cluster using H323 protocol.
The H323 icon shows that the voice gateways are registered to the cluster using H323 protocol.
•![]() Three of the voice gateways are not monitored by Cisco netManager. Two of the managed voice gateways and the Cisco Unified Communications Manager Express have issued critical events.
Three of the voice gateways are not monitored by Cisco netManager. Two of the managed voice gateways and the Cisco Unified Communications Manager Express have issued critical events.
•![]() The MGCP icon shows that the voice gateway connected to the Cisco Unified Communications Manager is using MGCP protocol. Both devices have issued critical events.
The MGCP icon shows that the voice gateway connected to the Cisco Unified Communications Manager is using MGCP protocol. Both devices have issued critical events.
•![]() The APP Server icon shows that other IP telephony applications are connected to a Cisco Unified Communications Manager. In this example, a Cisco Unity device (voicemail server) is connected to the Cisco Unified Communications Manager.
The APP Server icon shows that other IP telephony applications are connected to a Cisco Unified Communications Manager. In this example, a Cisco Unity device (voicemail server) is connected to the Cisco Unified Communications Manager.
•![]() A tooltip displays useful information about a device or link. A tooltip appears after you move your cursor over a link or device. In this example, it displays the Cisco Unity ports' registration status with the Cisco Unified Communications Manager.
A tooltip displays useful information about a device or link. A tooltip appears after you move your cursor over a link or device. In this example, it displays the Cisco Unity ports' registration status with the Cisco Unified Communications Manager.
•![]() Gray device icons represent devices that are not managed by Cisco netManager. If you want to monitor all IP telephony devices within the cluster, you can add the device. For more information on adding devices, see Adding a New Device, page 2-4.
Gray device icons represent devices that are not managed by Cisco netManager. If you want to monitor all IP telephony devices within the cluster, you can add the device. For more information on adding devices, see Adding a New Device, page 2-4.
•![]() Blue or green device icons represent devices that are managed by Cisco netManager.
Blue or green device icons represent devices that are managed by Cisco netManager.
•![]() Red icons represent devices that are down.
Red icons represent devices that are down.
•![]() Devices that have alerts will have critical (red), warning (yellow), or informational (blue) icons in the upper-right corner of the device icon. See the Summary Pane to view actual representations of icons.
Devices that have alerts will have critical (red), warning (yellow), or informational (blue) icons in the upper-right corner of the device icon. See the Summary Pane to view actual representations of icons.
Note ![]() If a device is not part of a cluster, it will not be shown.
If a device is not part of a cluster, it will not be shown.
Note ![]() To enlarge or reduce the size of the map display, use the size slider at the top of the pane. The size slider can be used in either the Service Level View or Physical Connectivity View.
To enlarge or reduce the size of the map display, use the size slider at the top of the pane. The size slider can be used in either the Service Level View or Physical Connectivity View.
Figure 4-2 Map Display of Service Level View
Using the Physical Connectivity View
The Physical Connectivity View gives you a visual representation of all physical devices and connections in your network. This view gives a quick snapshot of your entire network, including its overall health. From the Physical Connectivity View, you can easily see which devices and connections are down.
Note![]() •
•![]() Once a device is added, it may take some time for it to be discovered and appear in the Physical Connectivity View.
Once a device is added, it may take some time for it to be discovered and appear in the Physical Connectivity View.
•![]() To enable you to view lightweight access points, CDP must be enabled and all connected switches added to the Cisco netManager database.
To enable you to view lightweight access points, CDP must be enabled and all connected switches added to the Cisco netManager database.
You can view link or port status and device information by moving your cursor over any link or device icon. For more information on device icons and links, see Topology Views Legend. In general, the color of the icons represent the following:
•![]() Green—Devices that are managed by Cisco netManager.
Green—Devices that are managed by Cisco netManager.
•![]() Gray—Devices that are not managed by Cisco netManager.
Gray—Devices that are not managed by Cisco netManager.
•![]() Red—Devices that are down.
Red—Devices that are down.
•![]() Devices that have alerts will have critical (red), warning (yellow), or informational (blue) icons in the upper-right corner of the device icon. See the Summary Pane to view actual representations of icons.
Devices that have alerts will have critical (red), warning (yellow), or informational (blue) icons in the upper-right corner of the device icon. See the Summary Pane to view actual representations of icons.
Note ![]() If a device icon is not connected to anything, it means that Cisco netManager is unable to get its connectivity details because CDP protocols are not enabled on the device.
If a device icon is not connected to anything, it means that Cisco netManager is unable to get its connectivity details because CDP protocols are not enabled on the device.
From within the Physical Connectivity View, you can also launch several Cisco netManager tools, external applications, and device administration pages. To access these tools and applications, right-click an object in the view; the available options are displayed in a menu box. For more information, see "Launching Network Tools" section.
Understanding the Layout of the Physical Connectivity View
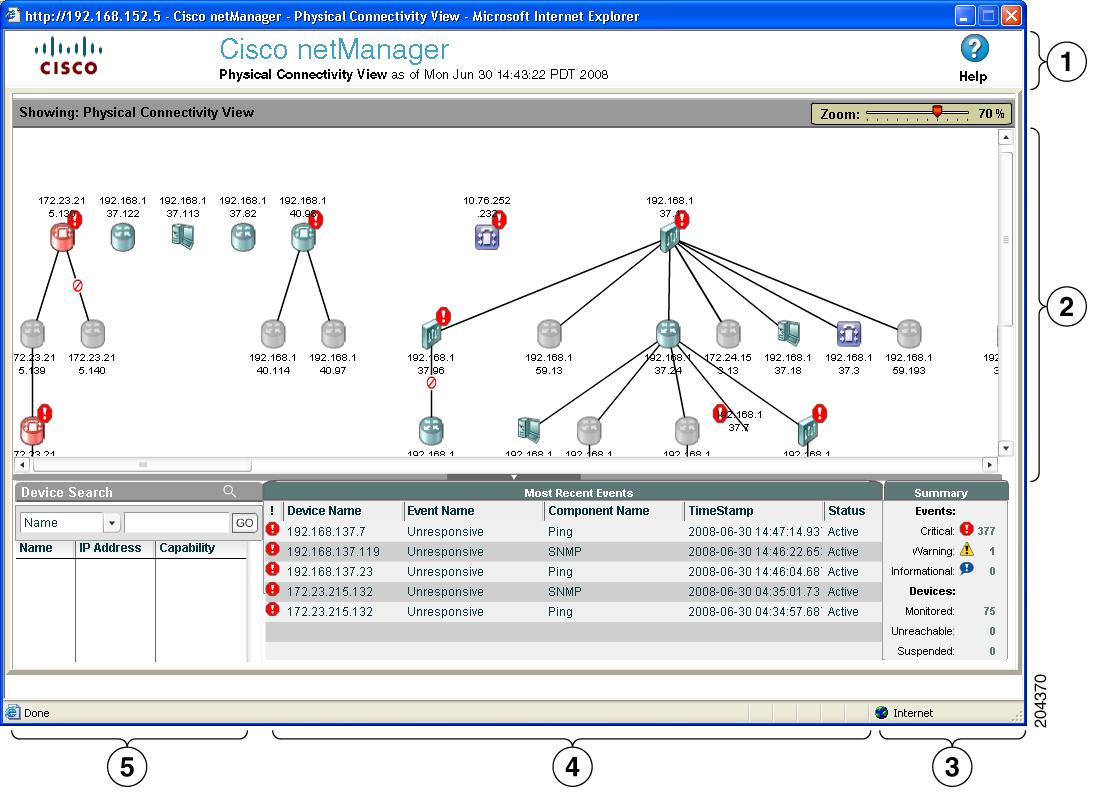
Figure 4-3 shows an example of the Physical Connectivity View.
Figure 4-3 Physical Connectivity View
|
|
Launch Information and View Status Bar Area—The launch information area shows the time on the server when the Physical Connectivity View was started. The view status bar lists the selected view, which is shown in the map display pane. |
|
Most Recent Events Pane—This displays real-time active monitoring and displays the top 7 critical events sorted by severity and time the event occurred (including those devices not represented in the map). You can sort these events by clicking the column name. |
|
|
Map Display Pane—The map display pane shows a map-based view. For details on working with the map display pane, see Map Display Pane. |
|
Device Search—The devices can be searched on the map based on IP Address or Display Name.The results of search are shown in a table (with columns for IP address, display name, and capability) and are highlighted on the map. When a row in the table is clicked, the map is zoomed to 100% and the scrollbars positioned to show the corresponding device in the visible area of the map. The Display Name search string can be any string. The IP Address has to be in the form of four octets: [0-255].[0-255].[0-255].[0-255]. An asterisk ('*') can be used in place of any of the octets like a wildcard. |
|
|
Summary Pane—Displays the total number of critical, warning and informational events. |
Starting the Physical Connectivity View
To start the Physical Connectivity View, do one of the following:
•![]() Select GO > Views > Physical Connectivity View.
Select GO > Views > Physical Connectivity View.
•![]() From Home page, select the Physical Connectivity View icon.
From Home page, select the Physical Connectivity View icon.
Displaying IP Address or Display Name
To have devices display on the Physical Connectivity View by IP address, display name, or both, do the following:
Step 1 ![]() Select GO > Configure > Physical Connectivity View Settings.
Select GO > Configure > Physical Connectivity View Settings.
Step 2 ![]() Check IP address, Display Name, or both.
Check IP address, Display Name, or both.
Topology Views Legend
Table 4-1 and Table 4-2 describe the icons and the link status that can appear in both topology views.


Note ![]() To enlarge or reduce the size of the map display, use the size slider at the top of the pane. The size slider can be used in either the Service Level View or the Physical Connectivity view.
To enlarge or reduce the size of the map display, use the size slider at the top of the pane. The size slider can be used in either the Service Level View or the Physical Connectivity view.


Launching Cisco netManager Tools
You can access several Cisco netManager tools as well as external applications through both topology views.
Note ![]() You will have access to these tools only if you have proper authorization.
You will have access to these tools only if you have proper authorization.
You can do the following:
•![]() View and acknowledge event information for a device (see Viewing Events Information and Acknowledging All Device Events).
View and acknowledge event information for a device (see Viewing Events Information and Acknowledging All Device Events).
•![]() View events and event history for a device (see Viewing Device Information).
View events and event history for a device (see Viewing Device Information).
•![]() View device information (see Viewing Device Information).
View device information (see Viewing Device Information).
•![]() View associated phones for a Cisco Unified Communications Manager (see Viewing Phones Report).
View associated phones for a Cisco Unified Communications Manager (see Viewing Phones Report).
•![]() Launch administration pages for devices (see Launching Administration Pages for Devices).
Launch administration pages for devices (see Launching Administration Pages for Devices).
•![]() Launch external applications (see Launching Network Tools).
Launch external applications (see Launching Network Tools).
Viewing Events Information
Step 1 ![]() Right-click the device for which you want to view event information.
Right-click the device for which you want to view event information.
Step 2 ![]() From the menu, select Events. The Event Report opens in a separate window. For more information, see Events, page 11-16.
From the menu, select Events. The Event Report opens in a separate window. For more information, see Events, page 11-16.
Acknowledging All Device Events
Step 1 ![]() Right-click the device for which you want to view event information.
Right-click the device for which you want to view event information.
Step 2 ![]() From the menu, select Acknowledging All Device Events. A confirmation window appears.
From the menu, select Acknowledging All Device Events. A confirmation window appears.
Step 3 ![]() Click OK to acknowledge all events for the selected device.
Click OK to acknowledge all events for the selected device.
Viewing Device Information
Step 1 ![]() Right-click the device for which you want to view information.
Right-click the device for which you want to view information.
Step 2 ![]() From the menu, select Detailed View.
From the menu, select Detailed View.
Step 3 ![]() The Device Status Workspace window appears. For a description of the Device Status Workspace, see Device Status Workspace, page 3-2.
The Device Status Workspace window appears. For a description of the Device Status Workspace, see Device Status Workspace, page 3-2.
Viewing Phones Report
You can view an associated phones report. If you are viewing an associated phones report for a switch, the report displays the phones that are connected to the switch. If you are viewing an associated phones report for a Cisco Unified Communications Manager or Cisco Unified Communications Manager Express, the report displays all the phones connected to the Cisco Unified Communications Manager or Cisco Unified Communications Manager Express, registered or unregistered.
Step 1 ![]() In the map display pane, right-click the phone, Cisco Unified Communications Manager, or Cisco Unified Communications Manager Express for which you want to view associated phones.
In the map display pane, right-click the phone, Cisco Unified Communications Manager, or Cisco Unified Communications Manager Express for which you want to view associated phones.
Step 2 ![]() From the menu, select Associated Phones.
From the menu, select Associated Phones.
The Associated Phones report for the selected device appears.
Launching Administration Pages for Devices
Some devices will allow you to launch their administration pages. The availability of these pages depends on the device type. For example, Cisco Unified Communications Manager and Cisco Unity devices provide access to their administration pages.
Step 1 ![]() Right-click the device whose administration page you want to open.
Right-click the device whose administration page you want to open.
Step 2 ![]() From the menu, select the administration page link.
From the menu, select the administration page link.
The following list shows the possible options (depending on the device):
•![]() Cisco Unified Communications Manager Administration
Cisco Unified Communications Manager Administration
•![]() Cisco Unified Communications Manager Express Administration
Cisco Unified Communications Manager Express Administration
•![]() Cisco Unified Communications Manager Serviceability
Cisco Unified Communications Manager Serviceability
•![]() Cisco Unity Administration
Cisco Unity Administration
•![]() Cisco Unity Connection Administration
Cisco Unity Connection Administration
•![]() Cisco Unity Express Administration
Cisco Unity Express Administration
The administration page opens.
Connecting to the Device Using Web Launch
Step 1 ![]() Right-click the device you want to connect to.
Right-click the device you want to connect to.
Step 2 ![]() From the menu, select Web Launch.
From the menu, select Web Launch.
Step 3 ![]() Enter the username and password for the device.
Enter the username and password for the device.
Launching Network Tools
Each view provides you with launching points for network tools that help you check on the connectivity of network devices. You can launch several external applications:
Note ![]() You can also access these tools from the context-sensitive menu available on the Devices Tab or from the GO menu. For more information, see the Context-Sensitive Menu, page 2-3 or Using the GO Menu, page 1-4.
You can also access these tools from the context-sensitive menu available on the Devices Tab or from the GO menu. For more information, see the Context-Sensitive Menu, page 2-3 or Using the GO Menu, page 1-4.
Using the Ping Tool
This tool sends out an Internet Control Message Protocol (ICMP) echo request to the network device identified in the Address/Host name field. The results of this request appear on the right side of the page after the request has been made.
Step 1 ![]() Right-click the device you want to connect to.
Right-click the device you want to connect to.
Step 2 ![]() From the menu, select Ping. The following fields appear:
From the menu, select Ping. The following fields appear:
Address/Host name—The target of the ping echo request. Enter the hostname or IP address of the device you want to check.
Timeout—Enter the amount of time (in milliseconds) for the tool to wait for a response from the device. The Ping fails if this time limit is exceeded.
Count—Enter the number of data packets sent by the Ping tool.
Packet size—Enter the size (in bytes) of the packets you want the Ping tool to send. 32 bytes is the default.
Results:
•![]() Result—Success or Failure.
Result—Success or Failure.
•![]() RTT—Round trip time; the amount of time it takes for the ping request to be returned from the remote device.
RTT—Round trip time; the amount of time it takes for the ping request to be returned from the remote device.
•![]() Address—The IP address of the device
Address—The IP address of the device
Using the DNS Lookup Tool
Lookup is a debugging tool that lets you query your Internet domain name system (DNS) server for information about a domain and its registered hosts. Lookup can show you what happens when an application on your network uses your DNS server to find the address of a remote host.
Step 1 ![]() Right-click the device you want to connect to.
Right-click the device you want to connect to.
Step 2 ![]() From the menu, select Lookup. The following fields appear:
From the menu, select Lookup. The following fields appear:
Address/Host name—Enter the hostname or IP address of the device you want to trace the route to.
Lookup Type—Select the lookup type from the drop-down list.
A—Look up the host's Internet address from the hostname.
PTR—Look up the hostname from the Internet address.
Using the Trace Route Tool
This tool sends out echo requests to a specific device, then traces the path it takes to get to that IP address or hostname. This is useful in finding out where on your network an interruption occurs.
Step 1 ![]() Right-click the device you want to connect to.
Right-click the device you want to connect to.
Step 2 ![]() From the menu, select TraceRoute. The following fields appear:
From the menu, select TraceRoute. The following fields appear:
Address/Host name—Enter the host name or IP address of the device you want to trace the route to.
Timeout—Enter the amount of time (in milliseconds) for the tool to wait on a response from the device. The trace route fails if this time limit is exceeded.
Max hops—Enter the maximum number of hops you want to limit the route to. Usually, 32 hops should be enough to find any device on the Internet.
Result—Success or Failure. This is the general result of each hop in the trace route process.
RTT #1/#2/#3—The tool sends out three ping requests to each hop in the route to the device. These columns show the round-trip time for each of the requests.
Address—The IP address of each device encountered on the path.
Host name—The host name of each device encountered on the path.
Using the Telnet Tool
Step 1 ![]() Right-click the device you want to connect to.
Right-click the device you want to connect to.
Step 2 ![]() From the menu, select Telnet. This launches a Telnet session for the device.
From the menu, select Telnet. This launches a Telnet session for the device.
Using the MAC Address Tool
This tool enables you to discover what MAC addresses are present on your network and gives you the opportunity to obtain physical connectivity information for devices on your network. This tool helps you solve IP address conflicts within your network by providing you with specific switch information.
Step 1 ![]() Enter or select the appropriate information into the following fields:
Enter or select the appropriate information into the following fields:
•![]() Local subnet—Enter the subnet you would like to find MAC addresses for.
Local subnet—Enter the subnet you would like to find MAC addresses for.
•![]() Get connectivity information from using SNMP—If you would like switch-specific connectivity information for a device in the network, select this option.
Get connectivity information from using SNMP—If you would like switch-specific connectivity information for a device in the network, select this option.
•![]() Switch IP address—Enter the switch IP address.
Switch IP address—Enter the switch IP address.
•![]() SNMP credential—Select the SNMP credential that you use to poll this device.
SNMP credential—Select the SNMP credential that you use to poll this device.
•![]() Timeout—Enter the amount of time (in milliseconds) for the tool to wait on a response from the switch. The MAC address discovery fails if this time limit is exceeded.
Timeout—Enter the amount of time (in milliseconds) for the tool to wait on a response from the switch. The MAC address discovery fails if this time limit is exceeded.
•![]() Retry—Enter the maximum number of retries when polling the switch using SNMP.
Retry—Enter the maximum number of retries when polling the switch using SNMP.
•![]() Show results in new window—Select this option to have the results displayed in a new window.
Show results in new window—Select this option to have the results displayed in a new window.
•![]() Show results in formatted mode—Select this option to have the results displayed in a table format.
Show results in formatted mode—Select this option to have the results displayed in a table format.
Step 2 ![]() Click Discover to run the test.
Click Discover to run the test.
The results of the test are displayed at the bottom of the page:
Result—Success or Failure. There are two different results for the MAC address discovery and the physical connectivity information discovery.
MAC address discovery
•![]() IP address—The IP addresses in your network.
IP address—The IP addresses in your network.
•![]() MAC address—The MAC addresses in your network.
MAC address—The MAC addresses in your network.
•![]() DNS name—The DNS names that coincide with your network's IP addresses.
DNS name—The DNS names that coincide with your network's IP addresses.
SNMP connectivity information discovery
•![]() IP address—The IP addresses of your network.
IP address—The IP addresses of your network.
•![]() MAC address—The MAC addresses in your network.
MAC address—The MAC addresses in your network.
•![]() DNS name—The DNS names that coincide with your network's IP addresses.
DNS name—The DNS names that coincide with your network's IP addresses.
•![]() Port #—The port numbers of the switch ports that are connected to the devices that own the listed MAC addresses.
Port #—The port numbers of the switch ports that are connected to the devices that own the listed MAC addresses.
•![]() Interface Index—The unique value assigned to each interface. This number typically corresponds with the interface port number.
Interface Index—The unique value assigned to each interface. This number typically corresponds with the interface port number.
•![]() Interface description—Listed as a letter and a numeral; for example, "Ethernet 5" or "B4." The interface description allows you to identify the physical connector on the switch.
Interface description—Listed as a letter and a numeral; for example, "Ethernet 5" or "B4." The interface description allows you to identify the physical connector on the switch.
 Feedback