- Cisco netManager Overview
- Managing Devices
- Understanding Workspaces and Workspace Content
- Using Topology Views
- Polling
- Using Actions
- Using Notifications
- Using Active Monitors
- Using Passive Monitors
- Using Performance Monitors
- Using Reports
- Using SNMP
- Administrative Tasks
- Events Processed
- Processed SNMP Traps and Corresponding Events
- Open Source Acknowledgements
Cisco netManager Overview
Cisco netManager is a network monitoring solution that allows you to visualize,diagnose and report status of your data and Unified Communications deployment. It monitors all components of the network to provide real-time operational status so you can identify network failures before they become catastrophic.
Cisco netManager is available in two product configurations: Cisco netManager IP Infrastructure and Cisco netManager Unified Communications. Cisco netManager IP Infrastructure provides standards-based monitoring of network devices, services, or applications on TCP/IP and Windows. Cisco netManager Unified Communications includes all features of Cisco netManager along with the additional capability to provide visibility into, and monitoring of, Cisco Unified Communications devices.

Note ![]() The ability to view and monitor Cisco Unified Communications Manager depends upon the type of licensing you have. Please see the Quick Start Guide for Cisco netManager 1.1 for licensing information.
The ability to view and monitor Cisco Unified Communications Manager depends upon the type of licensing you have. Please see the Quick Start Guide for Cisco netManager 1.1 for licensing information.
Cisco netManager includes the following key features:
•![]() A web interface that provides customizable workspaces and multiuser support to monitor operational status of all supported network and office devices.
A web interface that provides customizable workspaces and multiuser support to monitor operational status of all supported network and office devices.
•![]() Automated discovery of network elements. Information gathered include detailed inventory and device capability information. Cisco netManager also has the capability to import devices into the system via bulk import or a single device at a time.
Automated discovery of network elements. Information gathered include detailed inventory and device capability information. Cisco netManager also has the capability to import devices into the system via bulk import or a single device at a time.
•![]() Service-level and physical topology views of network devices that display current operational, performance, and device application status. This allows for faster trouble isolation through diagnostic tools with access to embedded device management tools.
Service-level and physical topology views of network devices that display current operational, performance, and device application status. This allows for faster trouble isolation through diagnostic tools with access to embedded device management tools.
•![]() Real-time operational and performance monitoring with system-defined thresholds and events.
Real-time operational and performance monitoring with system-defined thresholds and events.
•![]() Notification services: E-mail, Short Message Service (SMS), and Simple Network Management Protocol (SNMP) traps.
Notification services: E-mail, Short Message Service (SMS), and Simple Network Management Protocol (SNMP) traps.
•![]() Basic diagnostics capabilities including ping, traceroute, Telnet, and Domain Name System (DNS) lookup.
Basic diagnostics capabilities including ping, traceroute, Telnet, and Domain Name System (DNS) lookup.
•![]() A wide variety of real-time and historical reports that provide performance and availability information related to the devices in your network. Report types include the following:
A wide variety of real-time and historical reports that provide performance and availability information related to the devices in your network. Report types include the following:
–![]() Performance reports: Performance data for a selected device or device group
Performance reports: Performance data for a selected device or device group
–![]() Problem areas: Alerts reported across the network and across different data sources; for example, traps, syslogs, event logs, and performance errors.
Problem areas: Alerts reported across the network and across different data sources; for example, traps, syslogs, event logs, and performance errors.
–![]() Event history: Historical reports of all events generated by Cisco netManager for a given device or device group.
Event history: Historical reports of all events generated by Cisco netManager for a given device or device group.
–![]() General: Reports on application logs, user activity, and so on.
General: Reports on application logs, user activity, and so on.
Table 1-1 includes common tasks and corresponding sections in the online help and user guide that pertain to those tasks:
Table 1-1 Cisco netManager Common Tasks
Starting Cisco netManager
To quickly start Cisco netManager, you should do the following:
1. ![]() Launch the Web Interface, page 1-2
Launch the Web Interface, page 1-2
3. ![]() View Network Data, page 1-3
View Network Data, page 1-3
Step 1: Launch the Web Interface
You can connect to the Cisco netManager web interface from any browser by entering its web address. This web address consists of the hostname of the Cisco netManager host and the web server port number. The default port number is 80.
For example, if your Cisco netManager host is named monitor1.cisco.com, then the web address will be http://monitor1.cisco.com:80.
Note ![]() When you use the default port number (80), you do not have to include the port number in the address.
When you use the default port number (80), you do not have to include the port number in the address.
There are two default users on the web server:
•![]() Administrator (Username: admin Password: admin)
Administrator (Username: admin Password: admin)
•![]() Guest (Username: guest Password: <password box left blank>
Guest (Username: guest Password: <password box left blank>
For more information about user privileges, see Managing Users, page 13-5.
To change the default administrator password:
Step 1 ![]() From the web interface, click GO > Configure > Preferences....
From the web interface, click GO > Configure > Preferences....
Step 2 ![]() Click Change your password.
Click Change your password.
Step 2: Discover Devices
There are several ways to add devices to Cisco netManager. See the following sections for more information:
•![]() Adding a New Device—Manually adds a device using its IP address or hostname.
Adding a New Device—Manually adds a device using its IP address or hostname.
•![]() Using the Device Discovery Wizard—Automatically detects network devices (workstations, servers, routers, hubs, and so on), scans those devices for services, and lets you select the devices that you want to manage. The Device Discovery Wizard is only available from the Cisco netManager console. The console is only available from the server where Cisco netManager is installed (Start > All Programs > Cisco netManager 1.1 > Cisco netManager 1.1 Discovery).
Using the Device Discovery Wizard—Automatically detects network devices (workstations, servers, routers, hubs, and so on), scans those devices for services, and lets you select the devices that you want to manage. The Device Discovery Wizard is only available from the Cisco netManager console. The console is only available from the server where Cisco netManager is installed (Start > All Programs > Cisco netManager 1.1 > Cisco netManager 1.1 Discovery).
•![]() Importing Devices from a File—Imports multiple devices using a seed file.
Importing Devices from a File—Imports multiple devices using a seed file.
Step 3: View Network Data
Begin viewing your network using the following tools:
•![]() Topology Views
Topology Views
–![]() Service Level View displays a logical topology view of your Cisco Unified Communications network.
Service Level View displays a logical topology view of your Cisco Unified Communications network.
Note ![]() The Service Level View is available only if you have purchased a license that monitors Unified Communication devices.
The Service Level View is available only if you have purchased a license that monitors Unified Communication devices.
–![]() Physical Connectivity View gives you a visual representation of all physical devices and connections in your network. This view gives a quick snapshot of your entire network including its overall health.
Physical Connectivity View gives you a visual representation of all physical devices and connections in your network. This view gives a quick snapshot of your entire network including its overall health.
•![]() Workspaces—Contain multiple views that let you organize workspace content by the type of information they display.
Workspaces—Contain multiple views that let you organize workspace content by the type of information they display.
•![]() Reports—Used to troubleshoot and monitor performance and historical data that has been collected during the operation of the application. These reports can help you troubleshoot problem areas on your network and give you easy access to important network information.
Reports—Used to troubleshoot and monitor performance and historical data that has been collected during the operation of the application. These reports can help you troubleshoot problem areas on your network and give you easy access to important network information.
Step 4: Set Up Actions
After selecting devices, configure actions that will notify you when changes occur on the monitored devices. For more information, see Using Actions.
After you have completed discovery and set up basic monitoring of devices and services, you can investigate the other features of Cisco netManager. The following sections contain information on navigating the web interface and the various tools available to you.
Cisco netManager Web Interface
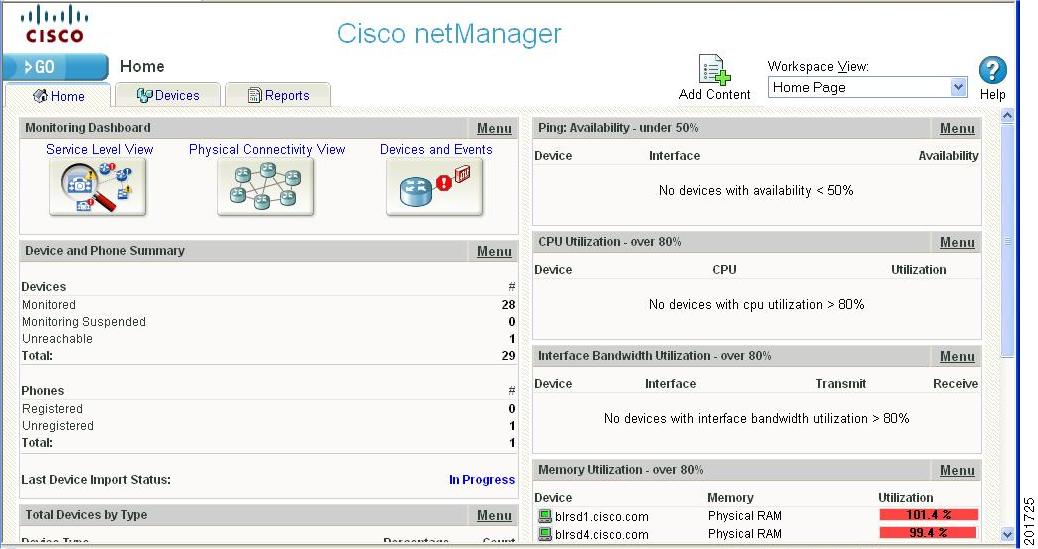
The Cisco netManager HomeSpace workspace is the first screen you see after logging in to the web interface. For more information on your home workspace, see About Workspaces, page 3-1.
Using the GO Menu
The main menu for the web interface is housed within the GO button, located in the upper-left corner of your browser. The GO menu is visible from anywhere within the web interface.
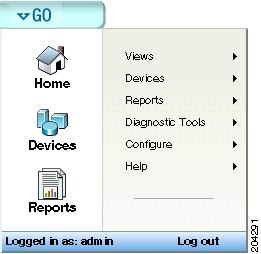
From the GO menu, you can navigate to the areas you will use most in Cisco netManager, including your Home workspace views; your monitored devices list; diagnostic tools; and the configuration of the Passive, Active, and Performance Monitor libraries. Table 1-2 lists tasks available through the GO menu and provides corresponding sections in this document, to help you.
Table 1-2
|
|
|
|
|---|---|---|
Views |
Physical Connectivity View |
|
Service Level View |
||
Devices |
My Network |
|
New Device |
||
Import Devices |
||
Rediscover Devices |
||
New From Active Discovery Results |
||
Web Alarms |
||
Reports |
Overview |
|
All Reports |
||
System |
||
Group |
||
Device |
||
Performance |
||
Problem Areas |
||
General |
||
Favorites |
||
Diagnostic Tools |
Ping |
|
Traceroute |
||
DNS Lookup |
||
MAC Address |
||
Configure |
Performance Monitor Library |
|
Active Monitor Library |
||
Passive Monitor Library |
||
Action Library |
||
Action Policies |
||
Credentials Library |
||
Recurring Actions |
||
Threshold Settings |
||
Physical Connectivity View Settings |
||
Notification Settings |
||
Default SNMP Timeout |
Configuring Global SNMP Timeout and Retry Settings, page 12-4 |
|
Manage Web Server |
||
Manage Users |
||
Manage Workspace Views |
||
LDAP Credentials |
||
IP Security |
||
Preferences |
||
Report Preferences |
GO Menu Options
Cisco netManager Tabs

The web interface is organized into three tabs:
•![]() Home
Home
•![]() Devices
Devices
•![]() Reports
Reports
You can access each of these areas by:
•![]() Clicking on an icon from the GO menu.
Clicking on an icon from the GO menu.
•![]() Selecting one of the web interface tabs.
Selecting one of the web interface tabs.
Home Tab
This universal workspace is designed to house the network information that you typically need. The default Home workspace view cannot be customized, but you can make a copy of it and then add different types of workspace content. This customizable view allows you to focus on certain network element information that is of importance. For more information on the Home workspace and workspace content, see Chapter 3, "Understanding Workspaces and Workspace Content."
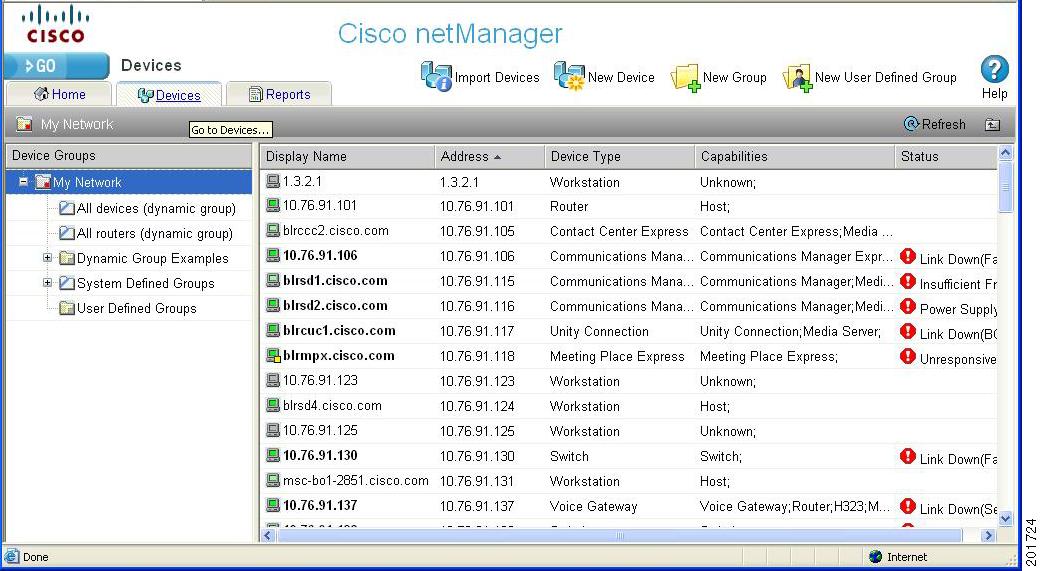
Devices Tab
The Devices tab is where you can manage and display monitored devices. For more information, see Chapter 2, "Managing Devices."
Figure 1-1 shows an example of the Devices page.
Figure 1-1 Devices Page
Reports Tab
The Reports tab opens the Reports page, which contains all of the Cisco netManager reports. Reports provide current status, performance, and historical data for devices and monitors. Workspaces let you focus on segments of the network and create your own views into the report data. They provide crucial network data in one location, which allows for quick and easy access. Cisco netManager offers over 100 instances of workspace content and reports. Each administrative user can have their own workspace with configurable workspace content. Once configured, these reports can help you troubleshoot problem areas on your network and allow easy access to important network information.
For more information on reports and workspaces, see the following:
•![]() Chapter 3, "Understanding Workspaces and Workspace Content"
Chapter 3, "Understanding Workspaces and Workspace Content"
Reports can be sent on a regular basis to an e-mail address you identify through the Recurring Report feature. Reports configured and viewed from the Reports tab are fully functioning reports. Miniature versions of these reports, or workspace content, are available for display purposes only in a workspace.
Figure 1-2 shows an example of the General Reports page.
Figure 1-2 General Reports Page
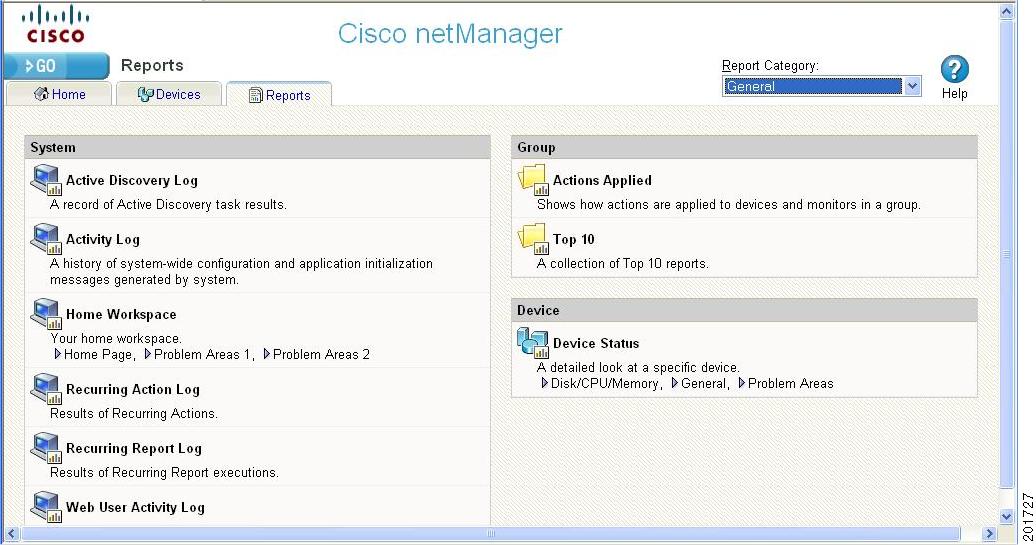
Report Category Menu
The Report Category menu allows you to jump to different report categories.
Device Management
After installing Cisco netManager you can import device credentials using a seed file or add individual devices manually or as a map. The device list shows a summary of all monitored devices in your network and also allows you to perform various tasks using the context menu. For more information, see Chapter 2, "Managing Devices."
Workspaces
Workspaces are designed to house network and device information that you typically need to view. There are two types of workspaces: Home and Device Status. Home workspace contains various network information and Device Status workspace displays device-level information. Workspaces contain multiple views that let you organize workspace content by the type of information they display. When you begin customizing your workspace views, you should consider the types of information you need to view most often, the devices to which you need to pay closest attention, and the level of detail you want to monitor through a particular workspace view. You should also take into consideration the type of workspace, and the types of workspace content you can add. For more information on workspaces and workspace content, see Chapter 3, "Understanding Workspaces and Workspace Content."
Figure 1-3 shows an example of a Device Status workspace.
Figure 1-3
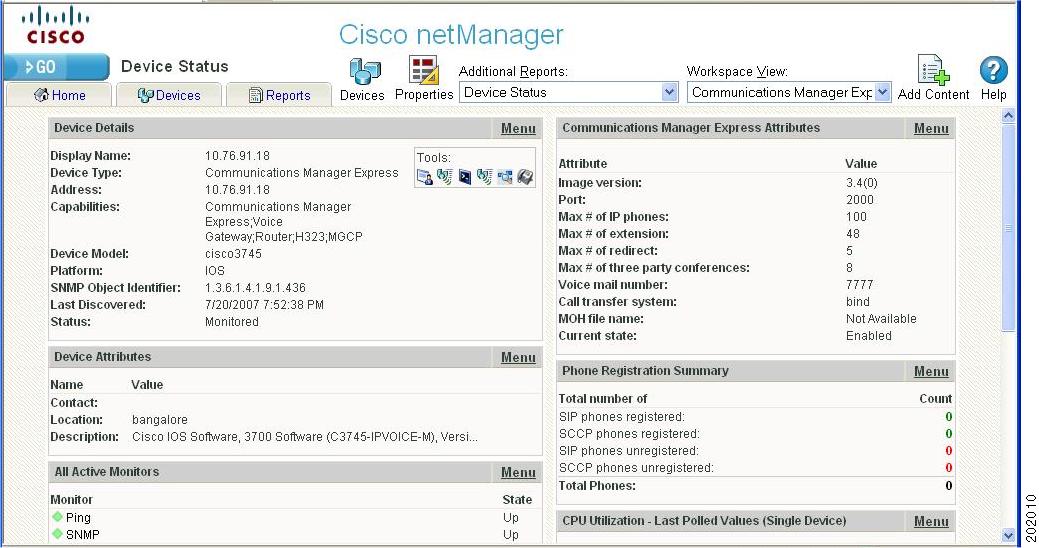
Device Status Workspace
Topology Views
Cisco netManager provides two topological views of your network:
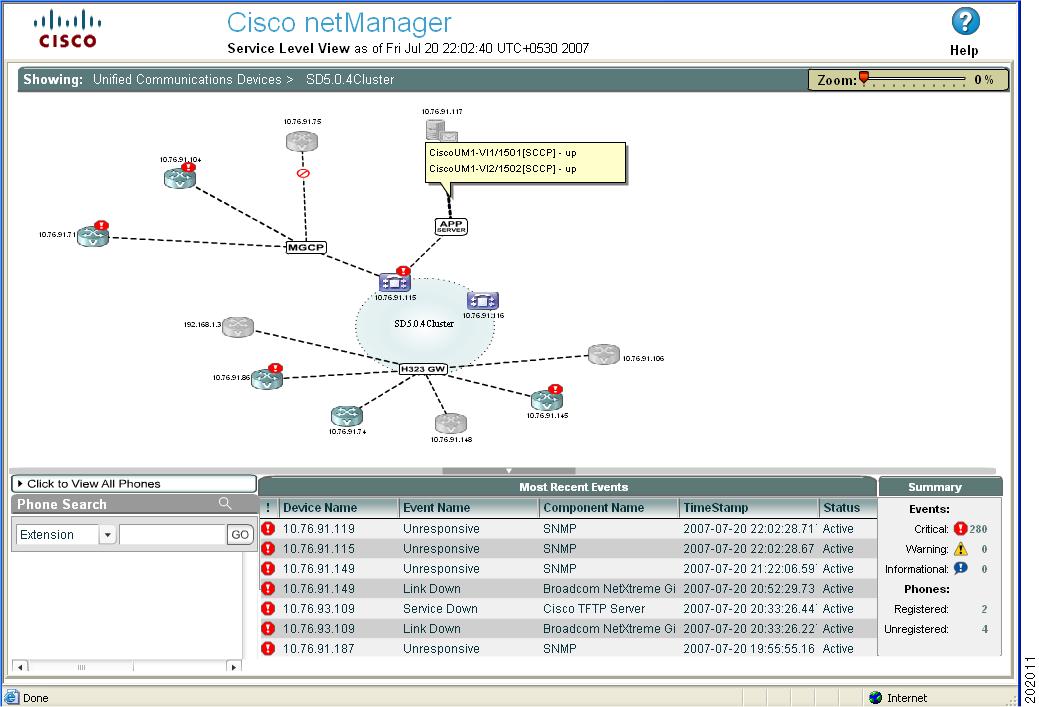
•![]() Service Level View displays a logical topology view of Unified Communication devices in your network.
Service Level View displays a logical topology view of Unified Communication devices in your network.
•![]() Topology View displays a physical topology view of all the physical connections and devices in your network.
Topology View displays a physical topology view of all the physical connections and devices in your network.
For more information, see Chapter 4, "Using Topology Views." Figure 1-4 shows an example of a Service Level View.
Figure 1-4 Service Level View
Polling and Listening
Cisco netManager actively polls devices to determine their status. You can use preconfigured monitors, or create your own, to poll services on a device, and to passively listen for messages sent across the network. Monitors can also report on device performance by checking and reporting on device resources, such as disk, CPU, and interfaces. For more information on polling and monitors see the following:
•![]() Chapter 8, "Using Active Monitors"
Chapter 8, "Using Active Monitors"
•![]() Chapter 9, "Using Passive Monitors"
Chapter 9, "Using Passive Monitors"
Actions
Depending on the responses received from polling, or the types of messages received, Cisco netManager initiates actions to notify you of any change on your network. Actions speed problem resolution through options such as alerting via e-mail or pager, or restarting a service. For more information on actions, see Chapter 6, "Using Actions."
 Feedback