Understanding Workspaces and Workspace Content
Workspaces contain multiple views that let you organize workspace content by the type of information they display. When you begin customizing your workspace views, you should consider the types of information you need to view most often, the devices to which you need to pay closest attention, and the level of detail you want to monitor through a particular workspace view. You should also take into consideration the type of workspace, and the types of workspace content you can add. For more information on workspace content, see About Workspace Content.
About Workspaces
Cisco netManager comes with two workspaces:
• Home workspace. This is the first screen you see after you log in to the web interface. This universal workspace is designed to house the network information that you typically need. The default Home workspace view cannot be customized, but you can make a copy of it and then add different types of workspace content. For more information on workspace content, see About Workspace Content.
• Device Status workspace. This workspace is limited to display only device-level workspace content. Only workspace content specific to a single device can be placed on a device status workspace. When you change the device-in-context, the workspace contents displayed show data corresponding to the newly selected device.
To access the Device Status workspace, select the Device Tab and double-click a device.
Note For changes that you make in workspace views under your account, your user account will be the only account affected by these changes.
Home Workspace
The Cisco netManager Home workspace is the first screen that you see after you log in to the web interface. This universal workspace is designed to display the network information that you typically need.
The Home Workspace contains preconfigured views:
•Home Page View
•Problem Areas 1 and Problem Areas 2.
Home Page View
The Home Page view cannot be customized, but you can make a copy of it and then add different types of workspace content. It displays typical information about the monitored devices in your network. Specific to the Home Workspace and also on the Home Page view are the following workspace contents:
•Monitoring Dashboard—Launches topology views and the device list, which displays events.
•Device and Phone Summary—Displays a summary of the number of devices and phones that are reachable. Device status can have one of the following values:
Devices
–Monitored—Device is reachable during discovery and is being polled.
–Monitoring Suspended—Polling is suspended on the device.
–Unreachable—The device did not respond to a ping.
Phones
–Registered—Phones registered with a Cisco Unified Communications Manager.
–Unregistered—Phones not registered with a Cisco Unified Communications Manager.
Note The Phones Summary will appear only if you have the appropriate license. The ability to view and monitor Unified Communication devices depends upon the type of licensing you have.
•Ping - Devices with Ping Availability under 50%—Displays devices with ping availability percentages below 50%.
Problem Areas 1 and Problem Areas 2
Problem Areas 1 and Problem Areas 2 are views that you can decide to keep, alter, expand, or remove. Each page has default workspace content that provides you with troubleshooting information.
For more information on workspace content, see About Workspace Content You can also create your own workspace views for the Home Workspace through the Manage Workspace Views dialog box. For more information, see "Managing Workspace Views" section.
Device Status Workspace
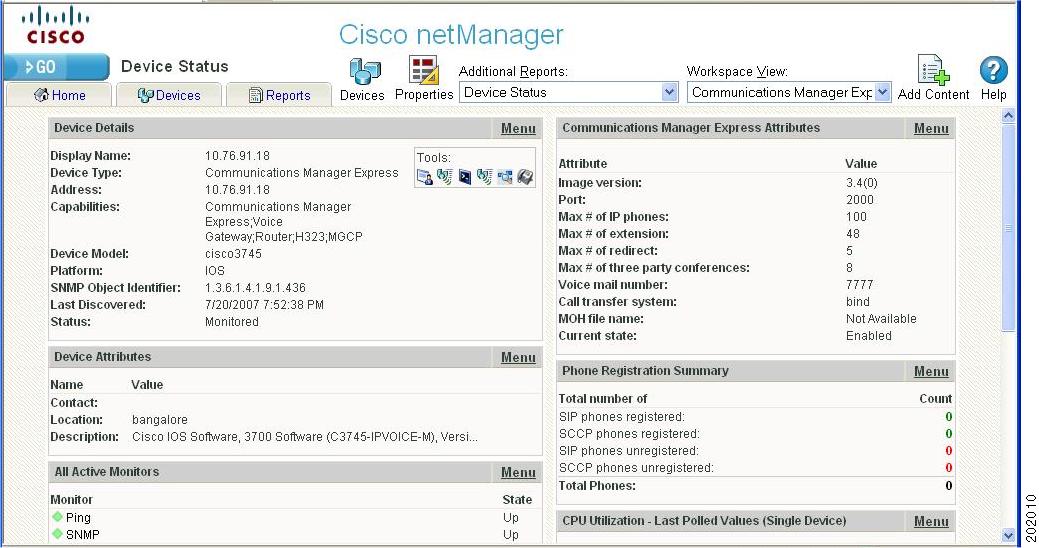
The Device Status workspace displays device details for a network device. To access the Device Status workspace, select the Device Tab and double-click a device. You can change the device-in-context, but the workspace content in each workspace view remains the same. Only workspace content specific to a single device can be placed on a device status workspace. For more information on what types of device workspace content is available, see "Device Workspace Content" section.
Figure 3-1 Device Status Workspace
Figure 3-1 shows an example of a Device Status workspace. The Devices icon opens the Devices Tab and the Properties icon opens the property attributes for the selected device.
The Device Status workspace has several preconfigured workspace views:
• Device-specific workspace (Cisco Unified Communications Manager, Cisco Unity, and so on.)
• Disk/CPU/Memory
•General
• Problem Areas
You can view full device reports by selecting a report from the More Device Reports drop-down list. For more information on Device Reports, see About Device Reports, page 11-3.
Note If workspace content or report information is not relevant or available for a selected device, the workspace content or report will show no data.
Workspace Toolbar
The Workspace Toolbar provides links for accessing the Cisco netManager workspaces, and tools for managing workspace views and content.
Figure 3-2 shows an example of the Workspace Toolbar.
Figure 3-2 Workspace Toolbar
The following options are available:
•Add Content. Use this button to add workspace content to your workspace views.
• Workspace View. Use this drop-down menu to edit your workspace views and to switch between workspace views.
• Help. Use this button to view the Cisco netManager Help for the window you are currently viewing.
Managing Workspace Views
You can create more of your own workspace views to use along with the preconfigured views. You can create as many as you feel are necessary to organize your system for efficient reporting. You can also edit these views as needed:
•From the Workspace View drop-down menu, select Manage Workspace Views.
•Select GO > Configure > Manage Workspace Views.
In the Manage Workspace Views dialog, you can create new workspace views, and edit, copy, or delete an existing workspace view.
• Click New to configure a new workspace. Figure 3-3 shows an example of a customized view that a user named Network Operations View.
• Select an existing workspace view and click Edit to change the current configuration of a workspace.
• Double-click an existing workspace to change its configuration.
• Select a workspace view, then click Copy to make a copy of that workspace and add it to the list.
• Select a workspace view, then click Copy to to copy an existing workspace to another user.
• Select a workspace monitor view, then click Delete to remove it from the list.
Figure 3-3
Customized Workspace Example
Creating a New Workspace View
Step 1 From the Manage Workspace Views dialog, select New. The New Workspace View dialog opens.
Enter the appropriate information in the following fields:
• View name. Enter a name for the workspace view.
• View type. Choose a type for the workspace view from the drop-down menu.
• Column count. Enter a value for the number of columns you wish to have in the new workspace view. Keep in mind that the more columns you include, the smaller the data displayed inside a workspace.
• Enter a value in pixels for each of the workspace columns.
Step 2 Click OK to save changes.
Editing a Workspace View
To edit a workspace view:
Step 1 From the Manage Workspace Views dialog, select Edit. The Edit Workspace View dialog opens.
Step 2 Enter the appropriate information in the following fields:
• Workspace name. The workspace title as it appears in the Workspace Library.
• Workspace type. The workspace type as it appears in the Workspace Library (Home or Device).
Note Workspace view types cannot be edited after a view is created.
• Column count. The number of columns in the workspace.
• Column width. The width of each column in the workspace, in pixels.
Step 3 Click OK to save changes.
To copy an existing workspace view:
Step 1 From the Manage Workspace Views dialog, select Copy. The Edit Workspace View dialog opens.
Enter the appropriate information in the following fields:
• Workspace name. The workspace title as it appears in the Workspace Library.
• Column count. The number of columns in the workspace.
• Column width. The width of each column in the workspace in pixels.
Step 2 Click OK to save changes.
To copy a workspace view to another Cisco netManager user:
Step 1 From the Manage Workspace Views dialog, select Copy to. The Edit Workspace View dialog opens.
Enter the appropriate information into the following fields:
• Copy to user. From the drop-down menu, select a user account in which to copy the workspace view.
• View name. The name of the workspace view as it will appear in the Workspace Library.
Step 2 Click OK to save.
Deleting a Workspace View
To delete a workspace view:
Step 1 From the Manage Workspace Views dialog, click Delete.
Step 2 Click OK on the dialog that follows.
Navigating Through Workspaces
The main way to navigate from one workspace view to another is through the Workspace toolbar. From here you can add content to a workspace, manage your workspace and workspace views, and access the Cisco netManager help system.
Workspace Toolbar
• Add Content—Use this button to add workspace content to your workspace views.
• Workspace View—Use this drop-down list to edit and switch between workspace views.
• Help—Use this button to view the Cisco netManager Help for the window you are currently viewing.
About Workspace Content
Workspace content is a quick view of a report. Cisco netManager offers a collection of more than 100 configurable types of workspace content for display in workspace views. Workspace content shows information that is similar to the information found in reports. However, workspace content is not interactive, but only displays data. Workspace content shows a quick view of a report. For more information about reports, see Chapter 11, "Using Reports."
Note If workspace content or report information is not relevant or available for a selected device, the workspace content or report will show no data.
You can do the following to workspace content in a workspace view:
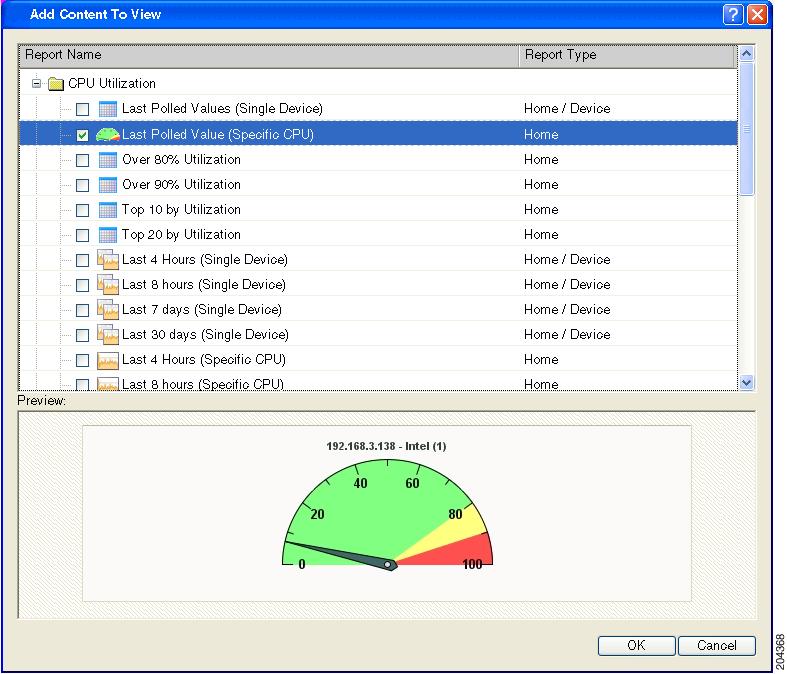
• To add content, click Add content on the Workspace Toolbar. On the Add content to view dialog, you can select multiple types of workspace content, from multiple categories. A preview for the workspace content is displayed at the bottom of the dialog.
• To remove content, go to the menu for that workspace content and select Close. Keep in mind that when you remove content, any customizations you have made to it are lost.
• To move workspace content, click its title bar and drag it to a new space in the workspace view.
You can customize a workspace by adding additional workspace contents to a workspace view. To add workspace content to a workspace view:
Step 1 In the Workspace toolbar, click Add Content. The Add Content To View page opens.
Step 2 Click the plus symbol (+) button next to a workspace content category folder, then click to select the workspace content you want to add to the workspace view.
Step 3 Click OK to save changes. The new workspace content is added to the workspace view.
Workspace Content Categories
Workspace content is categorized according to the type of information it displays:
• CPU Utilization—Displays information pertaining to device and network CPU levels.
• Custom Performance Monitors—Displays information pertaining to your custom performance monitors.
•Device—Available from the Device Status Workspace. Displays workspace content specific to a single device that is selected from the Device tab. When you change the device-in-context, the content shows data corresponding to the newly selected device.
• Disk Utilization—Displays information pertaining to device and network disk levels.
•Fan Status—Displays fan status with the last polled time stamp.
• General—Displays information on your Cisco netManager settings and diagnostics, as well as device-specific and user-configured details.
•HomePage—Available from the HomeSpace Workspace. Displays a summary of device states, devices with ping availability percentages below 50%, and a monitoring dashboard where you can launch topology views and device events of your network.
• Interface Utilization—Displays information pertaining to device and network interfaces.
• Inventory—Displays network devices and their settings, including actions, monitors, and policies.
• Memory Utilization—Displays information pertaining to device and network memory levels.
• Performance—Displays information gathered from WMI and SNMP Performance Monitors, regarding your network devices' CPU, disk, interface, and memory utilization; and ping latency and availability.
• Ping Availability and Response Time—Displays information pertaining to device ping availability, response time, and packet loss.
•Power Supply Status—Displays the device's power supply status with the last polled timestamp.
• Problem Areas—Displays troubleshooting content that allows you to investigate network issues.
•Temperature Status—Displays the device's temperature status with the last polled timestamp.
• Threshold—Displays information on your network's CPU, disk, interface, and memory utilization; also displays ping function; at or above a specific threshold.
• Top 10—Displays the top devices on your network according to their CPU, disk, interface, and memory utilization; also displays ping function.
Workspace content is listed multiple times on the Add Content dialog box. For example, Disk Utilization is listed under Disk Utilization, Threshold, Top 10, and Performance categories.
Workspace Content Types
The following are the workspace content types available in Cisco netManager:
(H) = Home
(D) = Device
CPU Utilization Workspace Content
Table 3-1 CPU Utilization Workspace Content
|
|
|
(H) Last Polled Values (specific CPU) |
Shows the CPU utilization for a specific device CPU at the time of the last poll. |
(H) All CPUs over 80% Utilization |
Lists all network devices with a CPU utilization greater than 80%. |
(H) All CPUs over 90% Utilization |
Lists all network devices with a CPU utilization greater than 90%. |
(H) Top 10 CPUs by Utilization |
Lists the top 10 devices based on their current CPU utilization percentage. |
(H) Top 20 CPUs by Utilization |
Lists the top 20 devices based on their current CPU utilization percentage. |
(D) Last 4 hours CPU Utilization (single device) |
Details all CPU utilization percentages for one device over the last 4 hours. |
(D) Last 8 hours CPU Utilization (single device) |
Details all CPU utilization percentages for one device over the last 8 hours. |
(D) Last 7 days CPU Utilization (single device) |
Details all CPU utilization percentages for one device over the last 7 days. |
(D) Last 30 days CPU Utilization (single device) |
Details all CPU utilization percentages for one device over the last 30 days. |
(H) Last 4 hours CPU Utilization (specific CPU) |
Details a specific CPU's utilization percentages for one device over the last 4 hours. |
(H) Last 8 hours CPU Utilization (specific CPU) |
Details a specific CPU's utilization percentages for one device over the last 8 hours. |
(H) Last 7 days CPU Utilization (specific CPU) |
Details a specific CPU's utilization percentages for one device over the last 7 days. |
(H) Last 30 days CPU Utilization (specific CPU) |
Details a specific CPU's utilization percentages for one device of the last 30 days. |
Custom Performance Monitor Workspace Content
Table 3-2 Custom Performance Monitor Workspace Content
|
|
|
(H) Last Polled Value (specific monitor) |
Details information on a specific custom performance monitor at the time of the last poll. |
(H) Top 10 with threshold |
Lists the top 10 devices by a custom performance monitor threshold. |
(H) Top 20 with threshold |
Lists the top 20 devices by a custom performance monitor threshold. |
(H) Top 20 by specific monitors |
Lists the top 20 devices by a specific custom performance monitor. |
(D) Last 4 hours (single device) |
Details a device's custom performance monitors over the last 4 hours. |
(D) Last 8 hours (single device) |
Details a device's custom performance monitors over the last 8 hours. |
(D) Last 7 days (single device) |
Details a device's custom performance monitors over the last 7 days. |
(D) Last 30 days (single device) |
Details a device's custom performance monitors over the last 30 days. |
(H) Last 4 hours (specific monitor) |
Details a specific custom performance monitor over the last 4 hours. |
(H) Last 8 hours (specific monitor) |
Details a specific custom performance monitor over the last 8 hours. |
(H) Last 7 days (specific monitor) |
Details a specific custom performance monitor over the last 7 days. |
(H) Last 30 days (specific monitor) |
Details a specific custom performance monitor over the last 30 days. |
Device Workspace Content
Table 3-3 Device Workspace Content
|
|
|
Device chassis summary |
Displays description and manufacturer name of chassis. |
Flash Devices summary |
Displays description, index, and size of flash devices. |
Flash Files summary |
Displays the names of flash files on the device. |
Interface summary |
Displays the description of an interface and its administrative and operational status. |
Module summary |
Displays description and operational status of modules. |
Phone registration summary |
Displays the number of Session Initiation Protocol (SIP) and Skinny Client Control Protocol (SCCP) phones that are registered to Cisco Unified Communications Manager or Cisco Unified Communications Manager Express. |
Software Image Information |
Displays various details of the software image on the device. |
Stack Summary |
Displays description and manufacturer name of stack. |
Cisco Unified Communications Manager attributes |
Displays attributes specific to the Cisco Unified Communications Manager, including hostname, description, software version, cluster ID and status. |
Cisco Unified Communications Manager Express attributes |
Displays attributes specific to the Cisco Unified Communications Manager Express. |
Unity port summary |
Displays the phone system on each port and its status. |
Unity attributes |
Displays the version of Cisco Unity on the device and the number of active, active inbound, outbound, and outbound active ports. |
Unity Express attributes |
Displays attributes specific to the Cisco Unity Express. |
Voice gateway registration summary |
Displays number of voice gateways registered with a Cisco Unified Communications Manager. |
Voice services summary |
Displays the status of all voice services associated with this device. |
Wireless LWAP channel utilization |
Displays a list of interfaces on the access points and their channel utilization. |
Wireless LWAP summary |
Displays names of lightweight access points and the operational status for a wireless LAN controller. |
Disk Utilization Workspace Content
Table 3-4 Disk Utilization Workspace Content
|
|
|
(D) Last Polled Values (single device) |
Shows the disk utilization for all of a device's disks at the time of the last poll. |
(H) Last Polled Values (specific disk) |
Shows the disk utilization for a specific device disk at the time of the last poll. |
(H) All Disks Over 80% |
Lists all network devices with a disk utilization greater than 80%. |
(H) All Disks Over 90% |
Lists all network devices with a disk utilization greater than 90%. |
(H) Top 10 Disks by Percent Utilization |
Lists the top 10 devices based on their current disk utilization percentage. |
(H) Top 20 Disks by Percent Utilization |
Lists the top 20 devices based on their current disk utilization percentage. |
(H) Top 10 Disks by Free Space |
Lists the top 10 devices based on their current free disk space. |
(H) Top 20 Disks by Free Space |
Lists the top 20 devices based on their current free disk space. |
(D) Last 4 hours Disk Utilization (single device) |
Details all disk utilization percentages for one device over the last 4 hours. |
(D) Last 8 hours Disk Utilization (single device) |
Details all disk utilization percentages for one device over the last 8 hours. |
(D) Last 7 days Disk Utilization (single device) |
Details all disk utilization percentages for one device over the last 7 days. |
(D) Last 30 days Disk Utilization (single device) |
Details all disk utilization percentages for one device over the last 30 days. |
(H) Last 4 hours Disk Utilization (single device) |
Details a specific disk's utilization percentages for one device over the last 4 hours. |
(H) Last 8 hours Disk Utilization (specific disk) |
Details a specific disk's utilization percentages for one device over the last 8 hours. |
(H) Last 7 days Disk Utilization (specific disk) |
Details a specific disk's utilization percentages for one device over the last 7 days. |
(H) Last 30 days Disk Utilization (specific disk) |
Details a specific disk's utilization percentages for one device over the last 30 days. |
(H) Last 4 hours Disk Free Space (specific disk) |
Details a specific disk's free space for one device over the last 4 hours. |
(H) Last 8 hours Disk Free Space (specific disk) |
Details a specific disk's free space for one device over the last 8 hours. |
(H) Last 7 days Disk Free Space (specific disk) |
Details a specific disk's free space for one device over the last 7 days. |
(H) Last 30 days Disk Free Space (specific disk) |
Details a specific disk's free space for one device over the last 30 days. |
Fan Status
The Fan Status report displays the fan status on the device with the last polled timestamp.
General Workspace Content
Table 3-5 General Workspace Content
|
|
|
(D) Device Attributes |
Displays a device's attributes configured in Device Properties > Attributes. |
(D) Device SNMP Details |
Displays a device's SNMP details. |
(D) Device Details |
Displays a device's details configured in Device Properties > General. |
(D) Device Custom Links |
Displays any custom links assigned to a device in Device Properties > Custom Links. |
(D) Device Dependencies |
Shows the state of a device and any devices that are up or down dependent on that device. |
(D) Device Active Monitor States |
Lists all of a device's active monitors and their current state. |
(D) Performance Monitor Summary |
Displays a polling summary for the device-in-context. |
(H) Map View |
Displays a smaller version of a network map. |
(H) Database Size |
Displays a graphical representation of the Cisco netManager database at the time of the last poll. |
(H) Custom Links |
Displays any custom links that you add to the workspace. |
(H) Free Form Text/HTML |
Displays any free-form text or HTML code that you add to the workspace. |
(H) Web User Activity Log |
Displays a log of when a user logs in or out of the web interface, and the actions taken while logged in. |
(H) Interface Details |
Displays SNMP information reported by a specific network interface. |
(H) User Orientation |
Displays information regarding the workspaces, and workspace content. |
Interface Utilization Workspace Content
Table 3-6 Interface Utilization Workspace Content
|
|
|
(D) Last Polled Interface (single device) |
Shows the interface utilization for all network interfaces at the time of the last poll. |
(H) Last Polled Interface (specific interface) |
Shows the interface utilization for a specific network interface at the time of the last poll. |
(H) All Interfaces over 80% Bandwidth Utilization |
Lists all network interfaces with a utilization greater than 80%. |
(H) All Interfaces over 90% Bandwidth Utilization |
Lists all network interfaces with a utilization greater than 90%. |
(H) Top 10 Devices by Bandwidth Utilization |
Lists the top 10 devices based on their current interface utilization. |
(H) Top 20 Devices by Bandwidth Utilization |
Lists the top 20 devices based on their current interface utilization. |
(H) Top 10 Devices by Interface Traffic |
Lists the top 10 devices based on their current interface traffic. |
(H) Top 20 Devices by Interface Traffic |
Lists the top 20 devices based on their current interface traffic. |
(D) Last 4 hours Interface Utilization
(single device) |
Details all interface utilization percentages for one device over the last 4 hours. |
(D) Last 8 hours Interface Utilization (single device) |
Details all interface utilization percentages for one device over the last 8 hours. |
(D) Last 7 days Interface Utilization
(single device) |
Details all interface utilization percentages for one device over the last 7 days. |
(D) Last 30 days Interface Utilization
(single device) |
Details all interface utilization percentages for one device over the last 30 days. |
(H) Last 4 hours Interface Utilization
(specific interface) |
Details a specific interface's utilization for one device over the last 4 hours. |
(H) Last 8 hours Interface Utilization
(single device) |
Details a specific interface's utilization for one device over the last 8 hours. |
(H) Last 7 days Interface Utilization
(specific interface utilization) |
Details a specific interface's utilization for one device over the last 7 days. |
(H) Last 30 days Interface Utilization
(specific interface utilization) |
Details a specific interface's utilization for one device over the last 30 days. |
Inventory Workspace Content
Table 3-7 Inventory Workspace Content
|
|
|
(H) Total Devices by Type |
Lists all monitored network devices by type and number. |
(H) Total Active Monitors by Type |
Lists all active monitors on the network by type and number. |
(H) Total Passive Monitors by Type |
Lists all passive monitors on the network by type and number. |
(H) Total Performance Monitors by Type |
Lists all performance monitors on the network by type and number. |
(H) Total Actions Applied by Type |
Lists all actions on the network by type and number. |
(H) Total Devices with Specific Attributes |
Lists all devices with a specific attribute. |
(H) Active Discovery Results |
Once an active discovery is performed, the results are listed here. |
Memory Utilization Workspace Content
Table 3-8 Memory Utilization Workspace Content
|
|
|
(D) Last Polled Memory Utilization (single device) |
Shows the memory utilization for all of a device's memory at the time of the last poll. |
(H) Last Polled Memory Utilization
(specific aspect) |
Shows the memory utilization for a specific network device at the time of the last poll. |
(H) All Memories over 80% Utilization |
Lists all network devices with a memory utilization greater than 80%. |
(H) All Memories over 90% Utilization |
Lists all network devices with a memory utilization greater than 90%. |
(H) Top 10 Devices by Memory Utilization |
Lists the top 10 devices based on their current memory utilization. |
(H) Top 20 Devices by Memory Utilization |
Lists the top 20 devices based on their current memory utilization. |
(D) Last 4 hours Memory Utilization (single device) |
Details all memory utilization percentages for one device over the last 4 hours. |
(D) Last 8 hours Memory Utilization (single device) |
Details all memory utilization percentages for one device over the last 8 hours. |
(D) Last 7 days Memory Utilization (single device) |
Details all memory utilization percentages for one device over the last 7 days. |
(D) Last 30 days Memory Utilization (single device) |
Details all memory utilization percentages for one device over the last 30 days. |
(H) Last 4 hours Memory Utilization
(specific aspect) |
Details a specific memory's utilization for one device over the last 4 hours. |
(H) Last 8 hours Memory Utilization
(specific aspect) |
Details a specific memory's utilization for one device over the last 8 hours. |
(H) Last 7 days Memory Utilization
(specific aspect) |
Details a specific memory's utilization for one device over the last 7 days. |
(H) Last 30 days Memory Utilization
(specific aspect) |
Details a specific memory's utilization for one device over the last 30 days. |
Performance - Historic Workspace Content
Table 3-9 Performance - Historic Workspace Content
|
|
|
(D) Custom Performance Monitor Values (last 4 hours - single device) |
Details a device's custom Performance Monitor values over the last 4 hours. |
(D) Interface Utilization
(last 4 hours - single device) |
Details all interface utilization percentages for one device over the last 4 hours. |
(D) CPU Utilization
(last 4 hours - single device) |
Details all CPU utilization percentages for one device over the last 4 hours. |
(D) Memory Utilization
(last 4 hours - single device) |
Details all memory utilization percentages for one device over the last 4 hours. |
(D) Disk Utilization
(last 4 hours - single device) |
Details all disk utilization percentages for one device over the last 4 hours. |
(D) Ping Response Time
(last 4 hours - single device) |
Details all ping response times for device's interfaces over the last 4 hours. |
(D) Ping Availability
(last 4 hours - single device) |
Details all ping availability for a device's interfaces over the last 4 hours. |
(H) Interface Traffic
(last 4 hours - specific interface) |
Details interface traffic for a specific device interface over the last 4 hours. |
(H) Custom Performance Monitor Values (last 4 hours - specific monitor) |
Details a device's specific custom Performance Monitor values over the last 4 hours. |
(H) Interface Utilization
(last 4 hours - specific interface) |
Details a specific interface's utilization percentages for one device over the last 4 hours. |
(H) CPU Utilization
(last 4 hours - specific CPU) |
Details a specific CPU's utilization percentages for one device over the last 4 hours. |
(H) Memory Utilization
(last 4 hours - specific memory) |
Details a specific memory's utilization percentages for one device over the last 4 hours. |
(H) Disk Utilization
(last 4 hours - specific disk) |
Details a specific disk's utilization percentages for one device over the last 4 hours. |
Performance - Last Poll Workspace Content
Table 3-10 Performance - Last Poll Workspace Content
|
|
|
(D) Custom Performance Monitor Values (single device) |
Shows the values for all of a device's custom Performance Monitors at the time of the last poll. |
(D) Interface Utilization (single device) |
Shows the interface utilization for all of a device's interfaces at the time of the last poll. |
(D) CPU Utilization (single device) |
Shows the CPU utilization for all of device's CPUs at the time of the last poll. |
(D) Memory Utilization (single device) |
Shows the memory utilization for all of a device's memory at the time of the last poll. |
(D) Disk Utilization (single device) |
Shows the disk utilization for all of a device's disks at the time of the last poll. |
(H) Custom Performance Monitor Values (specific monitor) |
Shows the values for a specific device custom Performance Monitor. |
(H) Interface Utilization (specific interface) |
Shows the utilization of a specific device interface at the time of the last poll. |
(H) CPU Utilization (specific CPU) |
Shows the utilization of a specific device CPU at the time of the last poll. |
(H) Memory Utilization (specific aspect) |
Shows the utilization of a specific device memory at the time of the last poll. |
(H) Disk Utilization (specific disk) |
Shows the utilization of a specific device disk at the time of the last poll. |
(H) Ping Response Time (specific interface) |
Shows the ping response time of a specific device interface at the time of the last poll. |
Ping Availability and Response Time Workspace Content
Table 3-11 Ping Availability and Response Time Workspace Content
|
|
|
(D) Last 4 hours (single device) |
Shows the ping response time for all of a device's interfaces over the last 4 hours. |
(D) Last 8 hours (single device) |
Shows the ping response time for all of a device's interfaces over the last 8 hours. |
(D) Last 7 days (single device) |
Shows the ping response time for all of a device's interfaces over the last 7 days. |
(D) Last 30 days (single device) |
Shows the ping response time for all of a device's interfaces over the last 30 days. |
(D) Last 4 hours (single device) |
Shows the ping availability for all of a device's interfaces over the last 4 hours. |
(D) Last 8 hours (single device) |
Shows the ping availability for all of a device's interfaces over the last 8 hours. |
(D) Last 7 days (single device) |
Shows the ping availability for all of a device's interfaces over the last 7 days. |
(D) Last 30 days (single device) |
Shows the ping availability for all of a device's interfaces over the last 30 days. |
(H) Last Polled Response Time (specific interface) |
Shows the last ping response time of a specific device interface at the time of the last poll. |
(H) Top 10 by Ping Response Time |
Lists the top 10 devices based on their current ping response time. |
(H) Top 20 by Ping Response Time |
Lists the top 20 devices based on their current ping response time. |
(H) Top 10 by Ping Packet Loss |
Lists the top 10 devices based on their current ping packet loss. |
(H) Top 20 by Ping Packet Loss |
Lists the top 20 devices based on their current ping packet loss. |
(H) Devices with Ping Response Time over 100 msec |
Lists all devices with a ping response time greater than 100 msec. |
(H) Devices with Ping Response Time over 500 msec |
Lists all devices with a ping response time greater than 500 msec. |
(H) Devices with Ping Packet Loss over 50% |
Lists all devices with a ping packet loss greater than 50%. |
(H) Devices with Ping Packet Loss over 75% |
Lists all devices with a ping packet loss greater than 75%. |
(H) Devices with Ping Availability over 75% |
Lists all devices with a ping availability greater than 75%. |
Power Supply Status
This report displays the device's power supply status with the last polled timestamp.
Problem Areas Workspace Content
Table 3-12 Problem Areas Workspace Content
|
|
|
(D) Devices with Down Active Monitors |
Displays a device's down active monitors. |
(D) All Down Interfaces |
Displays a device's down interfaces. |
(D) Tail of State Change Log |
Displays the tail (last 10 records) of the State Change Log for a specified device. |
(D) Tail of Syslog |
Displays the tail (last 10 records) of the Syslog full report for a specified device. |
(D) Tail of Windows Event Log |
Displays the tail (last 10 records) of the Windows Event Log for a specified device. |
(D) Tail of SNMP Trap Log |
Displays the tail (last 10 records) of the SNMP Trap Log for a specified device. |
(D) Tail of Action Activity Log |
Displays the tail (last 10 records) of the Action Activity Log for a specified device. |
(D) Tail of Passive Monitor Error Log |
Displays the tail (last 10 records) of the Passive Monitor Error Log for a specified device. |
(D) Web Alarms |
Displays any web alarms fired for a specified device. |
(D) Tail of Device Events |
Displays the tail (last 10 records) of the Event Log for a specified device. |
(H) All Completely Down Devices |
Displays down devices for a specified device group. |
(H) All Down Interfaces |
Displays down interfaces for a specified device group. |
(H) Devices with Down Active Monitors |
Displays devices with down active monitors within a specified device group. |
(H) Unacknowledged Devices |
Displays unacknowledged devices within a specified device group. |
(H) Devices that have fired an Action
in the last X hours |
Displays devices that have fired an action over the selected time period. |
(H) Tail of State Change Log |
Displays a tail of the State Change Log for your network. |
(H) Summary Counts |
Displays a summary of a specified device group. |
(H) Tail of Syslog |
Displays the tail of the Syslog full report for your network. |
(H) Tail of Windows Event Log |
Displays the tail of the Windows Event Log for your network. |
(H) Tail of SNMP Trap Log |
Displays the tail of the SNMP Trap Log for your network. |
(H) Tail of Action Activity Log |
Displays the tail of the Action Activity Log for your network. |
(H) Tail of Passive Monitor Error Log |
Displays the tail of the Passive Monitor Error Log for your network. |
(H) Map View |
Displays a smaller version of a network map. |
(H) Device Group Mini Status |
Lists all devices in a device group and displays their status by color. |
(H) Web Alarms |
Shows a snapshot of the most recent web alarms fired on your network. |
(H) General Error Log |
Displays the tail of the General Error Log for your network. |
Temperature Status
This workspace content displays the device's temperature status with the last polled timestamp. The temperature sensor name is a hyperlink that will take you to the Temperature Statistics report.
Threshold Workspace Content
Table 3-13 Threshold Workspace Content
|
|
|
(H) Ping Response Time |
Displays the top devices based on their current ping response time thresholds. |
(H) Ping Packet Loss |
Displays the top devices based on their current ping packet loss thresholds. |
(H) CPU Utilization |
Displays the top devices based on their current CPU utilization percentage thresholds. |
(H) Memory Utilization |
Displays the top devices based on their current memory utilization percentage thresholds. |
(H) Disk Utilization |
Displays the top devices based on their current disk utilization percentage thresholds. |
(H) Disk Free Space |
Displays the top devices based on their current disk free space thresholds. |
(H) Interface Utilization |
Displays the top devices based on their current interface utilization percentage thresholds. |
(H) Interface Traffic |
Displays the top devices based on their current interface traffic thresholds. |
(H) Custom WMI/SNMP |
Displays the top devices based on their current custom WMI/SNMP thresholds. |
(H) Ping Availability |
Displays the top devices based on their current ping availability thresholds. |
Configuring Threshold Settings
To configure threshold settings:
Step 1 From the GO menu, select Configure > Threshold Settings. The default values are shown for each parameter.
Step 2 Enter the new value in the New Value column.
Step 3 Click OK.
Top 10 Workspace Content
Table 3-14 Top 10 Workspace Content
|
|
|
(H) Ping Response Time |
Displays the top devices based on their current ping response time. |
(H) Ping Packet Loss |
Displays the top devices based on their current ping packet loss. |
(H) CPU Utilization |
Displays the top devices based on their current CPU utilization. |
(H) Memory Utilization |
Displays the top devices based on their current memory utilization. |
(H) Disk Utilization |
Displays the top devices based on their current disk utilization. |
(H) Disk Free Space |
Displays the top devices based on their current disk free space. |
(H) Interface Utilization |
Displays the top devices based on their current interface utilization. |
(H) Interface Traffic |
Displays the top devices based on their current interface traffic. |
(H) Custom WMI/SNMP |
Displays the top devices based on their current custom WMI/SNMP. |
(H) Ping Availability |
Displays the top devices based on their current ping availability. |
About the Workspace Content Menu
Each workspace content type has a menu on the right side of its title bar. From the workspace content menu, you can access help, go to the configuration dialog, or close the content. Closing the content removes it from a workspace view. Keep in mind that after you remove workspace content from a workspace, any customization you have made to the workspace content is lost.
Configuring Workspace Content
Workspace content is designed for customization to fit your own specific display needs. From a workspace content's menu, select Configure to bring up its Configuration dialog. On the Configuration dialog, you'll have the chance to do a number of things, including:
• Changing the content title
• Selecting a device or device group for the content
• Changing the height and width of the content
• Changing the width of certain content columns
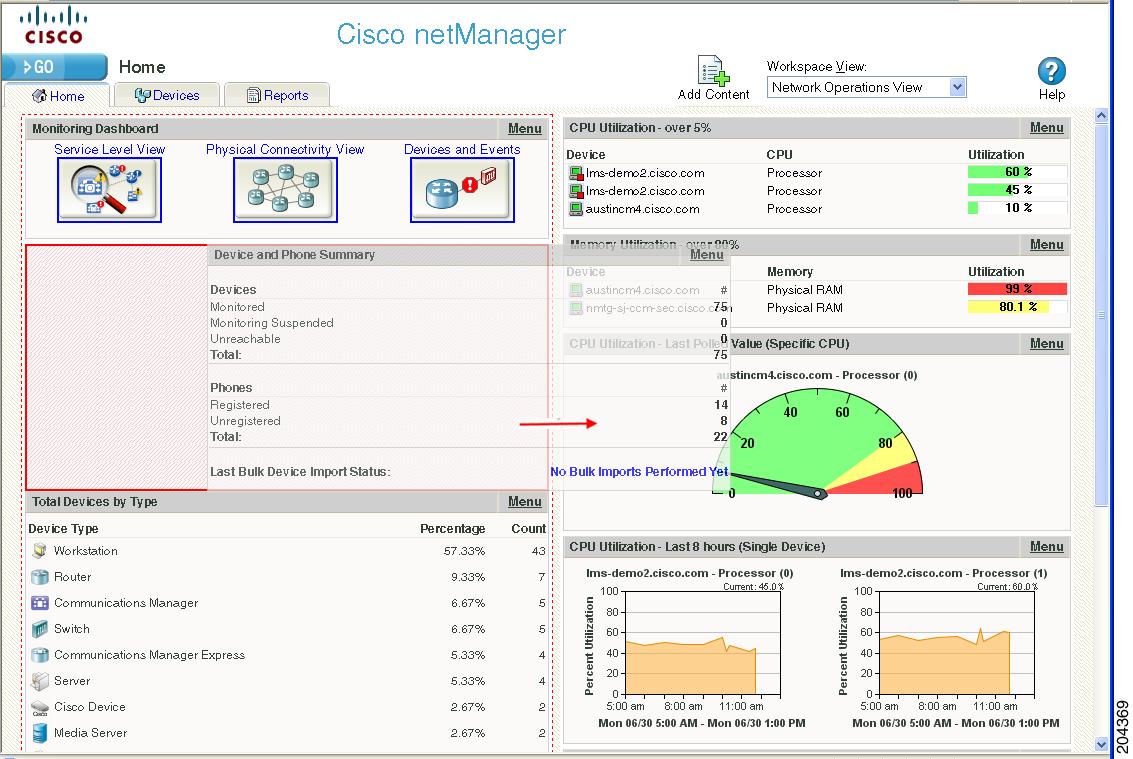
Moving Workspace Content Within a Workspace
Cisco netManager supports click-and-drag within the web interface, see Table 3-14. You can move workspace content types from one column of a workspace view to another by selecting it and dragging it to another area of the workspace view. These location changes are saved: workspace content will appear in the same location to which you moved it after you log off from the web interface, or after you move between workspace views.
Figure 3-4 Moving Workspace Content
.


 Feedback