Cisco DNA Center Platform User Guide, Release 2.1.1
Bias-Free Language
The documentation set for this product strives to use bias-free language. For the purposes of this documentation set, bias-free is defined as language that does not imply discrimination based on age, disability, gender, racial identity, ethnic identity, sexual orientation, socioeconomic status, and intersectionality. Exceptions may be present in the documentation due to language that is hardcoded in the user interfaces of the product software, language used based on RFP documentation, or language that is used by a referenced third-party product. Learn more about how Cisco is using Inclusive Language.
The Cisco DNA Center platform provides you with the following software developer tools to access and program with Cisco DNA Center, as well as to integrate Cisco DNA Center with other applications:
APIs: Available APIs organized within categories by functionality (for example, Operational Tasks or Site Management APIs).
Integration Flows: Available integration flows organized by category type. Currently, only IT Service Management (ITSM) is available.
Multivendor Support: Provides a description of multivendor support, as well as a link to Cisco DevNet for additional information.
Events: Provides a window to view and subscribe to specific events that may occur in your network.
Work with APIs
Perform this procedure to review available APIs, generate example code for using the APIs, and try out the APIs interactively
on the Cisco DNA Center platform. You accomplish these tasks using the APIs window in the Cisco DNA Center GUI.
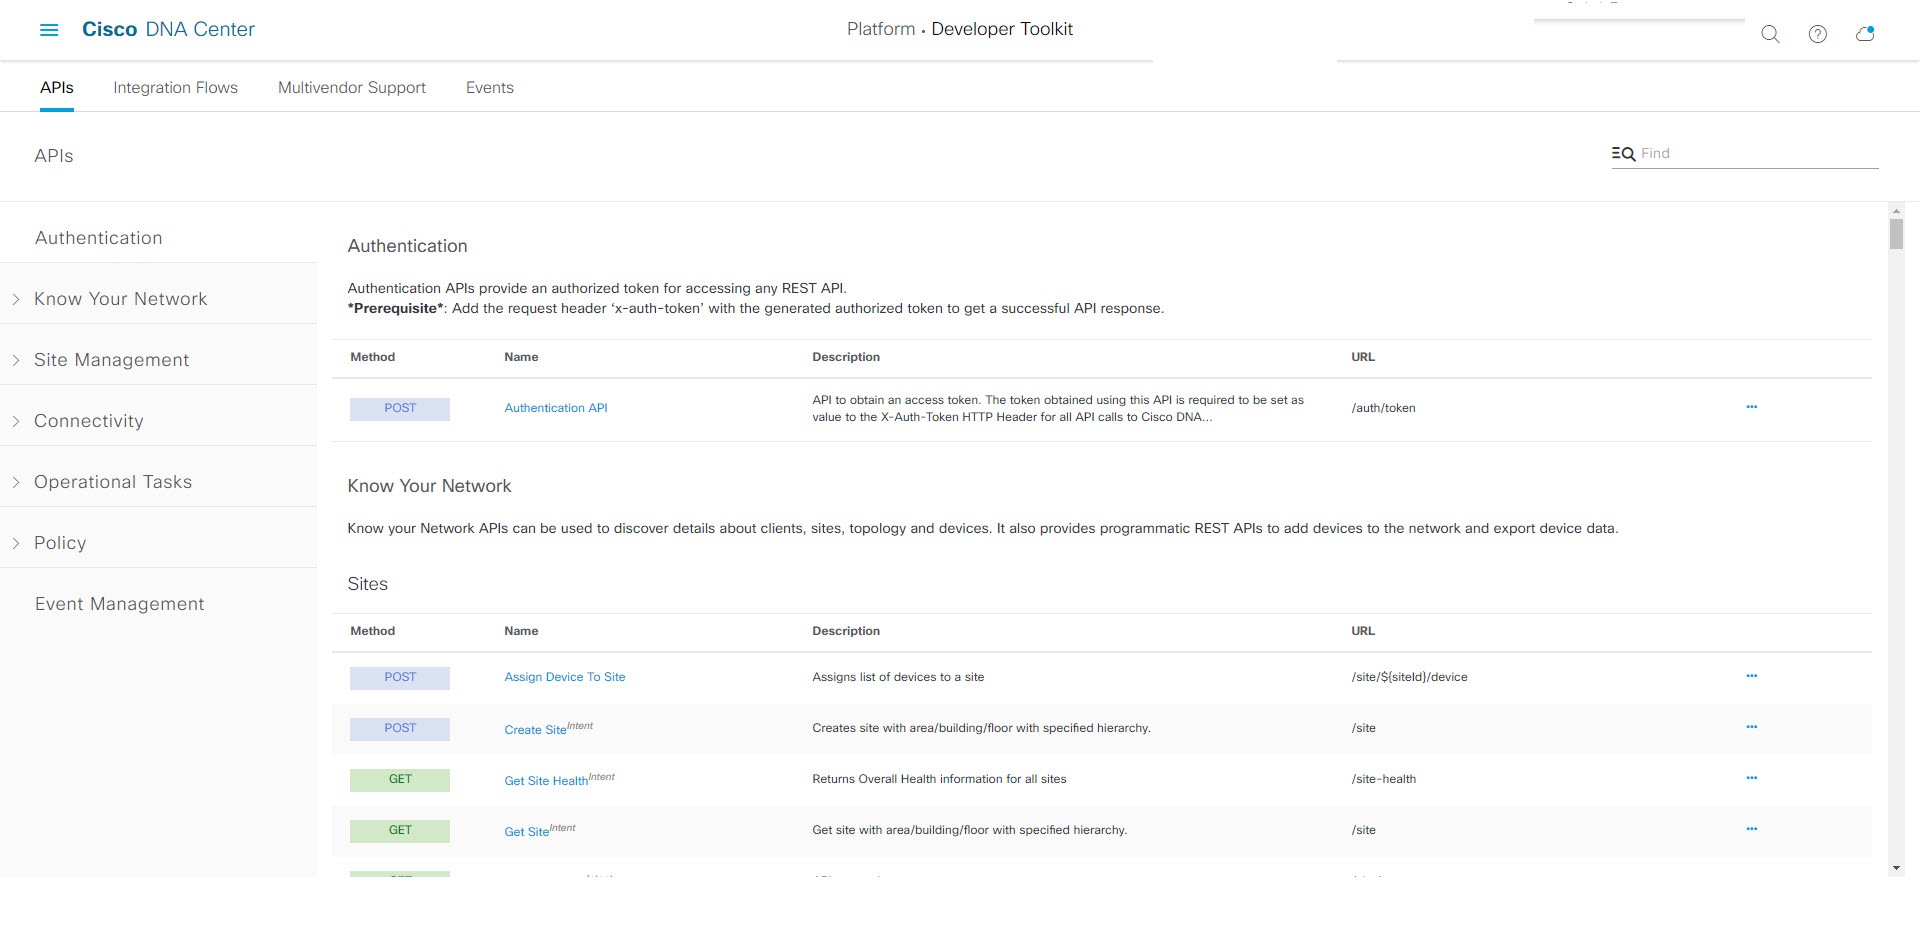
Figure 1. Cisco DNA Center Platform APIs Window
The Cisco DNA Center GUI displays documentation about each API call, including the request method and URL, query parameters, request header parameters,
responses, and schema, and ways to preview or test the request.
Before you begin
Ensure that you have installed Cisco DNA Center Release GA 2.2.1. For information about installing the latest Cisco DNA Center
release, see the Cisco Digital Network Architecture Installation Guide.
Ensure that you have met the supported programming language and authentication prerequisites, as described in the previous
section. For more information, see API Prerequisites.
Note
You must first enable the Rogue and aWIPS bundle to view these specific APIs. Click the Menu icon > Platform > Manage > Bundles > Rogue and aWIPS > Enable. After enabling this bundle, you can view the APIs within the bundle under the Contents tab or click Platform > Developer Toolkit > APIs > Know Your Network > Devices.
Procedure
Step 1
In the Cisco DNA Center GUI, click the Menu icon () and choose Platform > Developer Toolkit > APIs.
Step 2
Review the APIs displayed by the GUI.
At any point in time, you will see a list of supported APIs for your release version.
If necessary, click the angle icon, > to display
the API subdomains.
Step 3
Choose an API from the domains and subdomains.
Note
The APIs are organized based on the Cisco DNA Center platform as a platform capabilities model. For example, APIs are grouped as
Authentication, Know Your
Network, Site Management,
Connectivity, Operational
Tools, Policy, Event
Management, and Ecosystem
Integrations.
After choosing an API, the following information is displayed in columns:
Method: Supported methods include GET, POST, PUT, and DELETE.
Name: Link to access the slide-in pane and additional information, including description, features,
tags, parameters, responses, model schemas, and so on.
Description: Brief description of method.
URL: URL value for the method.
Icon (…): Accesses links to create a code preview snippet or Try It option.
Note
A blue color-coded message may appear stating that the specific API configuration is still in progress and to check back at
a later time. The screen will auto refresh when the API is registered and you may proceed with your API activity. In the highly
unlikely event that a red color-coded message appears stating that the API cannot be configured, contact your Cisco DNA Center administrator to contact Cisco for assistance in resolving the issue.
Step 4
Click the name (link) of an API method.
The following information about the API method is displayed:
DESCRIPTION: Brief description of API.
FEATURES: Method and URL information.
TAGS: API identifiers, including where and under what circumstances you would use the API. Note that some APIs may not have tags.
PARAMETERS: Parameters of API, including
description, data type (boolean or string), default value, and
required value.
RESPONSES: Possible HTTP responses.
MODEL SCHEMAS: Presents response as a data model (Model tab) or JSON format of the actual response (Model Schema tab). Sample code is available from the Code Preview button.
POLICIES: An API rate limiting feature, where policies are applied to certain APIs. These policies set the number of API calls per
time interval per client IP address.
Step 5
(Optional) Generate a code preview by clicking Code Preview.
Note
If you are creating your own program, you can cut and paste the code preview sample into your own program.
Step 6
(Optional) In the Code Preview window, choose a language from the drop-down to generate the code.
The following languages are supported:
Shell
Node - HTTP
Node - Unirest
Node - Request
Python
Ruby
JavaScript
JQuery
PHP
Go
Ansible
After reviewing or copying the code preview sample for use, click Close.
Step 7
(Optional) Try the method by clicking Try It.
Step 8
(Optional) In the Try It window, fill in the requested values (for example, URL address or value) and click Run.
After reviewing the response and/or error code, click Close.
When Cisco DNA Center returns a 202 (Accepted) HTTP status code, the result body includes a task ID and a URL that you can use to query for more
information about the asynchronous task that your original request spawned. For example, you can use this information to determine
whether a lengthy task has completed. For more information, see Getting Information about Asynchronous Operations.
Note
The response is a live response from Cisco DNA Center itself, and the results reflect the actual state of your network. In contrast, the code previews are static and contain placeholders
for values that you must supply.
Work with Integration Flows
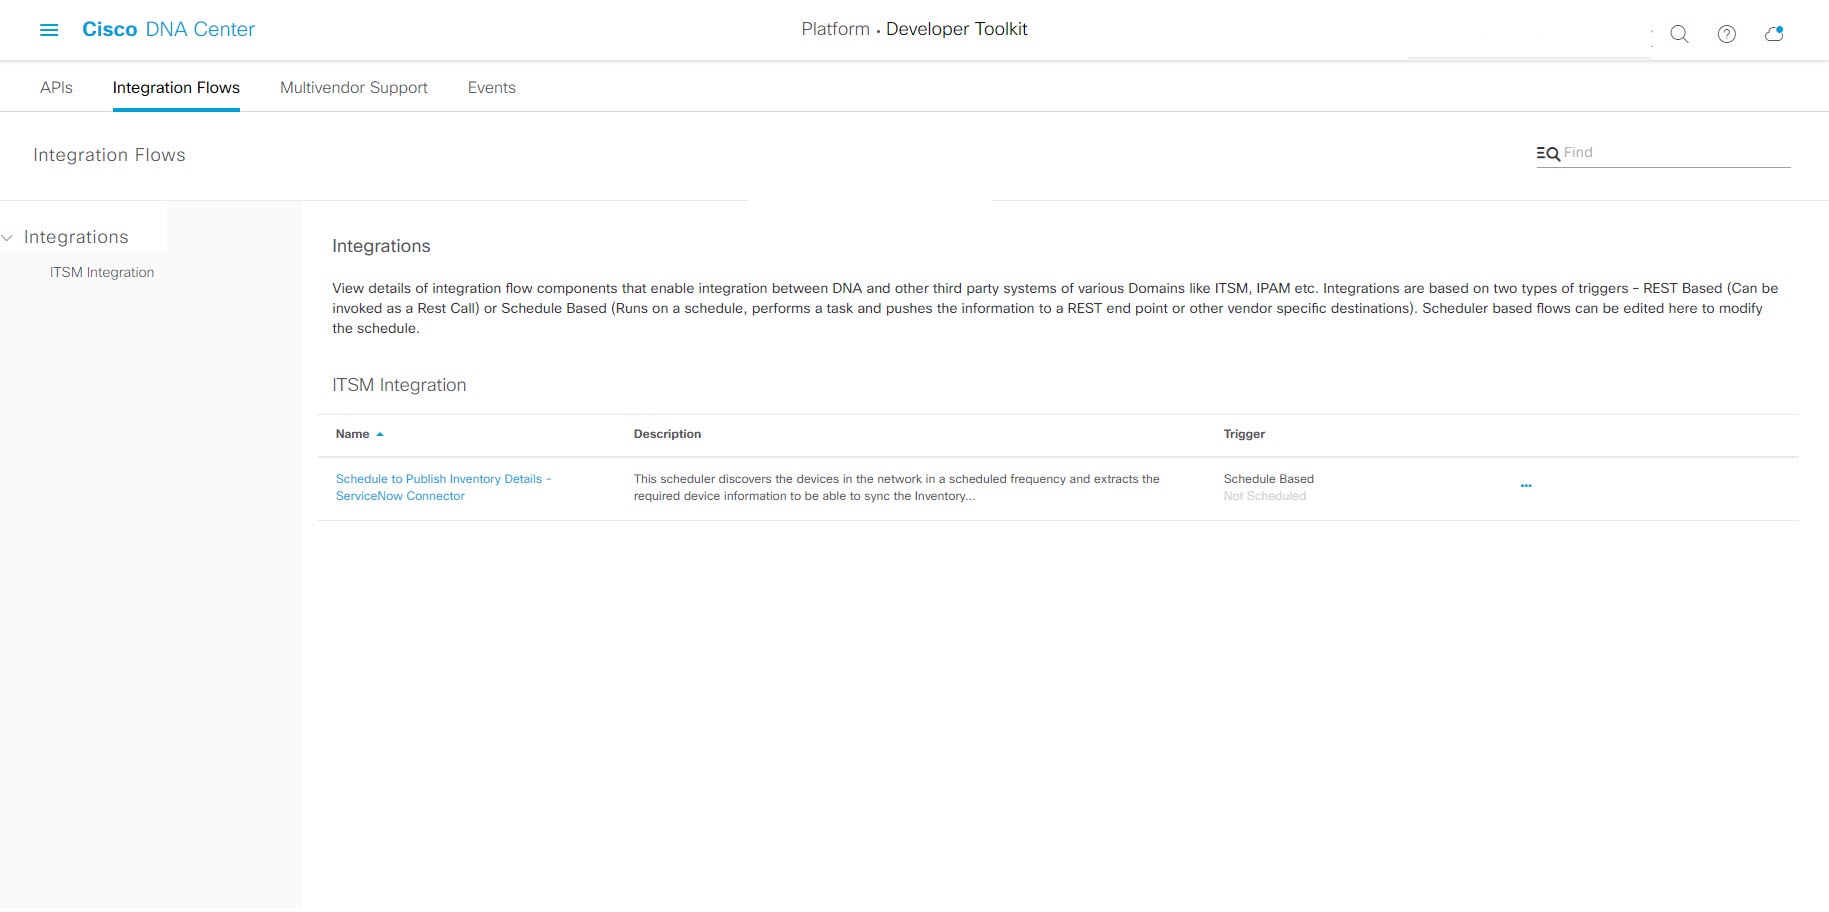
An integration flow defines the interaction between Cisco DNA Center platform and a third-party system, such as an ITSM system that is used to track, troubleshoot, and resolve network issues.
Cisco DNA Center platform supports schedule-based integration flows. This type of integration flow runs on a schedule, performs a task, and pushes
the information to a REST endpoint or other vendor-specific destination. Schedule-based integration flows can be edited in
the GUI using the Integration Flows window to specify the schedule on which they execute.
Note
The integration flows available in the Developer Toolkit are used by various bundles in Manage > Bundles. Bundles are used to integrate your own applications with Cisco DNA Center or to enhance the performance of Cisco DNA Center itself. You can view the integration flows used in a bundle by clicking the bundle in Manage and clicking the Contents tab. Integration flows for the bundle are listed under the Contents tab.
Figure 2. Cisco DNA Center Platform Integration Flows Window
Before you begin
Ensure that you have installed Cisco DNA Center Release GA 2.2.1. For information about installing the latest Cisco DNA Center
release, see the Cisco Digital Network Architecture Installation Guide.
Ensure that you have enabled and scheduled the integration flows that you will review and manage in the Integration Flows window.
Note
Prior to being able to view and manage integration flows in the Integration Flows window, you must enable them. You enable integration flows from the individual bundles in the Cisco DNA Center platform. For example, click the Menu icon () > Platform > Developer Toolkit > Manage > Bundles > Basic ITSM (ServiceNow) CMDB synchronization > Contents tab. Click the Enable button.
Procedure
Step 1
In the Cisco DNA Center GUI, click the Menu icon () and choose Platform > Developer Toolkit > Integration Flows.
Step 2
Review the integration flows displayed by the GUI.
Note
Available integration flows are organized by group. For this release, the only group available is ITSM Integration.
Step 3
Choose an integration flow from the ITSM Integration group.
The following information is displayed:
Name: Name of the integration flow and link to access a slide-in pane where additional information is available.
If the integration flow is a REST based trigger type, after you click the integration flow name additional data such as description,
tags, parameters, responses, model schemas, and policies appear.
If the integration flow is a schedule based trigger type, after you click the integration flow name a slide-in pane for setting the schedule appears. This slide-in pane displays DESCRIPTION, TAGS, and HOW TO USE THIS FLOW content.
Description: Brief description of integration flow.
Trigger: REST-based or Schedule based.
Icon (…): Accesses links to create a code preview or the Try It option. If the integration flow is schedule based, this icon accesses a Schedule Flow option.
Step 4
For a REST-based integration flow, click on the name (link) of the integration flow.
A slide-in pane opens with details about the REST-based integration flow, You can review the details and then close the slide-in pane.
Step 5
For a REST-based integration flow, generate a code preview snippet by mousing over the Icon (…) and clicking Generate Code Preview.
These choices appear only for REST-based triggered integration flows. Schedule based integration flows provide a Schedule
Flow menu item on hover.
Step 6
In the Code Preview window, choose a programming language from the drop-down to generate the code.
After reviewing or copying the code for use, click Close.
Step 7
To try a REST request path interactively, mouse over the Icon (…) and click Try It.
Step 8
In the Try It window, fill in the requested values (for example, URL address or value) and click Run.
After trying the method, review the response and/or error code within the Try It window, and click Close.
When Cisco DNA Center returns a 202 (Accepted) HTTP status code, the result body includes a task ID and a URL that you can use to query for more
information about the asynchronous task that your original request spawned. For example, you can use this information to determine
whether a lengthy task has completed. For more information, see Getting Information about Asynchronous Operations.
Note
For responses, Cisco DNA Center APIs use a task-based response architecture so that multiple requests and responses can be sent concurrently. Therefore,
all PUT, POST, and DELETE requests have a task-based response. To view more details about the response, send a GET request
to the task URL (either from a script or as a URL). For error codes, the Cisco DNA Center APIs follow the standard HTTP status codes.
Step 9
For the schedule based integration flow, mouse over the Icon (…) and click Schedule Flow.
Step 10
Review the following displayed data:
DESCRIPTION: Description and purpose of integration flow.
TAGS: Tags indicate what the Cisco DNA Center component is used for or affected by the bundle.
HOW TO USE THIS FLOW: Schedule configuration options.
You can schedule the integration flow using the GUI.
Step 11
Configure a schedule for the integration flow using the following GUI options:
Run Now: Choose Run Now and then click the Schedule button to run the integration flow.
Run Later: Choose Run Later and then enter a date, time, and time zone. Click the Schedule button to run the integration flow at the specified date, time, and time zone.
Recurring: Choose Recurring and then configure the following options:
Repeats: Choose daily or weekly repeating occurrences for the integration flow
Run at Interval: Set the time interval between integration flows.
Set Schedule Start: Set a start date.
Set Schedule End: Set an end date.
Click the Schedule button to run the integration at the configured times.
About Multivendor SDK Support
Cisco DNA Center permits users to manage their non-Cisco devices. Multivendor support is available to Cisco DNA Center in the form of an SDK that can used to create device packs for third-party devices. The device package enables Cisco DNA Center to understand how to communicate to the third-party device by encapsulating the southbound protocol used to communicate with
the device.
Specifically, the following features are currently supported with the Cisco DNA Center Multivendor SDK:
Device Discovery
Device viewing in Inventory and Topology
Network Assurance for the devices
Ability to run show-style commands using Command Runner on the devices
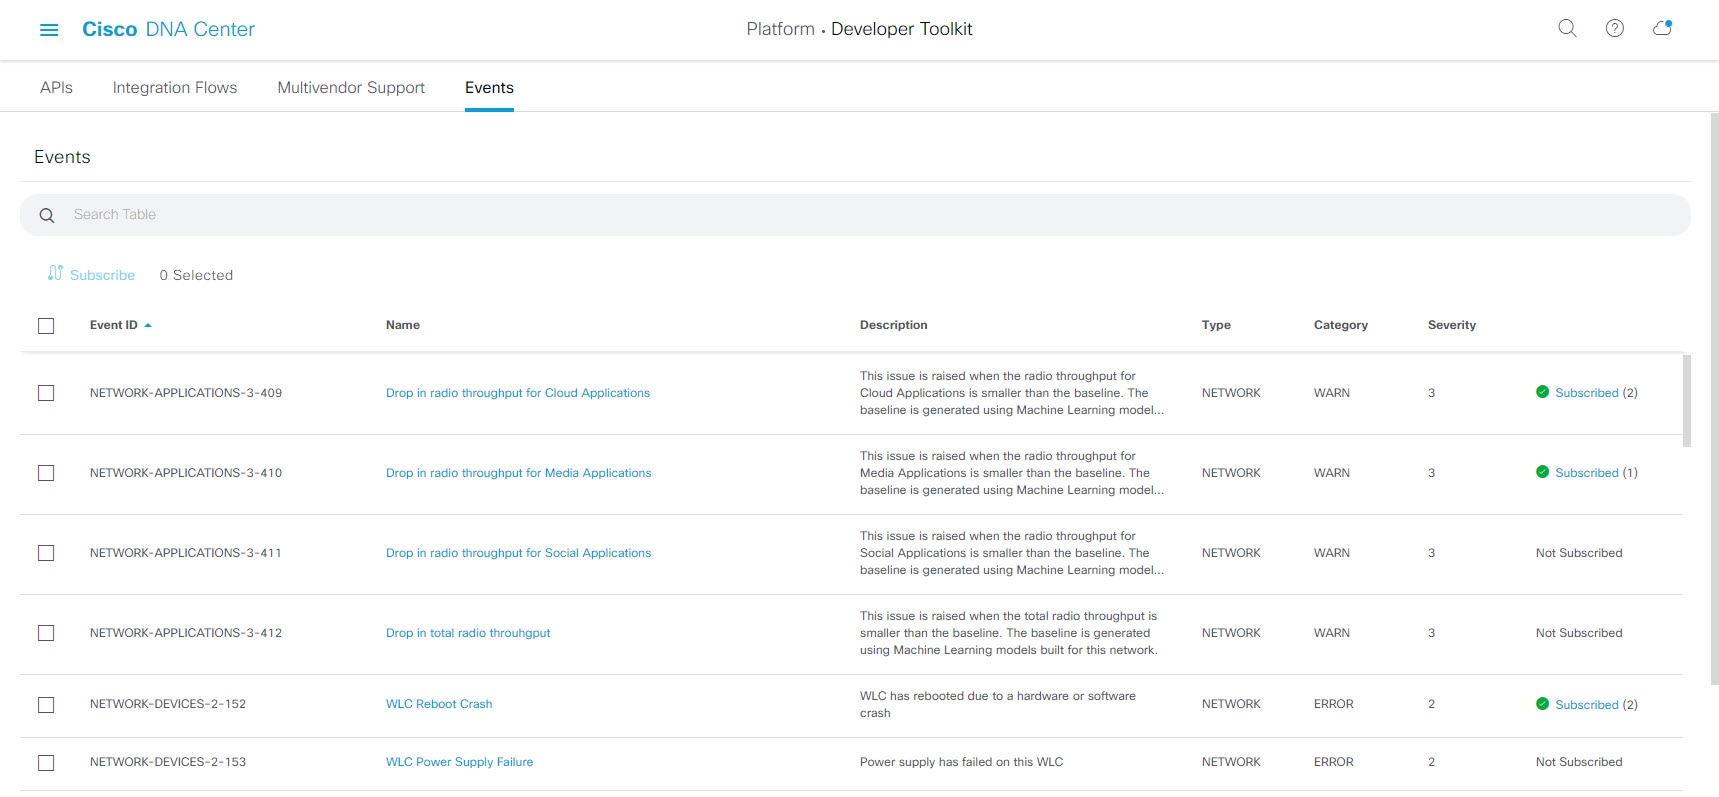
You can subscribe to specific events that may occur in your network. After your subscription, if the event does occur you
will receive a notification by email, webhook (REST API), SNMP trap, or syslog server. You subscribe to an event by using
the Events window in the Cisco DNA Center platform GUI.
Note
Email notifications are near real-time and are neither batched nor scheduled, they use predefined email templates that cannot
be customized. Additionally, the underlying event priority does not affect when the notification is sent out. For example,
an event with a severity of 1 is not sent out sooner than an event with a severity of 3. To prevent multiple issues being
triggered, a suppression time interval is supported. If the same issue (event) occurs within the suppression time interval,
a second notification will not be sent. If the same issue occurs outside of the suppression time interval, then another notification
is sent. The issue suppression time interval is also predefined and cannot be configured.
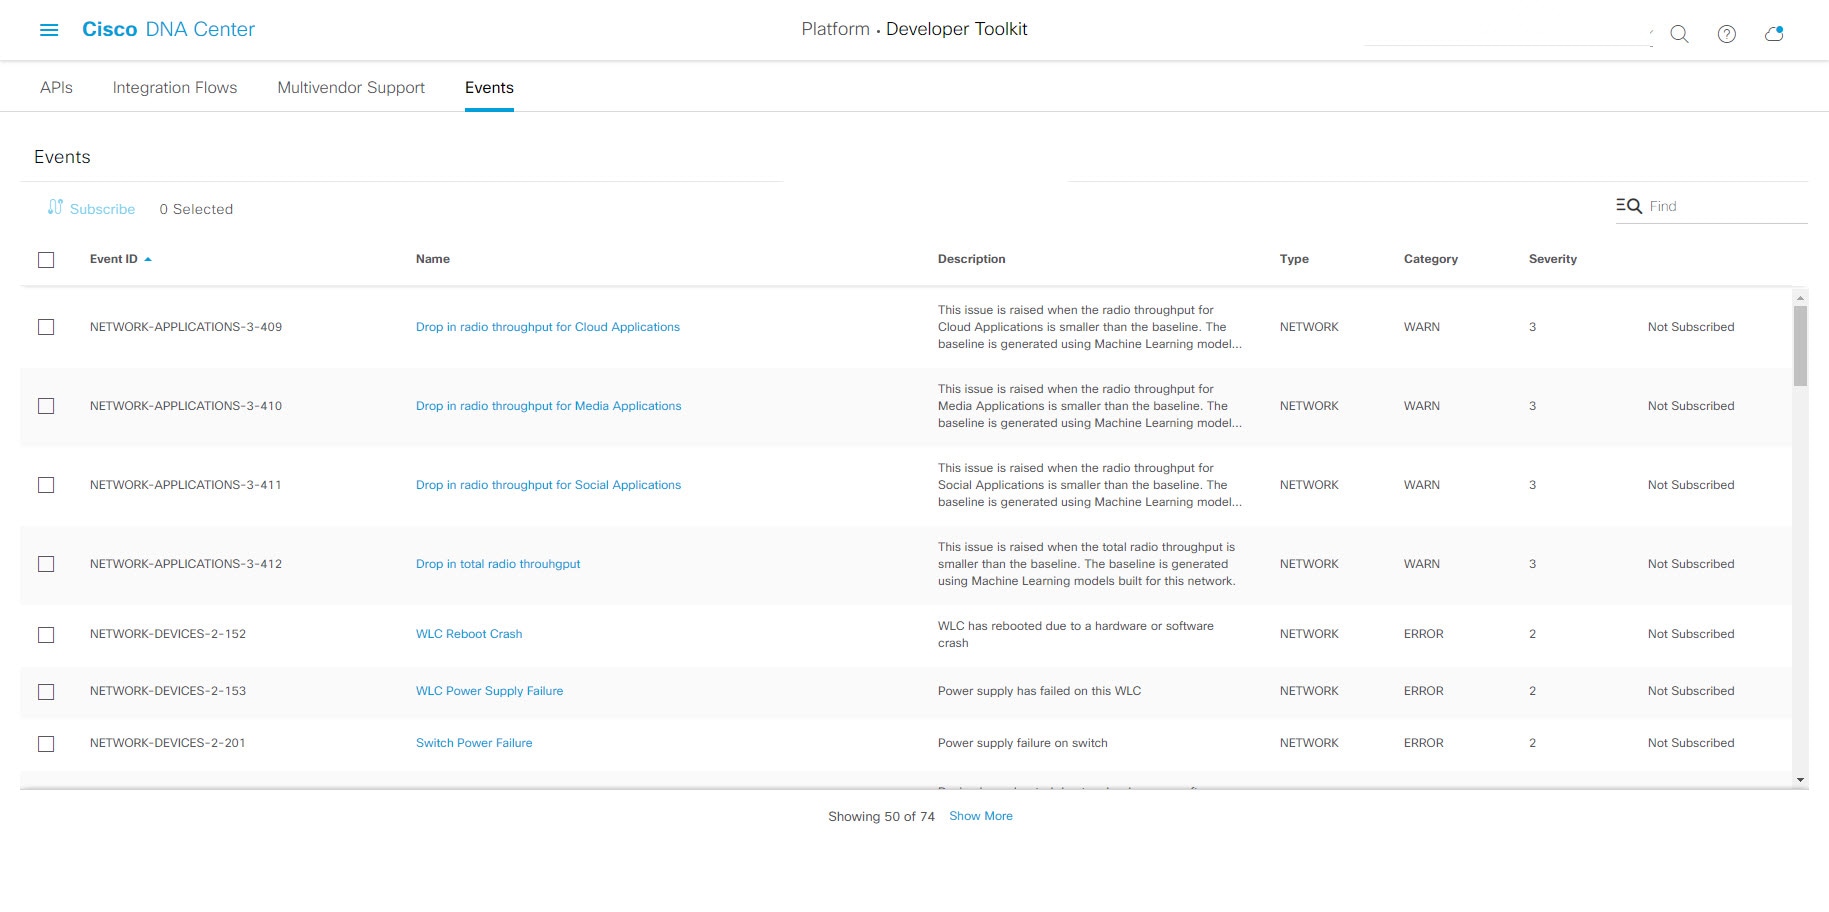
Figure 3. Cisco DNA Center Platform Events Window
Before you begin
For a REST API subscription, you configured the webhook destination in the Webhook tab in Cisco DNA Center. You access the Webhook tab by clicking the Menu icon and choosing System > Settings > External Services > Destinations > Webhook. For detailed information about configuring a webhook destination, see Configure a Webhook Destination
For email subscription of events, you configured the email destination in the Email tab in Cisco DNA Center. You access the Email tab by clicking the Menu icon and choosing System > Settings > External Services > Destinations > Email. For detailed information about configuring an email destination, see Configure an Email Destination.
For a syslog server subscription of events, you configured the syslog server destination in the Syslog tab in Cisco DNA Center. You access the Syslog tab by clicking the Menu icon and choosing System > Settings > External Services > Destinations > Syslog. For detailed information about configuring a syslog server destination, see Configure a Syslog Server Destination.
For a SNMP trap subscription of events, you configured the SNMP trap destination in the Trap tab in Cisco DNA Center. You access the Trap tab by clicking the Menu icon and choosing System > Settings > External Services > Destinations > Trap. For detailed information about configuring a trap destination, see Configure a Trap Notification.
You have accessed the Event Settings window and reviewed/edited the list of events that may occur within your network for ITSM integration and can be captured
by Cisco DNA Center. You access the Event Settings window by clicking the Menu icon and choosing Platform > Manage > Configurations > Event Settings.
You must have the appropriate permissions to perform the tasks as described in this procedure. For information about Role-Based
Access Control for the Cisco DNA Center platform, see Role-Based Access Control Support for Platform.
Procedure
Step 1
In the Cisco DNA Center GUI, click the Menu icon () and choose Platform > Developer
Toolkit > Events.
The Events window appears.
Step 2
In the Events window, review the events table displayed by the GUI.
Note
You can adjust the events that are displayed in the GUI by entering a keyword in the Find field.
Step 3
Review the data on an individual event within the table.
The following Events data is provided:
Event ID: Identification number for the event.
Name: Name of the event (link).
If you click this link, the Nameslide-in pane opens for the event. The Nameslide-in pane consists of two tabs: Events Details and Active Subscriptions.
Description: Brief description of the event.
Type: Network, App, System, Security, or Integrations type of event.
Severity 1 is the most important or critical priority and should be assigned for this type of an event.
Status: Subscription status (whether a user
has subscribed to the event). If subscribed to an event, then a link
appears in this column to the Active
Subscription tab.
Step 4
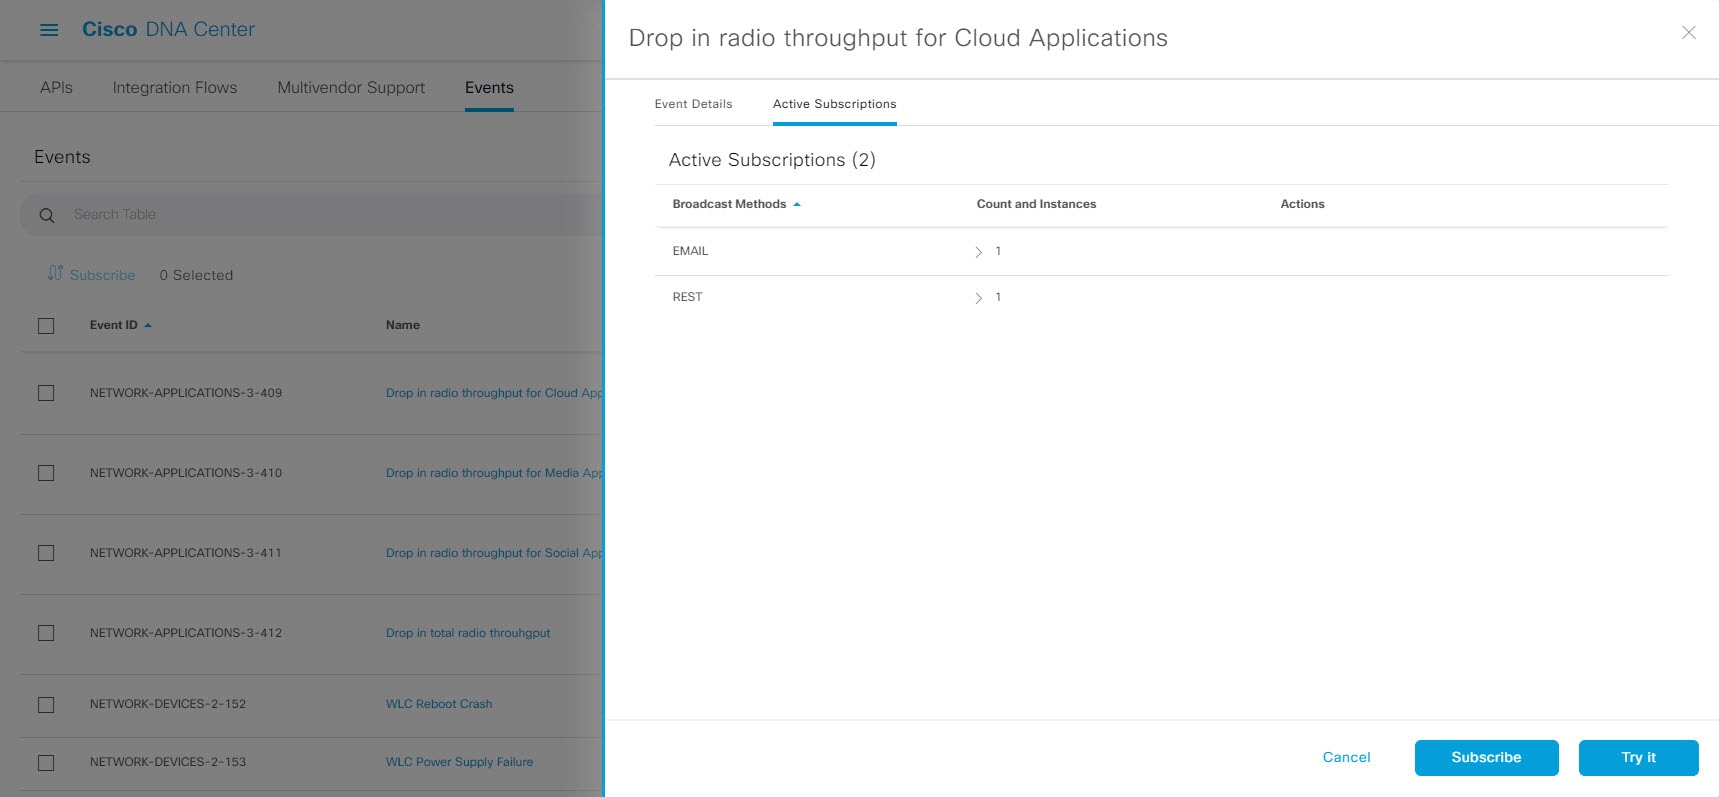
Click a Name link to open an event subscription slide-in pane.
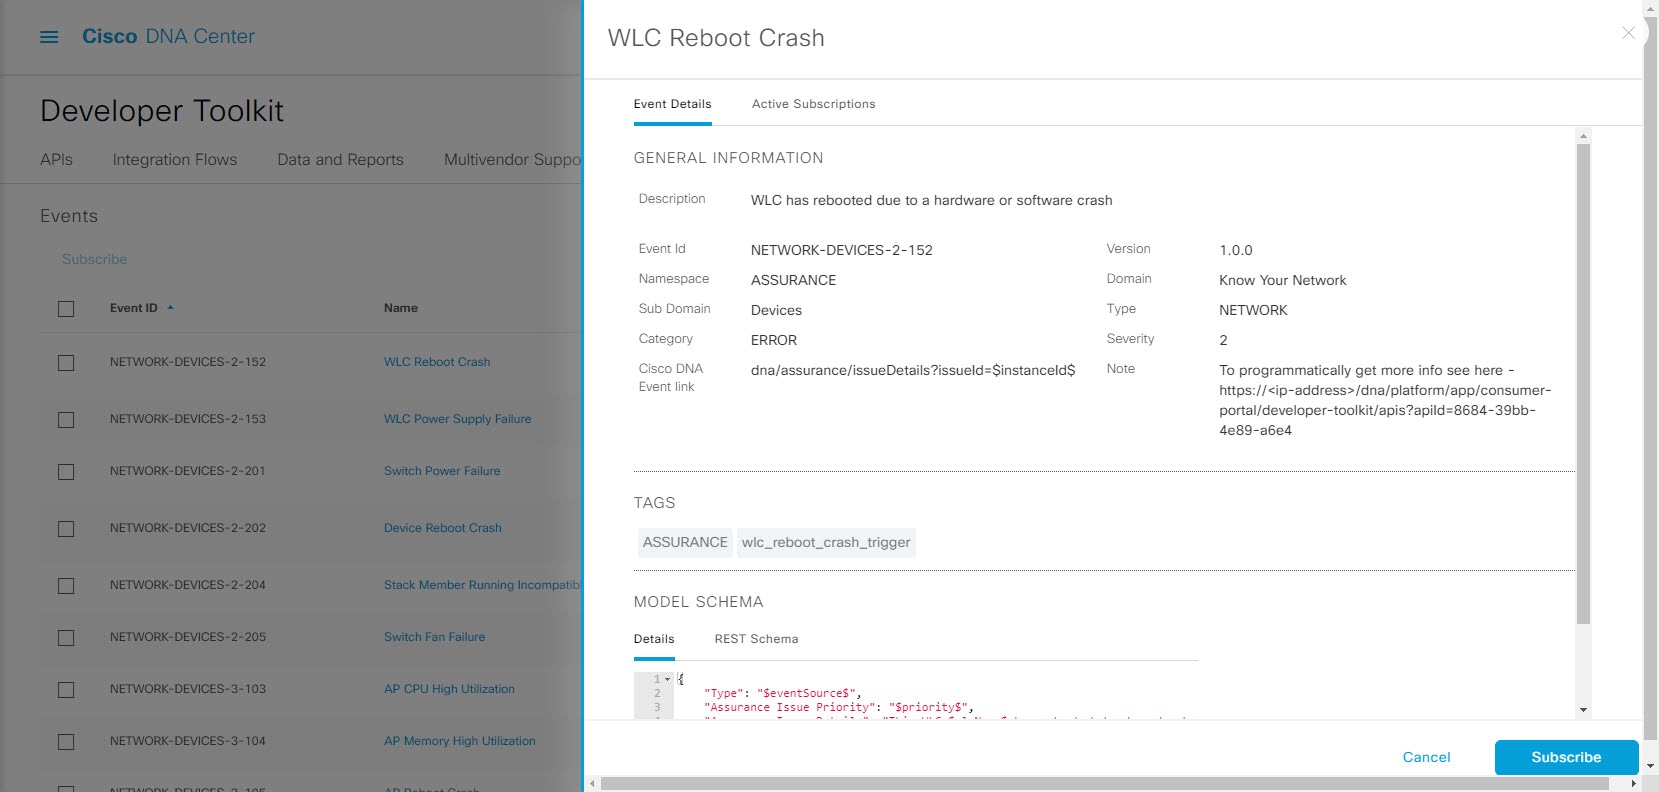
Figure 4. Individual Event Window
Step 5
Review the data displayed in the event subscription slide-in pane.
The following Event Details tab data is displayed:
Description: Brief description of the event and how it is triggered.
Event ID: Identification number of the event.
Version: Version number of the event.
Namespace: Namespace of the event.
The default value for this release for all of the events is ASSURANCE.
Domain: REST API domain to which the event belongs.
Sub Domain: Subgroup under the REST API domain to which the event belongs.
Type: Network, App, System, Security, or Integrations type of event.
Severity 1 is the most important or critical priority and should be assigned for this type of an event.
Cisco DNA Event Link: Event broadcast using REST URL.
Note: Additional information about the event or to assist in further understanding the event.
Tenant Aware: Whether the event is tenant aware or not.
Tags: Tags indicate what Cisco DNA Center component is affected by the event. The default value for tags for this release is ASSURANCE with additional syntax for the
specific Assurance issue.
Supported Endpoints: What endpoint types are supported for the event notifications. The following endpoints are supported with this release:
REST API
Syslog server
Email
SNMP trap
PagerDuty
Model Schema: Presents model schema about the event:
Details: Example of model schema detail for the event.
REST Schema: REST schema format for the event.
Step 6
Click the Active Subscriptions tab.
The following Active Subscriptions tab data is displayed:
Count and Instances: Number of instances of notifications for emails, REST APIs, syslog server, SNMP traps, or PagerDuty.
Note
After subscribing to an event, click the subscription count (>) under Count and Instances to edit or unsubscribe to the active subscription. After clicking the individual subscription count (>), click Unsubscribe to unsubscribe or Edit to further edit it. For multiple subscriptions, you will need to unsubscribe to each subscription one at time. The ability
for multiple subscribing or unsubscribing is not supported using the GUI.
Actions: Either unsubscribe or edit the active subscription.
Note
After subscribing to an event, a Try It
button will appear in the Active
Subscriptions tab. By clicking on this button,
you are able to run an event simulation. For information about
this feature Work with Event Simulations.
Step 7
(Optional) Click the Subscribe button to add this event to your active subscription of events and to receive future notifications. For a Syslog notification, configure the following fields:
Name: Name of the event.
Subscription Type: SYSLOG
Click the link to access the Syslog GUI window and configure a new endpoint (syslog server hostname and port number).
Note
Subscription type can be set for either email, REST API endpoint, syslog server, SNMP trap, or PagerDuty. If you select SYSLOG, but have not yet configured the syslog server settings, you are prompted to access the GUI window where you can perform
this task. Syslog server settings are configured in the Syslog tab. You can also access this tab, by clicking System > Settings > External Services > Destinations > Syslog tab.
Click Subscribe to save and enable the subscription or Cancel to cancel and exit the window.
Step 8
(Optional) Click the Subscribe button to add this event to your active subscription of events and to receive future notifications. For a REST API endpoint notification (for example for a webhook), configure the following fields:
Name: Name of the event.
Subscription Type: REST
Click the link to access the Webhook GUI window and configure a new webhook endpoint.
Note
Subscription type can be set for either email, REST API endpoint (webhook), syslog server, SNMP trap, or PagerDuty. If you
select REST, but have not yet configured the webhook settings, you are prompted to access the GUI window where you can perform this task.
Webhook settings are configured in the Webhook tab. You can also access this tab, by clicking System > Settings > External Services > Destinations > Webhook tab.
Select an existing endpoint: Select the Subscription Endpoint and URL by using the drop-down arrow.
Create a new endpoint: Click the link to access the Webhook GUI window and configure a new endpoint (Add Webhook).
Note
When using this procedure, there is a one to one correspondence of a webhook endpoint to an event, but several different events
can be configured to a single webhook endpoint by following this procedure multiple times.
Review the remainder of the REST configuration:
URL: URL address of the REST API endpoint that event will be sent to.
Trust certificate: Whether a trust certificate is required for REST API endpoint notification.
HTTP Method: Either the PUT or POST method.
Authentication: One of the following Authentication types:
Basic: Authentication where the client sends HTTP requests with the Authorization header that contains the word 'Basic', followed
by a space and a base64-encoded string 'username:password'. If you select Basic in the GUI, the Headers field below enters the value Authorization.
Token: Authentication where users are authenticated using a security token provided by the server. If you select Token, the Headers field below enters the value X-Auth-Token.
No Authentication: No authentication needed.
Headers: The Header Name and Header Value.
Note
The Headers fields may be auto-populated depending upon your Authentication selection above.
Click Subscribe to save and enable the subscription or Cancel to cancel and exit the window.
Step 9
(Optional) Click the Subscribe button to add this event to your active subscription of events. For an email notification, configure the following fields:
Name: Name of the event.
Subscription Type: EMAIL
Note
Subscription type can be set for either email, REST API endpoint (webhook), syslog server, SNMP trap, or PagerDuty. If you
select EMAIL, but have not yet configured the email settings, you are prompted to access the GUI window where you can perform this task.
Email settings are configured in the Email tab. You can also access this tab, by clicking System > Settings > External Services > Destinations > Email tab.
Select an existing endpoint: Select the Subscription Endpoint by using the drop-down arrow.
Create a new endpoint: Enter a new Endpoint Name and Endpoint Description.
Note
You can only create a new endpoint using pre-existing email settings configured in the Email tab, as described above.
Review the remainder of the EMAIL configuration:
SMTP Configuration: Review the hostname/IP address, port number, username, and password for a primary and secondary SMTP server. The secondary
SMTP server is optional.
Email Recipients: Enter a From and To email address, and a Subject header for the email.
Note
Up to 20 email addresses can be configured per endpoint to receive an email. To enter an additional email address, after typing
the first email address press <Enter> on your keyboard and type in the additional mail address. After pressing <Enter>. all
the required validations for the email address are performed and you will be notified if there is anything wrong with the
email address syntax.
If more than 20 email addresses need to be configured for an endpoint, then an email alias can be used.
Click Subscribe to save and enable the subscription or Cancel to cancel and exit the window.
Step 10
(Optional) Click the Subscribe button to add this event to your active subscription of events. For an SNMP trap notification, configure the following fields:
Name: Name of the event.
Subscription Type: SNMP
Subscription type can be set for either email, REST API endpoint, SNMP trap, or PagerDuty.
The SNMP trap notification is only available for a system hardware event. A system hardware event publishes notifications
to any subscriber, when the health state of hardware components change. Hardware components monitored for changes include:
CPU, Memory, Disk, NIC, fan, power supply, and RAID Controller.
Select an existing endpoint: Select the Subscription Endpoint by using the drop-down arrow.
Create a new endpoint: Click the link (here) to access the Trap GUI window and configure a new endpoint (Add).
Hostname/IP Address: Enter the hostname/IP address for the SNMP trap receiver (server).
Port: Enter the port number for the SNMP trap receiver (server).
SNMP Version: Enter the SNMP version from the drop down menu for the community configuration.
SNMP V2C: For SNMP Version 2C, enter the community string.
SNMP V3: For SNMP Version 3, enter the following additional information:
Username
Mode: Authentication and Privacy, Authentication, No Privacy, or No Authentication, No Privacy
For No Authentication, No Privacy selection, no further configuration is required.
For Authentication, No Privacy, configure the Authentication Type (SHA or MD5 ), Authentication Password, Confirm Authentication Password.
For Authentication and Privacy, configure the Authentication Type (SHA or MD5 ), Authentication Password, Confirm Authentication Password, Additionally,
configure the Privacy Type (AES128, DES), Privacy Password, and Confirm Privacy Password.
Click Subscribe to save and enable the subscription or Cancel to cancel and exit the window.
Step 11
(Optional) Click the Subscribe button to add this event to your active subscription of events. For a PagerDuty notification, configure the following fields:
Name: Name of the event.
Subscription Type: PAGER_DUTY
Note
Subscription type can be set for either email, REST API endpoint (webhook), syslog server, SNMP trap, or PagerDuty.
Select an existing endpoint: Select the Subscription Endpoint by using the drop-down arrow.
Create a new endpoint: Enter a new Endpoint Name and Endpoint Description.
Enter values for the following fields:
PagerDuty Events API URL
PagerDuty Integration Key
PagerDuty Events API Version
Click Subscribe to save and enable the subscription or Cancel to cancel and exit the window.
Step 12
Review your subscriptions in the Active Subscriptions
tab.
The following information is provided for a subscription:
Counts and Instances: Number of instances of
notification.
Click the Unsubscribe and
Edit links to unsubscribe or edit the
subscription respectively.
Actions: Actions taken for the events.
Note
You can adjust the subscriptions that are displayed in the GUI by
clicking the Filter icon and using the filter, or
entering a keyword in the Find field.
What to do next
Proceed to run a test simulation of the configured event subscription as described in
the following procedure.
Work with Event Simulations
Cisco DNA Center platform supports a new event simulation feature. With an event simulation, you can try out and test an event's
subscription (email, REST API, SNMP trap notification, or syslog server). After running an event simulation, the results (success
or failure) are displayed in the GUI.
You create and test event simulations using the Events window
in the Cisco DNA Center platform GUI.
Figure 5. Cisco DNA Center Platform Events Window
Before you begin
For a syslog server subscription of events, you configured the syslog server destination in the Syslog tab in Cisco DNA Center. You access the Syslog tab by clicking the Menu icon and choosing System > Settings > External Services > Destinations > Syslog. For detailed information about configuring a syslog server destination, see Configure a Syslog Server Destination.
For an email subscription, you configured the email destination in the
Email tab in Cisco DNA Center. You access the Email tab by clicking the
Menu icon > System >
Settings > External
Services > Destinations >
Email. For detailed information about configuring
an email destination, see Configure an Email Destination.
For a REST API subscription, you configured the webhook destination in the
Webhook tab in Cisco DNA Center. You access the Webhook tab by clicking the
Menu icon > System >
Settings > External
Services > Destinations >
Webhook. For detailed information about
configuring a webhook destination, see Configure a Webhook Destination.
You have accessed the Event Settings window and
reviewed/edited the list of events that may occur within your network for
ITSM integration and can be captured by Cisco DNA Center. You access the Event Settings window by clicking
the Menu icon () > Platform >
Manage > Configurations
> Event Settings.
You must have the appropriate permissions to perform the tasks as described
in this procedure. For information about Role-Based Access Control for the
Cisco DNA Center platform, see Role-Based Access Control Support for Platform.
Procedure
Step 1
In the Cisco DNA Center GUI, click the Menu icon () and choose Platform > Developer Toolkit
> Events.
The Events window appears.
Step 2
In the Events window, review the events table displayed
by the GUI.
Note
You can adjust the events that are displayed in the GUI by entering a
keyword in the Find field.
Step 3
Click a Subscribed link to open the slide-in pane for an event with a subscription.
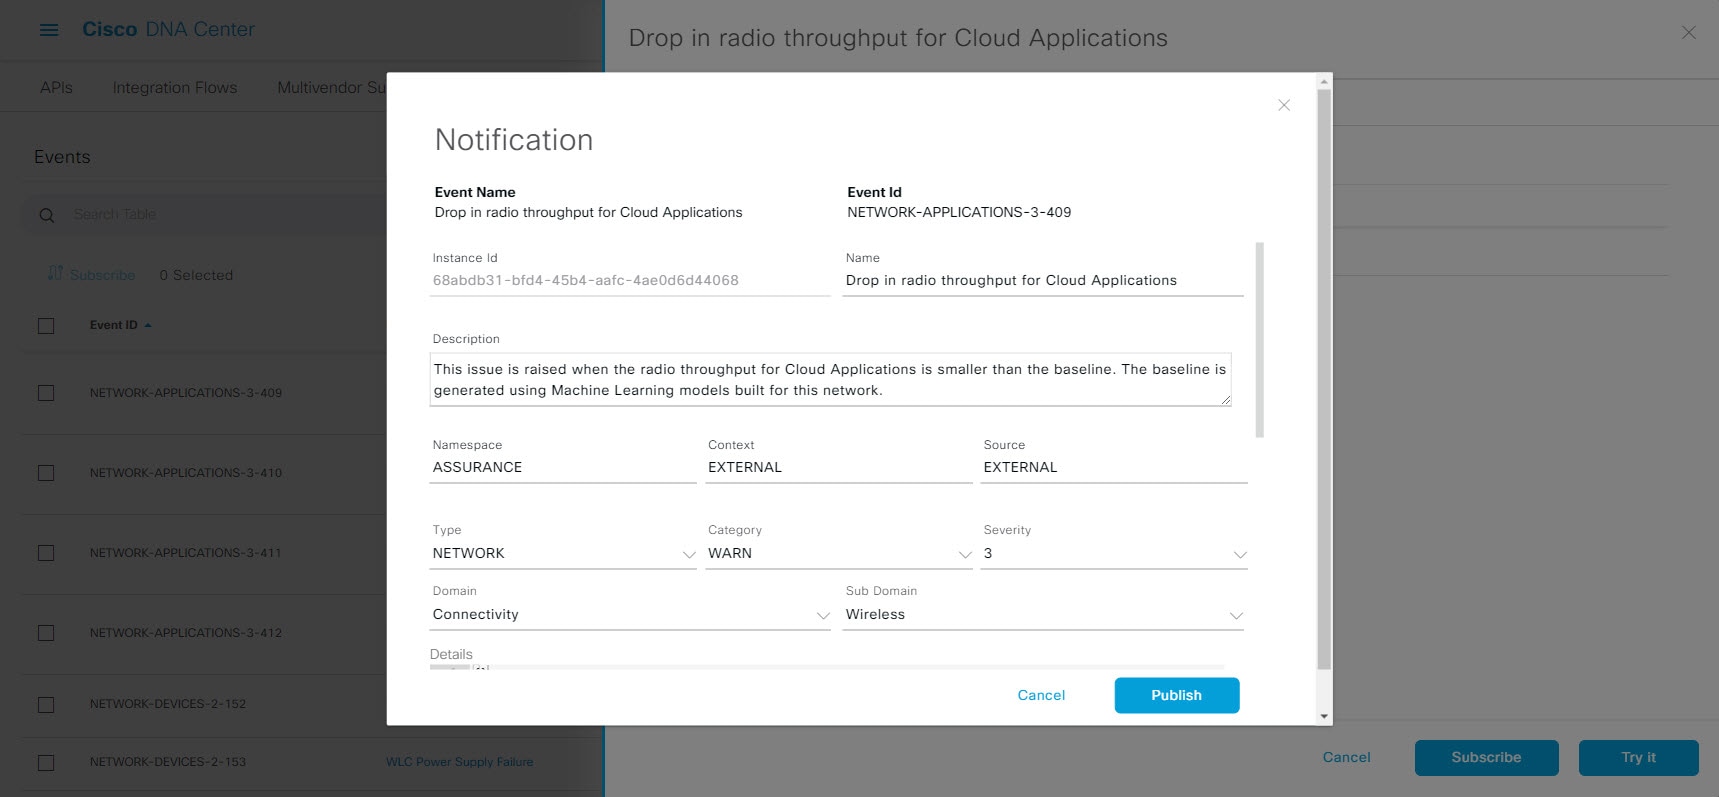
Figure 6. Individual Event Window
Step 4
In the Active Subscription tab, click Try
It.
Figure 7. Notification Field
The Notification field for the event appears. Review
and edit (if necessary) the event's configuration.
The following Notification data is displayed:
Event Name: Cisco DNA Center system name for
the event. This text cannot be edited by the user.
Event ID: Identification number of the event.
This text cannot be edited by the user.
Instance ID: Identification number of the
event's instance. This text cannot be edited by the user.
Name: Name (editable) for the event. Use this
field to edit the name for your specific requirements or
network.
Description: Brief description of the event
and how it is triggered. The text in this field can be edited by the
user. Use this field to add more text about the event for your
specific requirements or network.
Namespace: Namespace of the event.
The default value for this release for all of the events is
ASSURANCE. The text in this field can be edited by the user.
Context: User editable event context field.
Default value is EXTERNAL.
Source: User editable source field.
Default value is EXTERNAL.
Type: Network, App, System, Security, or
Integrations type of event. The event type can be changed with the
drop down menu.
Category: Error, Warn, Info, Alert, Task
Progress, Task Complete. The event category can be changed with the
drop down menu.
Severity: 1 through 5. The event severity can
be changed with the drop down menu.
Note
Severity 1 is the most important or critical priority and should
be assigned for this type of an event.
Domain: REST API domain to which the event
belongs. The event domain can be changed with the drop down
menu.
Sub Domain: Subgroup under the REST API domain
to which the event belongs. This event sub domain can by changed
with the drop down menu.
Details: Field for additional user detail
about the event.
Step 5
Review and edit (if necessary) the event's current configuration.
Step 6
Click Publish to run the event simulation and review
results.
The following results are displayed:
Subscription Name: User created subscription
name.
Connector Type: Email, REST API, SNMP trap, or Syslog.
Status: Loading, Success, or Fail.
Message: For a REST connector type (REST API
subscription), an HTTPS response appears.
Step 7
Click X to exist from the field.
What to do next
Proceed to either create other event test simulations, configure and subscribe to an
actual event, or exit.

 Feedback