Monitor and Troubleshoot SD-Access Health

SD-Access fabric

Fabric technology is an integral part of SD-Access. A fabric network is a logical group of devices that is managed as a single entity in one or multiple locations. Having a fabric network in place enables several capabilities, such as the creation of virtual networks and user and device groups, and advanced reporting. Other capabilities include intelligent services for application recognition, traffic analytics, traffic prioritization, and steering for optimum performance and operational effectiveness.

Catalyst Center allows you to add devices to a fabric network. These devices can be configured to act as control plane, border, or edge devices within the fabric network.

Add a fabric site

Before you begin

You can create a fabric site only if IP Device Tracking (IPDT) is already configured for the site.

Procedure


Step 1

From the main menu, choose Provision > Fabric Sites.

Step 2

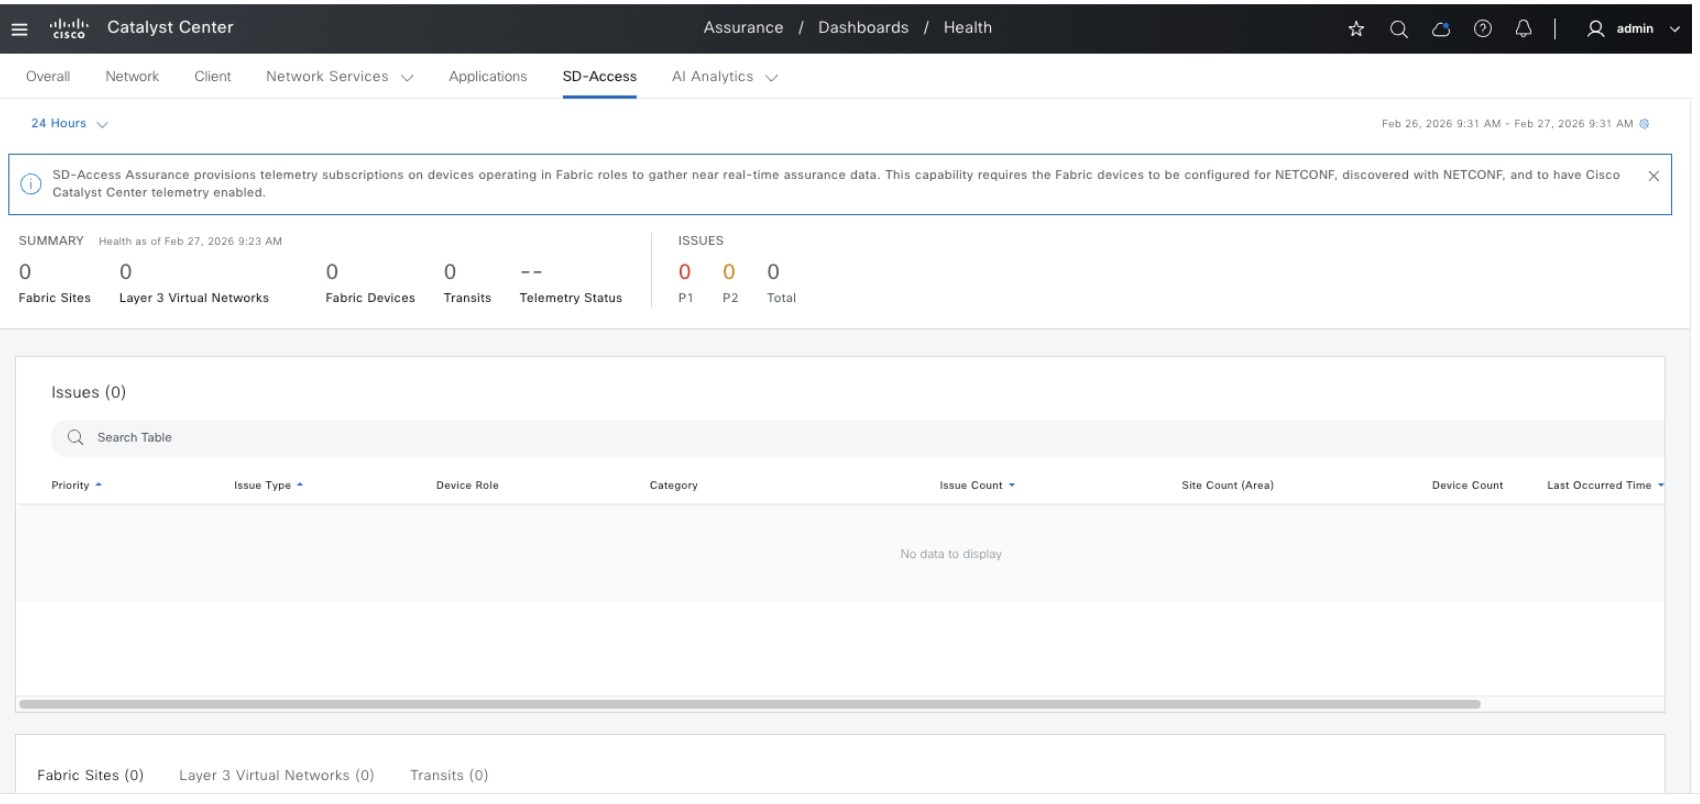
Under SUMMARY, click the number that indicates the count of the fabric sites.

The resulting window displays every fabric site that has already been created and its information (such as Health Score, Fabric Zones, Fabric Devices, Fabric Roles, and Connected Transits) in a tabular format.

You can customize the table view to display only selected columns. Use the gear icon at the top right corner of the window to edit the Table Settings and Apply the changes.

Step 3

Click Create Fabric Sites.

Alternatively, instead of the first three steps, click the menu icon and choose Workflow > Create Fabric Sites and Fabric Zones.

Step 4

In the Create Fabric Sites window, click Let’s Do it to go directly to the workflow.

Step 5

In the Fabric Site Location window, select an area, building, or floor to add as a fabric site.

Step 6

In the Wired Endpoint Data Collection window, ensure that the Wired Endpoint Data Collection check box is checked.

Step 7

In the Authentication Template window, do these steps:

  1. Select an authentication template for the fabric site:

    Template option

    Description

    Closed Authentication

    Any traffic before authentication is dropped, including DHCP, DNS, and ARP.

    Open Authentication

    A host is allowed network access without having to go through 802.1X authentication.

    Low Impact

    Security is added by applying an ACL to the switch port, to allow very limited network access before authentication. After a host has been successfully authenticated, additional network access is granted.

    None

    None

  2. (Optional) If you select Closed Authentication, Open Authentication, or Low Impact, click Edit to edit the authentication settings:

    Setting

    Task

    First Authentication Method

    Select 802.1x or MAC Authentication Bypass (MAB)

    802.1x Timeout (in seconds)

    Use the slider to specify the 802.1x timeout, in seconds.

    Wake on LAN

    Select Yes or No.

    Number of Hosts

    Select Unlimited or Single.

    BPDU Guard

    Use this check box to enable or disable the Bridge Protocol Data Unit (BPDU) guard on all the Closed Authentication ports.

    Pre-Authentication Access Control List​

    1. Enable the toggle button to configure preauthentication control for Low Impact authentication.

    2. From the Implicit Action drop-down list, choose an implicit action and enter a description for the rule.

    3. To add an access contract, click Add Contract Action, choose the rules, and click Apply Table.

Step 8

(Optional) In the Fabric Zones window, choose one of these options:

Option

Task

To designate fabric zones later

Click Setup Fabric Zones Later.

To designate fabric zones and create scoped subnets

Click Setup Fabric Zones Now and select a fabric site from the displayed network hierarchy.

Step 9

In the Summary window, review the fabric site settings.

You can edit any of the fabric site or zone settings here.

Step 10

Schedule the task for deployment.

Depending on Visibility and Control of Configurations settings, you can either:

Step 11

On the Tasks window, monitor the task deployment.

Step 12

It takes a few seconds for the site and zones to be provisioned. Upon successful creation of the site, a Fabric Site Creation Completed message displays.

Next, you are provided with options to either create a new fabric site or view the activities on the Tasks window.

After creating a fabric site, you can change the site hierarchy in these ways:

  • You can move a site under a new site within a fabric site.

  • You can move a fabric site under a new site that is not a fabric site.

  • You cannot move a site under a fabric to a new fabric site or a site outside of the fabric.


Add a device to a fabric

After you have created a fabric site, you can add devices to the fabric site. You can also specify whether the device should act as a control plane node, an edge node, or a border node.

You can add a new device to the fabric site only if IP Device Tracking (IPDT) is configured for the fabric site.

A device that is assigned the Access role and has been provisioned before enabling IPDT on the site can’t be added to the fabric. Reprovision such devices before adding them to the fabric site. Check the Provision workflow to confirm the status of Deployment of IPDT on the device.


Note


  • It’s optional to designate the devices in a fabric site as control plane nodes or border nodes. You might have devices that don’t occupy these roles. However, every fabric site must have at least one control plane node device and one border node device. In the current release for wired fabric, you can add up to six control plane nodes for redundancy.

  • Currently, the Cisco Wireless Controller communicates only with two control plane nodes.

  • You cannot change a device's role after it is added to the fabric. To change the role, remove the device from the fabric and re-add it.


Before you begin

Provision the device if you haven’t already provisioned it:

  • The Provision > Network Devices > Inventory window displays the discovered devices.

  • The topology view shows a device in gray if it has passed the fabric readiness checks and is ready to be provisioned.

  • If an error is detected during any of the fabric readiness checks, an error notification is displayed on the topology area. Click See more details to check the problem area listed in the resulting window. Correct the problem and click Re-check to ensure that the problem is resolved.

  • If you update the device configuration as a part of problem resolution, ensure that you resynchronize the device information by doing an Inventory > Resync for the device.


Note


You can continue to provision a device that has failed the fabric readiness checks.


Procedure


Step 1

From the main menu, choose Provision > Fabric Sites.

Step 2

Under SUMMARY, click the number that indicates the count of fabric sites.

Step 3

Select the fabric site to add a device.

The resulting topology view displays all devices in the network that have been inventoried. In the topology view, any device that is added to the fabric is shown in blue.

Step 4

From the List view under the Fabric Infrastructure tab, click a device. A slide-in pane displays these Fabric options:

Option Description

Edge Node

Toggle the button next to this option to enable the selected device as an edge node.

Border Node

Toggle the button next to this option to enable the selected device as a border node.

Control Plane Node

Toggle the button next to this option to enable the selected device as a control plane node.

To configure a device as a fabric-in-a-box, select the Control Plane Node, Border Node, and Edge Node options.

To configure the device as a control plane and a border node, select both Control Plane Node and Border Node.

Step 5

(Optional) To enable the wireless capability for the device, under Capability, click the Embedded Wireless LAN Controller toggle button and do these steps:

Alternatively, if the toggle button is already enabled, you can click Configure to configure the wireless settings.
  1. If you have not installed the wireless package on the device yet, Catalyst Center displays a warning message indicating that the embedded wireless controller software image is necessary for enabling the capability. In the warning dialog box, click OK to install the image manually.

  2. Under Download Image, click Choose File to navigate to a software image stored locally, or Enter image URL to specify an HTTP or FTP source from which to import the software image.

  3. Click Import.

    The progress of the image import is displayed. To exit the window, and view the progress of the import and schedule the installation later, click Close.

  4. After the image import is complete, under Schedule Image Installation on Download Image, choose one of these options:

    • Now: Immediately install the image.

    • Later: Schedule the image installation for a later date or time.

  5. In the Task Name field, update the task name, if required.

  6. If you chose Later, do these tasks:

    • Under Start Date/Time, specify a start date and time for the image installation.

    • To use the default site time zone for the image installation, check the Site Settings check box. To select a time zone, uncheck the Site Settings check box and choose a time zone from the drop-down list.

  7. Click Apply.

    To view the status of image installation, go to the Activities > Tasks window and open the relevant work item. After the software image is distributed and activated on the switch, you must resynchronize the device using the Provision > Inventory > Resync option.

  8. Under Manage Scope, do these tasks:

    • Under the Primary tab, check the check box next to the required site name.

    • Under the Secondary tab, check the check box next to the required site name.

    You can select either a parent site or individual sites. If you select a parent site, all the children under the parent site are also selected. You can uncheck the check box to deselect an individual site.

    You can also use the Search Hierarchy search field or the filter icon to find a site.

  9. Click Next.

  10. Under Advanced, to enable the Rolling AP Upgrade feature, check the Enable check box.

    (Optional) If you check this check box, from the AP Reboot Percentage drop-down list, choose a percentage.

  11. Click Next.

  12. Under Summary, review the configuration settings.

  13. Click Save.

If the wireless capability is enabled for a device and there are changes in the wireless network settings, to push the changes to the device, you must click Configure and save the configuration.

Step 6

Click Add to save the configurations.

Step 7

Click Deploy under the Fabric Infrastructure tab to configure the device.

Step 8

Schedule the task for deployment.

Depending on Visibility and Control of Configurations settings, you can either:

Note


A device is added to the fabric only if the device runs a software release that is compatible with the Catalyst Center release. For information about fabric device compatibility, see Cisco SD-Access Compatibility Matrix.

For a given fabric role, if the software image on the device isn’t compatible with the Catalyst Center release, the device isn’t added to the fabric and an error message is displayed.

Step 9

On the Tasks window, monitor the task deployment.


What to do next

After a device is added to the fabric, fabric compliance checks are automatically performed to ensure that the device is fabric-compliant. The topology displays a device that has failed the fabric compliance check in blue color with a cross-mark beside it. Click See more details on the error notification to identify the problem area and correct it.

Monitor and troubleshoot the health of your SD-Access fabric

Use this procedure to get a global view of your SD-Access fabric and to determine if there are potential issues that must be addressed.

A fabric network is a logical group of devices that is managed as a single entity in one or multiple locations. Catalyst Center allows you to add devices to a fabric network. These devices can be configured to act as control plane, border, or edge devices within the fabric network.

Before you begin

To monitor and troubleshoot fabric sites, you must first configure the fabric site. See Add a fabric site and Add a device to a fabric.

Assurance supports site-based, role-based access control (SRBAC), which limits a user's scope of access to certain client 360. The Assurance SD-Access fabric features depends on the user role and site defined in the access group. For more information on user roles and permissions, see Cisco Catalyst Center Administrator Guide.

For additional details and to understand multisite fabric sites, see the "Provision Your Network" chapter in the Cisco Catalyst Center User Guide.


Note


Subtended and extended nodes are not part of fabric health because during fabric provisioning, these nodes are not given a fabric role, such as edge, border, or control plane.

Procedure


Step 1

From the main menu, choose Assurance > Health.

The Overall health dashboard appears.

Step 2

Click the SD-Access tab.

The SD-Access health dashboard appears.

Figure 1. Network Health Dashboard

Step 3

Click the time range setting () in the top-menu bar to specify the time range of data that appears on the dashboard.

  1. From the drop-down menu, select the time range: 3 Hours, 24 Hours, or 7 Days.

  2. Specify the Start Date and time; and the End Date and time.

  3. Click Apply.

Step 4

Use the SD-Access Health Summary dashlet for this functionality:

Item Description

Summary

  • Fabric Sites: Number of fabric sites.

  • Layer 3 Virtual Networks: Number of layer 3 virtual networks.

  • Layer 2 Virtual Networks

  • Fabric Devices: Number of fabric devices.

  • Endpoints: Number of endpoints.

  • Transits and Peer Networks: Number of transits and peer networks.

  • Telemetry Status: Displays the telemetry status of the fabric sites.

Issues

  • P1: Number of priority 1 issues.

  • P2: Number of priority 2 issues.

  • Total: Total number of P1, P2, and P3 issues.

Step 5

Use the SD-Access Top 10 Issue Types dashlet for this functionality:

Top 10 Issue Type Dashlet

Displays the top 10 issues, if any, that must be addressed. The issues are color coded and sorted by their preassigned priority level, starting with P1.

Click an issue to open a slide-in pane with additional details about the issue type. From the slide-in pane, click an issue instance where, as required, you can do these tasks:

  • To resolve the issue instance, from the Status drop-down list, select Resolve.

  • To ignore the issue instance:

    1. From the Status drop-down list, select Ignore.

    2. Set the number of hours to ignore the issue on the slider.

    3. Click Confirm.

Click View All Open Issues to open the Open Issues window.

Step 6

Use the Fabric Sites dashlet to view detailed information about the fabric sites in your network. This dashlet provides the functionality listed in this table:

Fabric Sites Dashlet
Item Description

Health

Filter the table based on the client health with these options:

  • All

  • Inactive: Fabric sites with a health score of 0.

  • Poor: Fabric sites with a health score range from 1 to 3.

  • Fair: Fabric sites with a health score range from 4 to 7.

  • Good: Fabric sites with a health score range from 8 to 10.

  • No Data: Fabric sites with no data.

Fabric Site table

View detailed fabric site information in a table format. The fabric site table displays this information by default:

  • Fabric Site: Name of the fabric site.

    You can click the name to display a 360° view of a fabric site. See Monitor the health of a fabric site.

  • # of Fabric Devices: Number of fabric devices in the fabric site.

  • Fabric Site Health:

    • Overall: Overall health of the fabric site.

    • Fabric Site Connectivity: Health of the connectivity with the fabric site.

    • Fabric Control Plane: Health of the control plane in the fabric site.

    • Fabric Infrastructure: Health of the devices that make up the fabric site.

Export

Click Export to export the table data to a CSV file.

Note


The data from all available columns is included even if the column was not selected for the table. Filters applied to the client table are applied to the exported data.

Customize the table display:

  1. From the Table Appearance tab, set the table density and striping.

  2. From the Edit Table Columns tab, select the data you want displayed in the table.

  3. Click Apply.

Step 7

Use the Virtual Networks dashlet to view detailed information about the virtual networks in your fabric site. This dashlet provides this functionality:

Virtual Networks Dashlet
Item Description

Health

Filter the table based on the virtual network health with these options:

  • All

  • Inactive: Virtual networks with a health score of 0.

  • Poor: Virtual networks with a health score range from 1 to 3.

  • Fair: Virtual networks with a health score range from 4 to 7.

  • Good: Virtual networks with a health score range from 8 to 10.

  • No Data: Virtual networks with no data.

Virtual Networks table

View detailed virtual network information in a table format. The virtual network table displays this information by default:

  • VN Name: Name of the virtual network.

    You can click the name to display a 360° view of a virtual network. See Monitor the health of a virtual network.

  • # of Active Sites: Number of active sites in the virtual network.

  • # of Clients: Number of endpoints in the virtual network.

  • Virtual Network Health:

    • Overall: Overall health of the virtual network.

    • Fabric Control Plane: Health of the control plane in the virtual network.

    • VN Services: Health of the virtual network services.

Export

Click Export to export the table data to a CSV file.

Note


The data from all available columns is included even if the column was not selected for the table. Filters applied to the client table are applied to the exported data.

Customize the table display:

  1. From the Table Appearance tab, set the table density and striping.

  2. From the Edit Table Columns tab, select the data you want displayed in the table.

  3. Click Apply.

Step 8

Use the Transits and Peer Networks dashlet to view the detailed information about the transits and peer networks in your fabric site. This dashlet provides this functionality:

Item Description

Health

Filter the table based on the transit and peer network health with these options:

  • All

  • Inactive: Transits and peer networks with a health score of 0.

  • Poor: Transits and peer networks with a health score range from 1 to 3.

  • Fair: Transits and peer networks with a health score range from 4 to 7.

  • Good: Transits and peer networks with a health score range from 8 to 10.

  • No Data: Transits and peer networks with no data.

Transits and Peer Networks table

View detailed transits and peer network information in a table format. The transits and peer network table displays this information by default:

  • Transit/ Peer Network Name: Name of the virtual network.

    You can click the name to display a 360° view of a virtual network. See Monitor the health of a virtual network.

  • Type: Number of active sites in the virtual network.

  • # of Clients: Number of endpoints in the virtual network.

  • Associated Fabric Sites

  • Transit and Peer Networks Health:

    • Overall: Overall health of the transit and peer network.

    • Transit Control Plane: Health of the transit control plane.

Export

Click Export to export the table data to a CSV file.

Note


The data from all available columns is included even if the column was not selected for the table. Filters applied to the client table are applied to the exported data.

Customize the table display:

  1. From the Table Appearance tab, set the table density and striping.

  2. From the Edit Table Columns tab, select the data you want displayed in the table.

  3. Click Apply.


Monitor the health of a fabric site

Use this procedure to view details about a specific fabric site.

Procedure


Step 1

From the main menu, choose Assurance > Health.

The Overall health dashboard appears.

Step 2

Click the SD-Access tab.

The SD-Access health dashboard appears.

Step 3

In the Fabric Site table, click the name of a fabric site.

The Fabric Site window appears, which provides a 360° view of the fabric site.

Figure 2. Fabric Site 360

Step 4

Click the time range setting () at the top-left corner to specify the time range for the data that you want displayed in the window:

  1. From the drop-down list, select a time range: 3 hours 24 hours, or 7 days.

  2. Specify the Start Date and time; and the End Date and time.

  3. Click Apply.

Step 5

Use the health timeline slider to view the health score for a more granular time range and to view quality information.

Hover your cursor within the timeline to view this information:

Check the Telemetry Status check box below the timeline to view the horizontal bar in the timeline. Hover your cursor over the horizontal bar to view the Telemetry Status of fabric site such as Good, Fair, or Poor. Click the Telemetry Status in the tool tip to open a slide-in pane to view the telemetry status summary of the fabric sites.

Fabric Site Health: Health is the percentage of healthy fabric nodes in this site. Device health of control planes is not included. Fabric Sub Category Health is the minimum of underlying KPI scores.

Note

 
The KPI is not included for health score.

Fabric Site Connectivity: Lists the KPI subcategories that contribute to the site reachability status, such as control plane reachability, extended node connectivity, and so on.

Fabric Control Plane

Fabric Infrastructure

Click and drag the timeline boundary lines to specify the time range. This boundary sets the context for the fabric site data that is displayed in the Fabric Site 360 window.

Click the Latest and Trend tabs to change the scope of data displayed in the category:

  • Latest: Displays the data from the selected time window in the timeline on the top of the window.

  • Trend: Displays data from the last 24 hours.

Step 6

Use the Fabric Site Health area, below the timeline, to view this information:

Fabric site health
Item Description

Latest

Displayed by default. Includes two panes. The left pane provides the network health summary score and the total number of devices. The right pane displays charts.

  • Health Fabric Nodes: The percentage of healthy (good) nodes in your selected site.

  • Total Devices: Total number of network devices and the count of devices with Good Health, Fair Health, Poor Health, and No Health Data.

  • Charts: This color-coded, snapshot-view chart shows the fabric site connectivity and infrastructure over the last 5 minutes.

    Hover your cursor over a color to display the health score and the number of devices that are associated with that color.

    If the chart shows a low health score (red or orange), the KPIs that contributed to the low health score are provided next to the bar. Examples include Fabric CP reachability, Multicast RP, AAA Server Status, and so on.

    This KPI monitors the status of each AAA server’s Session Manager Daemon (SMD) and Wireless Network Control Daemon (WNCD) instances, which are responsible for Dot1 x and MAB authentication for wired and wireless devices.

    The iOS instance, responsible for Telnet and SSH authentication, is not monitored. This KPI applies only to Edge and Extended Node roles.

    Click a hyperlinked fabric category in the charts to open a side pane to view the respective KPI subcategories:

    • Fabric Site Connectivity: Control Plane Reachability, Extended Node Connectivity, BGP Session from Border to Control Plane, and BGP Session from Border to Peer Node for INFRA VN.

    • Fabric Control Plane: LISP Session Status.

    • Fabric Infrastructure: AAA Server Status, Pub-Sub Session Status for INFRA VN, CTS Environment Data Download.

Trend

Click the Trend tab to display a trend chart. This color-coded trend chart shows the performance of devices over a time range. Hover your cursor over the chart to display the total number of devices and their health over time.

The color in the chart represents the health of the network devices:

  • : Poor network devices. Health score range is 1 to 3.
  • : Fair network devices. Health score range is 4 to 7.
  • : Good network devices. Health score range is 8 to 10.
  • : No health data. Health score is 0.

Step 7

Use the Top 10 Issue Types area to view this information:

Issues

Displays any issues that must be addressed. Issues are listed based on the timestamp. The most recent issue is listed first.

Click an issue to open a slide-in pane to view the corresponding details, such as the description of the issue, impact, and suggested actions.

From the slide-in pane, you can do these tasks:

  • To resolve an issue:

    1. From the drop-down list, select Resolve.

    2. To view the list of issues that have been resolved, click Resolved Issues.

  • To ignore an issue:

    1. From the drop-down list, select Ignore.

    2. Set the number of hours to ignore the issue on the slider.

    3. Click Confirm.

    4. To view the list of issues that have been ignored, click Ignored Issues.

For information about the types of issues, see View and Manage Issues.

Step 8

Use the Fabric Nodes dashlet for the functionality listed in this table:

Network Devices dashlet
Item Description

Type

Filter the table based on the fabric node type with these options: All, Fabric Control Plane, Fabric Border, Fabric Edge, Fabric WLC, Fabric AP, and Extended Node.

Fabric Site Health

Filter the table based on the overall health score of the fabric site with these options:

  • All

  • Poor: Devices with a health score range from 1 to 3.

  • Fair: Devices with a health score range from 4 to 7.

  • Good: Devices with a health score range from 8 to 10.

  • No Health: Devices with no health data.

Fabric Node table

View device information for all the fabric nodes for the selected site in a table format.

Note

 
The overall health score is the minimum subscore of these KPI metric health scores: fabric site connectivity and fabric infrastructure.
The Name, Issue Type Count, and Fabric Role columns display the fabric name, issue count, and fabric role (Edge, Border, Map Server, and so on).

Under Device Fabric Site Health, in the Overall column, hover your cursor over a health score. The overall Device Fabric Site Health score is displayed along with the health and percentage value of all the KPI metrics.

Hover your cursor over the Fabric Site Connectivity, Fabric Control Plane, and Fabric Infrastructure icons to display the health scores.

Device 360

Display a 360° view of a device by clicking the device name in the Name column.

Device 360 provides detailed information for troubleshooting device issues.

Click Export to export the device information to a CSV file.

Customize the data that you want displayed in the table:

  1. Click .

    A list of options is displayed.

  2. Check the check boxes for the data you want displayed in the table.

  3. Click Apply.


Monitor the health of a transit and peer network

Use this procedure to view the details about a specific transit network.

Procedure


Step 1

From the main menu, choose Assurance > Health.

The Overall health dashboard appears.

Step 2

On the Overall health dashboard, click the SD-Access tab.

The SD-Access health dashboard appears.

Step 3

In the Transit and Peer Network table, click the name of a transit.

The Transit Site 360 window appears, which provides a 360° view of the fabric site.

Figure 3. Transit 360 window

Step 4

Click the time range setting () at the top-left corner to specify the time range for the data that you want displayed in the window:

  1. From the drop-down list, select a time range: 3 hours, 24 hours, or 7 days.

  2. Specify the Start Date and time; and the End Date and time.

  3. Click Apply.

Step 5

Use the health timeline slider to view the health score for a more granular time range and to view quality information.

Hover your cursor within the timeline to view this information:

Transit Network Health: The health score is the percentage of healthy fabric nodes in this site; it does not include the device health of control planes. The fabric category health is the minimum of underlying KPI scores.

Transit Site Control Plane: Lists the KPI subcategory, such as LISP and PubSub session of the transits. If the Transit health score is low, click View Device List to display a list of devices that contribute to the low score and their associated down sessions. Click of the hyperlinked name of the device to display device information.

Check the Telemetry Status check box below the timeline to view the horizontal bar in the timeline. To view the telemetry status:

  • Hover your cursor over the horizontal bar to view the information such as percentage of Transit Network Health, Telemetry Status such as Good, Fair, or Poor, Transit Site Control Pane and Transit Services in the tool tip.

  • Click the Telemetry Status in the tool tip to open a slide-in pane to view the telemetry status summary.

To change the scope of the data displayed in the category, click one of these tabs:

Latest: Displays the data from the selected time window in the timeline at the top of the window.

Trend: Displays data from the last 24 hours.

Step 6

Use the Transit Health area, below the timeline, to view this information:

Item Description

LATEST

Displayed by default. Includes two panes. The left pane provides the network health summary score and the total number of devices. The right pane displays charts.

  • Health Fabric Nodes: The percentage of healthy (good) nodes in your selected site.

  • Total Devices: The total number of network devices and the count of devices with Good Health, Fair Health, Poor Health, and No Health Data.

  • Charts: This color-coded snapshot-view chart shows the transit control plane over the last 5 minutes.

    Hover your cursor over a color to display the health score and the number of devices that are associated with that color.

    You can also click a hyperlinked Transit Control Plane in the charts to open a side pane to view these KPI subcategories in the Transit Control plane:

    • BGP Session from Border to Transit Control Plane

    • LISP session from Border to Transit Control Plane

    • PubSub session from Border to Transit Control Plane

    You can hover on a color segment in the chart to view the fabric node details in the table format such as name of the fabric node, issue count, fabric role, fabric site and device transit health.

TREND

Click the TREND tab to display a trend chart. This color-coded trend chart shows the performance of devices over a time range. Hover your cursor over the chart to display the total number of devices and their health over time.

The color in the chart represents the health of the network devices:

  • : Poor network devices. The health score range is 1 to 3.
  • : Fair network devices. The health score range is 4 to 7.
  • : Good network devices. The health score range is 8 to 10.
  • : No Health data. The health score is 0.

Step 7

Use the Top 10 Issue Types area to view this information:

Issues

Displays any issues that must be addressed. Issues are listed based on the timestamp. The most recent issue is listed first.

Click an issue to open a slide-in pane to view the corresponding details, such as the description of the issue, impact, and suggested actions.

From the slide-in pane, you can do these tasks:

  • To resolve an issue:

    1. From the drop-down list, select Resolve.

    2. To view the list of issues that have been resolved, click Resolved Issues.

  • To ignore an issue:

    1. From the drop-down list, select Ignore.

    2. Set the number of hours to ignore the issue on the slider.

    3. Click Confirm.

    4. To view the list of issues that have been ignored, click Ignored Issues.

For information about the types of issues, see View and Manage Issues.

Step 8

Use the Associated Fabric Sites dashlet for this functionality:

Item Description

Health

Filter the table based on the overall health score of the fabric site with these options:

  • All

  • Poor: Devices with a health score range from 1 to 3.

  • Fair: Devices with a health score range from 4 to 7.

  • Good: Devices with a health score range from 8 to 10.

  • No Health: Devices with no health data.

Associated Fabric Sites table

Displays these details in the fabric table: Fabric Site, Health, number of available Connected Transit/ Peer Networks, Layer 3 Virtual Networks, and Fabric Devices.

Device 360

Display a 360° view of a device by clicking the device name in the Name column.

The Device 360 window provides detailed information for troubleshooting device issues.

Click Export to export the device information to a CSV file.

Customize the data that you want displayed in the table:

  1. Click the settings icon ().

    A list of options is displayed.

  2. In the Table Settings slide-in pane, enable the toggle buttons for the data you want displayed in the table.

  3. Click Apply.

Step 9

Use the Fabric Nodes dashlet for this functionality:

Item Description

Type

Filter the table based on the fabric node type with these options: All, Transit Control Plane, and Border.

Transit and Peer Network Health table

Filter the table based on the overall health score of the transit with these options:

  • All

  • Poor: Devices with a health score range from 1 to 3.

  • Fair: Devices with a health score range from 4 to 7.

  • Good: Devices with a health score range from 8 to 10.

  • No Health: Devices with no health data.

Fabric Node table

View device information for all the fabric nodes for the selected transit in a table format.

Note

 
The overall health score is the minimum subscore of these KPI metric health scores: Transit Site Control Plane.

The Name, Issue Type Count, Fabric Role, and Fabric Site columns display the fabric name, issue count, fabric role, and fabric site.

In the Overall column, under Device Transit Health, hover your cursor over a health score. The overall Device Transit Health score is displayed along with the health and percentage value of all the KPI metrics.

Hover your cursor over the Transit Site Control Plane icons to display the health scores.

Device 360

Display a 360° view of a device by clicking the device name in the Name column.

The Device 360 window provides detailed information for troubleshooting device issues.

Click Export to export the device information to a CSV file.

Customize the data that you want displayed in the table:

  1. Click the settings icon ().

  2. In the Table Settings slide-in pane, enable the toggle buttons for the data you want displayed in the table.

  3. Click Apply.


Monitor the health of a virtual network

Use this procedure to view details about a specific virtual network.

Procedure


Step 1

From the main menu, choose Assurance > Health.

The Overall health dashboard appears.

Step 2

Click the SD-Access tab.

The SD-Access health dashboard appears.

Step 3

Scroll down and click Virtual Network.

Step 4

In the Virtual Network table, click the name of a virtual network.

The Virtual Network 360 window appears, which provides a 360° view of the virtual network.

Figure 4. Virtual Network 360

Step 5

Click the time range setting () at the top-left corner to specify the time range for the data that you want displayed in the window:

  1. From the drop-down menu, select a time range: 3 hours, 24 hours, or 7 days.

  2. Specify the Start Date and time; and the End Date and time.

  3. Click Apply.

Step 6

Use the virtual network health timeline slider to view the virtual network's health score for a more granular time range and to view the virtual network's quality information.

Hover your cursor within the timeline to view this information:

Virtual Network Health: Health score is the percentage of healthy devices in the VN. VN Category Health is the minimum of corresponding subcategory KPI scores. VN Services includes BGP Session from Border to Peer Node, Multicast (external RP), Default Route Registration, and VN Control Plane.

If the VN health score is low, click View Device List to display a list of devices that contribute to the low score and their associated down sessions. Click the hyperlinked name of the device to display device information.

Check the Telemetry Status check box below the timeline to view the horizontal bar in the timeline. To view the telemetry status:

  • Hover your cursor over the horizontal bar to view information such as percentage of Virtual Network Health, Telemetry Status such as Good, Fair, or Poor, Fabric Control Pane and VN Services, and VN Exit in the tool tip.

  • Click the Telemetry Status in the tool tip to open a slide-in pane to view the telemetry status summary of the virtual networks.

Click and drag the timeline boundary lines to specify the time range. This sets the context for the data that is displayed in the 360 window.

Click the Latest and Trend tabs to change the scope of data displayed in the category:

  • Latest: Displays the data from the selected time window in the timeline on the top of the window.

  • Trend: Displays data from the last 24 hours.

Step 7

Use the Virtual Network Health area, below the timeline, to view this information:

Virtual network health
Item Description

Latest

Displayed by default. The left pane provides the virtual network health summary score and the total number of devices. The right pane displays charts.

  • Healthy Fabric Nodes: The percentage of healthy (good) nodes in your selected site.

  • Total Devices: Total number of fabric devices and the count of devices with Good Health, Fair Health, Poor Health, and No Health data.

  • Charts: This color-coded, snapshot-view chart shows the KPIs with subcategories such as VN Control Plane (Pub-Sub Sessions Status) and VN Services (BGP Session from Border to Peer Node, Multicast-external RP, and Default Route Registration).

    Hover your cursor over a color to display the health score and the number of devices that are associated with that color.

    If the chart shows a low health score (red or orange), the KPIs that contributed to the low health score are provided next to the bar.

    Click a hyperlinked category to open a side pane with more details.

Trend

Click the Trend tab to display a trend chart. This color-coded trend chart shows the performance of devices over a time range. Hover your cursor over the chart to display the total number of devices and their health over time.

The color in the chart represents the health of the network devices:

  • : Poor network devices. Health score range is 1 to 3.
  • : Fair network devices. Health score range is 4 to 7.
  • : Good network devices. Health score range is 8 to 10.
  • : No Health data. Health score is 0.

Step 8

Use the Top 10 Issue Types area to view this information:

Issues

Displays any issues that must be addressed. Issues are listed based on the timestamp. The most recent issue is listed first.

Click an issue to open a slide-in pane to view the corresponding details, such as the description of the issue, impact, and suggested actions.

From the slide-in pane, you can do these tasks:

  • To resolve an issue:

    1. From the drop-down list, select Resolve.

    2. To view the list of issues that have been resolved, click Resolved Issues.

  • To ignore an issue:

    1. From the drop-down list, select Ignore.

    2. Set the number of hours to ignore the issue on the slider.

    3. Click Confirm.

    4. To view the list of issues that have been ignored, click Ignored Issues.

For information about the types of issues, see View and Manage Issues.

Step 9

Use the Virtual Network Devices dashlet for this functionality:

Virtual network devices dashlet
Item Description

Type

Filter the table based on the type.

Virtual Network Health

Filter the table based on the overall health score of the virtual network with these options:

  • All

  • Poor: Devices with a health score range from 1 to 3.

  • Fair: Devices with a health score range from 4 to 7.

  • Good: Devices with a health score range from 8 to 10.

  • No Health: Devices with no health data.

Virtual Network Devices table

View device information for the selected item in a table format.

Note

 
The overall health score is the minimum subscore of these KPI metric health scores: virtual network connectivity and infrastructure.

Hover your cursor over the various health scores and icons to display additional information. \

Device 360

Display a 360° view of a device by clicking the device name in the Name column.

Device 360 provides detailed information for troubleshooting device issues.

Click Export to export the device information to a CSV file.

Customize the data that you want displayed in the table:

  1. Click .

    A list of options appear.

  2. Check the check boxes for the data you want displayed in the table.

  3. Click Apply.


Virtual network health score

Currently, the Multicast VN service is the only KPI that contributes to the VN health score.