Cisco Catalyst Assurance User Guide, Release 3.1.3
Bias-Free Language
The documentation set for this product strives to use bias-free language. For the purposes of this documentation set, bias-free is defined as language that does not imply discrimination based on age, disability, gender, racial identity, ethnic identity, sexual orientation, socioeconomic status, and intersectionality. Exceptions may be present in the documentation due to language that is hardcoded in the user interfaces of the product software, language used based on RFP documentation, or language that is used by a referenced third-party product. Learn more about how Cisco is using Inclusive Language.
Sensors use sensor-driven tests to determine the health of wireless networks. A wireless network includes AP radios, WLAN
configurations, and wireless network services.
Assurance supports a dedicated sensor, which is dedicated hardware for doing sensor functions.
The dedicated Cisco Aironet 1800s Active Sensor gets bootstrapped using PnP. After this sensor obtains Assurance server-reachability details, it directly communicates with the Assurance server.
Provision sensors
Provision the wireless Cisco Aironet 1800s Active Sensor
Procedure
Step 1
If you are using the Cisco Aironet AP 1800s Sensor without an Ethernet module, you must enable CiscoProvisioningSSID on the wireless controller.
Note
For the Cisco Aironet 1800s Active Sensor earlier than Software Release 1.3.1.2, make sure that you do not select the sensor
device profile CiscoProvisioningSSID. Instead, select your own SSID for backhaul purposes. See Manage backhaul settings.
(Optional) After the sensor device is available in the device inventory, you can select to upgrade the software image. See the "Provision Software Images" topic in the Cisco Catalyst Center User Guide.
Enable Provisioning SSID on the wireless controller
Procedure
Step 1
Log in to the Cisco Wireless Controller.
The Network Summary page appears.
Step 2
Click the Advanced tab.
The Summary page appears.
Step 3
In the top menu bar, click the Management tab.
Step 4
From the left-navigation pane, choose Cloud Services > Sensor.
The Backhaul Configuration page appears.
Step 5
In the SSID field, enter TFTP.
Step 6
From the Auth-type drop-down list, select Open.
Step 7
From the Provisioning drop-down list, select Enable.
Step 8
Make sure that the DHCP Interface drop-down list is set to management.
Step 9
Click Apply.
After provisioning is enabled, a hidden WLAN called CiscoSensorProvisioning is created, and the sensor joins using an EAP-TLS client certificate. This enables the sensor to find the Catalyst Center IP address, which is done using DHCP Option 43 or through DNS.
Enable Provisioning SSID on the Cisco CatalystWireless Controller
Procedure
Step 1
Log in to the Cisco CatalystWireless Controller GUI.
Step 2
From the left-navigation pane, choose Configuration > Cloud Services.
The Cloud Services page appears.
Step 3
In the Network Assurance tab, do these steps:
From the Network Assurance Configuration area, set the Service Status toggle to Enabled.
From the Provisioning area, set the Provisioning toggle to Enabled.
Step 4
(Optional) In the VLAN Interface field, enter the name of the VLAN interface.
Step 5
Click Apply.
After Provisioning is enabled, a hidden WLAN called CiscoSensorProvisioning is created.
This error message appears in the bottom-right corner of the window.
Error in Configuring
CLI Line 2 Please associate the wlan and policy profile CiscoSensorProvisioning to the desired AP.
Note
This message is not an error. The message provides information about the action that must be done.
Step 6
Verify that the CiscoSensorProvisioning policy profile is created.
From the left-navigation pane, choose Configuration > Policy.
The Policy Profile page appears.
Verify that the CiscoSensorProvisioning policy appears under the Policy Tag Name column.
Step 7
Associate the WLAN and policy profile CiscoSensorProvisioning to the appropriate AP. Do these steps:
From the left-navigation pane, choose Configuration > Tags.
The Manage Tags page appears.
In the Policy tab, click Add.
In the Name field, enter a unique name for the Policy Tag.
Click Add.
From the WLAN Profile drop-down list, select CiscoSensorProvisioning.
From the Policy Profile drop-down list, select CiscoSensorProvisioning.
Click ✔.
Click Save & Apply to Device to save the Policy Tag.
Note
Changing the Policy Tag on an AP may cause clients associated with the AP to disconnect and reconnect.
Provision a wireless or sensor device
This procedure explains how to claim a device from the Plug and Play Devices list. Alternatively, you can claim a device from
the device Details window by clicking Claim.
Before you begin
Ensure that Cisco network devices to be provisioned have a supported software release and are in a factory-default state.
If you are using a network device that was previously configured or is in an unknown state, see the device clean-up and reset
details in the Network Plug and Play Troubleshooting Guide.
Define the CLI and SNMP credentials for the devices.
Note
You can claim wireless devices using CLI, SNMPv2c, or SNMPv3 credentials. If you use SNMPv2c, provide both Read Only and Read
Write credentials.
Optionally, ensure that the software images for any Cisco Catalyst 9800-CL devices to be provisioned are uploaded and marked
as golden in the Image Repository, if you want to deploy images.
Note
The image deployment process used by Plug and Play during day-0 provisioning is not the same as that used when updating a
device image later. During Plug and Play provisioning, there are no device prechecks, auto flash cleanup, or postchecks done,
as it is expected that devices are in the factory-default state.
For provisioning a sensor device, ensure that the sensor is reachable through the Catalyst Center enterprise IP address (private/enp9s0). A DHCP option 43 string makes the device reachable in unclaimed mode in Catalyst Center; however, to claim the device, it must be reachable from the interface enp9s0 IP address. In the DHCP server, configure the
NTP server (DHCP option 42) and the vendor-specific DHCP option 43 with ACSII value "5A1D;B2;K4;I172.16.x.x;J80;", where 172.16.x.x
is the virtual IP address of Catalyst Center associated with the enp9s0 interface.
Procedure
Step 1
From the main menu, choose Provision > Plug and Play.
Step 2
View the devices in the table.
You can use the search bar to find specific devices.
Step 3
Check the check box next to the device or devices that you want to claim.
Step 4
From the menu bar above the device table, choose Actions > Claim.
Step 5
(Optional) In the Assign Site window, do these steps:
Change the device hostname, if needed.
Assign a site by doing any of these tasks:
To assign a different site to each device, click Assign, and from the Select a Site drop-down list, select a site.
To assign the same site as the first device to all other devices, in the Actions column, hover your cursor over the ellipsis icon and select Apply Site to All.
To assign a site from any device to some other devices, in the Actions column, hover your cursor over the ellipsis icon and select Assign this Site to Other Devices, select the devices, and click Assign.
To clear the site assigned to the devices, click Clear Site.
If the wireless network profile associated with the assigned site has an onboarding template, Catalyst Center uses this template for PnP onboarding.
Note
In the System > Settings > Device Settings > PnP AP Location window:
If the Configure AP Location check box is checked, Catalyst Center assigns this site as the AP location during PnP onboarding.
If the Configure AP Location check box is unchecked, Catalyst Center does not configure this site as the AP location during PnP onboarding. You can configure the AP location using the Configure Access Points workflow.
In the Assign Configuration window, do these steps:
In the Configuration column, click Assign for the device that you want to configure.
If the device configuration doesn't need any changes, click Cancel and continue to the next step. Otherwise, change or configure any of these settings:
Device Name: Change the device hostname, if needed.
Image: From this drop-down list, select a golden software image to apply to the device. If there is only one golden image for this
device type in the image repository, it is chosen by default.
Note
If the device software image version or golden tagged version is 17.14.1 or later, the device claim is blocked if the selected
site is configured with MD5 authentication for SNMP credentials.
To claim the device, you must also configure SHA authentication for SNMP credentials, or the software image version must be
earlier than 17.14.1. For more information, see "Edit Global Device Credentials" in the Cisco Catalyst Center User Guide.
Template: From this drop-down list, select an onboarding configuration template to apply to the device. If there is only one onboarding
configuration template defined for this device type, it is chosen by default.
Note
If you have not assigned the device to a site, you must select a template for the device to continue.
Catalyst Wireless LAN Controller Settings: For a wireless controller, enter values in these fields: Wireless management IP, Subnet mask, Gateway, IP interface name, and optionally, VLAN ID.
For an AP device, in the Radio Frequency Profile drop-down list, select a radio frequency profile to apply to the device. This may be set if you designated one profile as
a default.
For a Mobility Express device, enter values in these fields: Wireless management IP, Subnet mask, and Gateway.
For a wireless sensor device, in the Sensor Settings drop-down list, select the sensor device profile (backhaul) to apply to the device.
Note
For Cisco Aironet 1800s Active Sensor earlier than 1.3.1.2, make sure that you do not select the sensor device profile CiscoProvisioningSSID. Instead, select your own SSID for backhaul purposes.
If you made any changes, click Save; otherwise, click Cancel to return to the list and configure other devices.
From the Clear Configuration drop-down list, select any these options:
Clear Device Certificates: Select this option and check the check box next to each of the devices that you want to clear the certificate from, and
click Clear.
Clear Images: Select this option and check the check box next to each of the devices that you want to clear the image from, and click
Clear.
Clear Templates: Select this option and check the check box next to each of the devices that you want to clear the template from, and click
Clear.
Clear License Levels: Select this option and check the check box next to each of the devices that you want to clear the license level from, and
click Clear.
To apply an image or template from one device to other devices, in the Actions column, hover your cursor over the ellipsis icon and select Apply Image to Other Devices or Apply Template to Other Devices.
For wireless controller devices, you can apply the device license level to other devices by clicking Apply License Level to Other Devices.
If you selected multiple devices to provision, click Assign for the next device in the list and repeat the configuration steps, until you have done this for all devices.
After you have configured all the devices, click Next.
Step 7
In the Provision Templates window, select the template from the Devices area, enter your domain name in the domain field, and click Next.
Step 8
In the Summary window, view details about the devices and their configuration preview.
Step 9
Check the Device Configuration column for each device to see if the configuration preview succeeded.
If the preview shows an error, you can click the Actions link in the error message above the table to see what actions you need to take. You can click an action to open a new tab
with the window where a change is needed. You must resolve any issues before claiming the device, to avoid provisioning errors.
You may need to go back to the Assign Configuration step and change the configuration, revisit the Design area to update network design settings, or resolve any network connectivity issues. After you have resolved the problem,
you can go back to this tab, click Retrying getting Day-0 configuration preview for failed device(s), and click OK. Ensure that the wireless controller that is managing a device has been added to the inventory and assigned to the site where the wireless device is assigned.
Step 10
In the Device Configuration column, click Preview Configuration to review the configuration.
Step 11
Click Claim.
Step 12
In the confirmation dialog box, click Yes to claim the devices and start the provisioning process.
Note
If there is a conflicting operation for the selected site, to continue with the current configuration, you must either wait
for the existing, scheduled, or pending-review operations to complete or discard the operations.
What to do next
If you have configured network settings, provision these settings on the devices. For more information, see the "Complete
the Provisioning Process" in the Cisco Catalyst Center User Guide.
Monitor and troubleshoot network health with sensors
Monitor and troubleshoot network health with all wireless sensors
Use this procedure to get a global view of the network health from the data received from all wireless sensors.
From the main menu, choose Assurance > Dashboards > Wireless Sensors.
Figure 1. Wireless sensors dashboard
Step 2
Use the Wireless Sensors dashboard top-menu bar for this functionality:
Timeline area
Item
Description
Time Range setting
Enables you to display data within a specified time range on the dashboard. Do these steps:
From the drop-down menu, select the length of the range: 3 Hours, 24 Hours, or 7 Days.
Specify the Start Date and time; and the End Date and time.
Click Apply.
Hierarchy Location setting
Enables you to select the data displayed on the dashboard from the selected locations in your network. Check the check boxes
for the sites, buildings, or floors in your network to display its sensor data on the dashboard.
Note
You can't exclude all locations from displaying data on the dashboard. Unchecking all locations results in data from all locations
to be displayed on the dashboard.
Filter icon
Enables you to select the data displayed on the dashboard based on SSIDs and radio frequency bands.
To add filters:
Click Filter.
From the drop-down menu, click the SSID tab and check the check boxes for the desired SSIDs.
From the drop-down menu, click the Band tab and select the radio button for 2.4 GHz or 5 GHz.
Click Apply.
To remove all selected filters:
Click the Filter icon.
Click Clear Filters.
Step 3
Use the Timeline to view the percentage of overall test failures for a specific time within a time range.
The time range is determined by what is configured in the setting above the timeline.
The blocks in the timeline represents a specific time window within the time range. The period of time for each block is determined
by time range set for the timeline:
For a 3 Hours time range, each block represents 15 minutes.
For a 24 Hours time range, each block represents 30 minutes.
For a 7 Days time range, each block represents 4 hours.
The blocks are color-coded to indicate the severity of percentage of test failures.
Hover your cursor over a block to view a breakdown of percentage of test result failures for each test category.
Step 4
Use the Overall Summary dashlet for this functionality:
Overall summary dashlet
Item
Description
Total Sensors area
Provides an overall view of all the sensors in your network and their status. The status types of the sensor include:
Idle: The sensor is onboarded and does not have any scheduled tests.
Running: The sensor is onboarded and is included in a test suite or test template.
Unreachable: No heartbeat received from the sensor.
Click the hyperlinked number next to the status type to open a slide-in pane that displays the sensors with that status.
Displays the total number of tests performed by all sensors and a breakdown of the test results based on these test categories:
Onboarding
RF Assessment
Network Services
Performance
App. Connectivity
Email
You can click a test category to open a slide-in pane with additional details about its test results.
In the slide-in pane, click the test type tabs on the left to populate the slide-in pane with data from the test type. The
slide-in pane displays:
A chart that displays the test results, future trends, and list of APs used in the tests.
Note
For the RF Assessment test category, the chart displays the KPIs data rate and SNR, instead of test results.
Data type categories: Top Failure Reasons (if applicable), Top APs, Top Locations, Top Bands, and Top SSIDs (if applicable).
A table with detailed data of the sensors that ran the tests.
You can click the data segments from the data type categories to filter the data that appears in the table.
Edit Threshold
Enables you to customize the thresholds of the color-coded ranges that indicate the severity of percentage of test result
failures.
To customize the thresholds:
Click the edit () icon.
In the Edit Threshold menu, enter the percentage values in the fields for each color-coded range.
Click Apply.
Step 5
Use the Test Results dashlet to view the locations in your network with the most sensor test result failures:
Test results dashlet
Item
Description
Latest tab and Trend tab
These tabs determine the scope of the data that is displayed in the dashlet:
Latest: Displays the data from the selected time window in the timeline on the top of the window.
Trend: Displays data from the last 24 hours.
Heatmap View and Card View toggle
This toggle button allows you to change the view of the dashlet to the Heatmap View and the Card View.
The Heatmap View is displayed by default.
Heatmap View
Displays the top 5 rankings of these statistical categories at the top of the dashlet:
Worst Location, Buildings, Floors, or Sensors: Sites, buildings, floors, or sensors with the highest test result failure percentage.
Largest Health Drop by Location, Buildings, Floors, or Sensors: Sites, buildings, floors, or sensors with the largest sudden drop.
Most Common Test Failure: Test types that had the highest test result failures.
Only the top spot for each statistical category is displayed. Click Show Data for Impact Top 5 to see the complete rankings.
Below the rankings is a heatmap representation of the sensor test result failures. In the heatmap, the blocks are color-coded
to indicate the severity of percentage of test result failures.
Use the drop-down lists in the Find the most problematic area to sort the data that is displayed in the rankings and heatmap. In the first drop-down list you can sort the data by
locations or sensors. In the second drop-list you can sort the data by test types.
Use the search field to filter the heatmap for specific locations or sensors.
Hover your cursor over a block to view the exact percentage value for test result failures.
Click a color-coded block to open a slide-in pane with further details about the test results at that intersect.
Card View
Displays the data in a card format for high-level monitoring and comparison.
Use the drop-down lists in the Find the most problematic area to sort the data.
Monitor and troubleshoot network health with a wireless sensor
Use this procedure to get a 360° view of a specific wireless sensor. You can view a sensor's test results, performance trends,
and neighboring APs. You can also view and download a sensor's event logs.
Procedure
Step 1
From the main menu, choose Assurance > Dashboards > Wireless Sensors.
The Sensor Dashboard appears.
Step 2
From the Sensors Dashboard, do one of these tasks:
In the Overall Summary dashlet, click the hyperlinked number from the Running, Idle, or Unreachable areas.
Then in the Sensor Status slide-in pane, click the hyperlinked name of the sensor.
In the Overall Summary dashlet, click a hyperlinked test category.
In the slide-in pane, click the hyperlinked name of the sensor from the table.
In the Test Results dashlet, click a color-coded box from the heatmap.
In the slide-in pane, click the hyperlinked name of the sensor from the table.
A 360° view of the sensor appears.
Step 3
Click the Time Range setting at the top-right corner to specify the time range of data that is displayed on the window:
From the drop-down menu, select a time range: 3 hours, 24 hours, or 7 days.
Specify the Start date and time; and the End date and time.
Click Apply.
Step 4
Use the header above the timeline to view the basic information of the sensor such as the sensor's serial number, current
state, uptime, backhaul type, IP address, and so on. You can also view and download the sensor's event logs.
To view and download the event logs:
Click View Logs at the end of the header.
The Event Logs slide-in pane appears which displays the event logs.
In the Event Logs slide-in pane, click Request Support Bundle to generate the support bundle file which contains the event logs.
Attention
It takes about three to five minutes for a support bundle request to be ready for download.
Click Download Support Bundle to open the download prompt for the support bundle.
Step 5
Use the timeline to view the percentage of overall test failures for a specific time within a specified time range. The timeline
has this functionality:
Set the time range with the Time Range setting above the time line.
View the percentage of overall test failures for a specific time window indicated by the blocks in the timeline. You can hover
your cursor over a block to view a breakdown of percentage of test result failures for each test category.
Step 6
Use the collapsible categories to view information about test results, performance trends, and neighboring APs:
Test results category
Displays a heatmap representation of the sensor test result failures for each tested AP. In the heatmap, the blocks are color-coded
to indicate the severity of percentage of test result failures.
Use the Test Type drop-down list to sort the data by test type.
Use the search field to filter the heatmap for specific APs.
Hover your cursor over a block to view the exact percentage value for test result failures.
Click the Latest and Trend tabs to change the scope of data displayed in the category:
Latest: Displays the data from the selected time window in the timeline on the top of the window.
Trend: Displays data from the last 24 hours.
Sensor performance trend category
Displays a line graph or chart of the sensor performance data based on test types. For time-based test types, a comparative
view is used to display the performance of the current sensor, top performing sensor, and worst performing sensor.
Use the Test Type drop-down list to display data for a specific test type.
For time-based test types, click + Add Custom Location to add the sensor performance data for a specific location using the menu. You can select the sensor performance for sites,
buildings, or floors.
Neighboring APs category
Displays the sensor's neighboring APs along with its RSSI in a list view and a map view.
To filter the APs based on frequency bands, use the radio buttons in the Band area.
Note
The sensor scans for neighboring APs every 30 minutes.
Manage sensors and backhaul settings
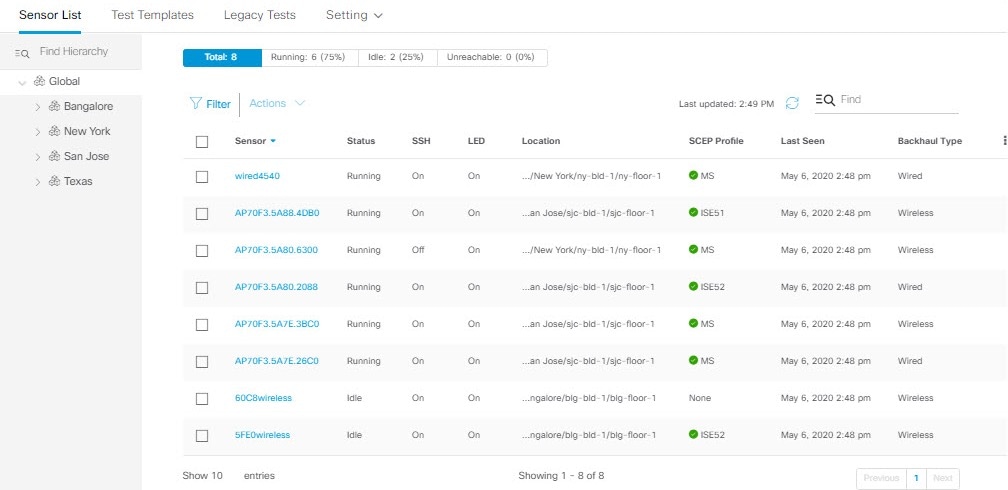
Manage sensors in your network
Use this procedure to view the onboarded sensors in your network. You can enable SSH, the status LED, and change the name
for these sensors.
Before you begin
Make sure the sensors are assigned to a site.
Procedure
Step 1
From the main menu, choose Assurance > Settings > Sensors.
The Sensor List window appears.
Figure 2. Sensor List window
Step 2
Use the left pane to specify the network hierarchy you want to view.
Step 3
Click the categories above the table to view the sensors that fit their criteria. The categories are:
Total: All the sensors in the selected network hierarchy.
Running: Displays the sensors that are currently running tests.
Idle: Displays the sensors that have no assigned tests.
Unreachable: Displays the sensors that are onboarded but are not responding.
Step 4
You can customize the data that is displayed in the table:
Click .
From the menu, check the check boxes of the data you want displayed in the table.
Click Apply.
Step 5
To configure the SSH settings for a sensor:
Check the check box of the sensor.
Hover your cursor over the Actions drop-down list and select Edit SSH.
The Edit SSH slide-in pane appears.
In the Edit SSH slide-in pane, click the SSH toggle to enable SSH.
In the Username and Password fields, enter the desired SSH credentials.
Click Save.
Step 6
To change the status LED of a sensor:
Check the check box of the sensor.
Hover your cursor over the Actions drop-down list and select Edit LED.
The Edit LED slide-in pane appears.
In the Edit LED slide-in pane, click the LED toggle to enable or disable the status LED.
Step 7
Click Save.
Step 8
To change the name of a sensor:
Check the check box of the sensor.
From the Actions drop-down list, select Edit Sensor Name(s).
The Edit Sensor Name(s) slide-in pane appears.
In the Edit Sensor Name(s) slide-in pane, enter the name in the Name field.
Click Save.
Step 9
To enroll the sensors using SCEP profiles:
Check the check box of the sensor.
From the Actions drop-down list, select Enroll using SCEP.
The Enroll using SCEP slide-in pane appears.
Select the SCEP profile from the Select SCEP Profile drop-down list.
Select the Username and Password and provide the required details. If you select the Custom username option, then select No Password.
Click Save.
To check status, see the SCEP Profile column in the Sensor List window. A green check mark (✔) indicates success, and a red X icon indicates failure. Hover your cursor over the ✔ or X icon to get more information.
Manage backhaul settings
Use this procedure to view, create, and manage backhaul configurations for wireless sensors. A wireless sensor requires a
backhaul SSID to communicate with Catalyst Center.
From the main menu, choose Assurance > Settings > Sensors.
The Sensor List window appears.
Step 2
Hover your cursor over the Settings tab and select Backhaul Settings.
Step 3
You can add and manage backhaul SSIDs by doing these steps:
Click + Add Backhaul.
The Create Sensor Backhaul SSID Assignment window appears with two areas: Wired Backhaul and Wireless Backhaul.
In the Settings Name field, enter a name for the backhaul SSID.
In the Wired Backhaul area, do this configuration:
Level of Security: Displays the encryption and authentication type used by the selected SSID. The available security options are:
802.1x EAP: Standard used for passing Extensible Authentication Protocol (EAP) over wired LAN.
Open: No security or authentication is used.
EAP Method: If you select 802.1x EAP, you must select one of these EAP methods for user authentication from the drop-down list:
EAP-FAST: Enter the username and password in the fields provided.
PEAP-MSCHAPv2: Enter the username and password in the fields provided.
EAP-TLS: Select Enroll Using Certificate Bundle or Enroll Using SCEP.
If you select Enroll Using Certificate Bundle, click the drop-down arrow under Certificate Bundle, click + Add New Certificate Bundle, and enter the username and certificate bundle password.
PEAP-TLS: Select Enroll Using Certificate Bundle or Enroll Using SCEP.
If you select Enroll Using Certificate Bundle, click the drop-down arrow under Certificate Bundle, click + Add New Certificate Bundle, and enter the username and certificate bundle password.
In the Wireless Network Name (SSID) area, select the wireless network (SSID) and do this configuration.
Level of Security: Displays the encryption and authentication type used by the selected SSID. The available security options are:
WPA2 Enterprise: Provides a higher level of security using Extensible Authentication Protocol (EAP) (802.1x) to authenticate and authorize
network users with a remote RADIUS server.
WPA2-Personal: Provides a good security using a passphrase or a preshared key (PSK). This allows anyone with the passkey to access the
wireless network.
If you select WPA2 Personal, enter the passphrase in the Passphrase text box.
PSK Format: The available preshared key formats are:
ASCII: Supports ASCII PSK passphrase.
HEX: Supports 64-character HEX key PSK password.
Open: No security or authentication is used.
Click Save.
Step 4
You can edit the existing backhaul configurations by doing these steps:
Check the check box of the backhaul configuration.
Hover your cursor over the Actions drop-down list and select Edit.
Step 5
You can delete a backhaul configuration by doing these steps:
Check the check box of the backhaul configuration.
Hover your cursor over the Actions drop-down list and select Delete.
Persistent wireless backhaul connections on sensor devices
Catalyst Center supports a persistent wireless backhaul connection on sensor devices, which means that the wireless connection is "always
on" regardless of wireless testing activities.
With a dedicated backhaul connection, the wireless sensor uses these two MAC addresses for backhaul and wireless purposes:
Base Radio + 0x10 (Backhaul SSID)
Base Radio + 0x11 (Test SSID)
The wired sensor uses the Base Radio + 0x10 (Test SSID) MAC address for testing purposes.
The sensor uses dual concurrent radio operations, one for the backhaul connection and the other for wireless tests.
Backhaul connection interruptions occur during scanning and switching interfaces to test different bands.
The frequency of backhaul connection disruptions is dependent on the test configuration.
The backhaul connection is not persistent if both backhaul and test SSIDs are in one band.
Manage SCEP profiles
Use this procedure to view, create, and manage Simple Certificate Enrollment Protocol (SCEP) profiles, which are used to enroll
wireless sensors.
Procedure
Step 1
From the main menu, choose Assurance > Settings > Sensors.
Step 2
Click Setting > SCEP Profiles.
Step 3
To add and manage an SCEP profile:
Click Add SCEP Profiles.
The Create SCEP Profile window appears.
In the Create SCEP Profile window, provide these details:
SCEP Profile Name: Enter a name for the SCEP profile.
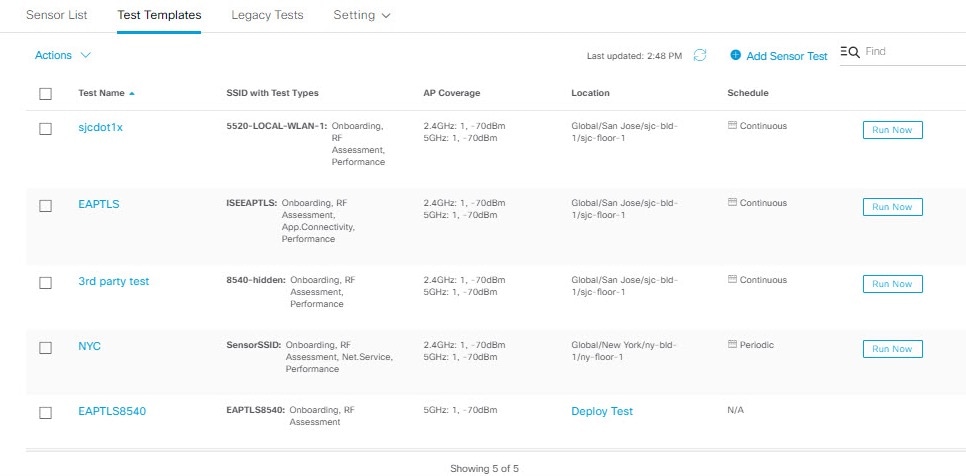
Create and run sensor-driven tests using templates
Use this procedure to create and run sensor-driven tests using templates. The workflow for sensor-driven tests using templates
consists of two parts:
Create the test template: Configure the test configurations such as the SSIDs to test, test types to use, and the AP coverage.
Deploy the test template: After a test template is created, select the locations for testing and set the test schedule. After a test template is deployed,
it is ready to be run.
Using templates is beneficial if you have a use case that requires a sensor-driven test to be run at different locations and
with different schedules. With templates, you can create duplicates that can be deployed for each instance of the test location
and schedule. This saves you time from having to recreate the same test for each instance.
Before you begin
If you are using the Cisco Aironet 1800s Active Sensor to run sensor-driven tests, make sure that the sensor is provisioned
using PnP, so that it displays under Inventory.
See Provision the wireless Cisco Aironet 1800s Active Sensor.
If a sensor test template restarts, all sensors on that template begin running their tests at the same time, which causes
the result graphs to show a cyclical pattern.
Procedure
Step 1
From the main menu, choose Assurance > Sensors.
Step 2
Click the Test Templates tab.
The Test Templates window appears.
Figure 3. Test Templates window
Step 3
Click + Add Sensor Test to create a new sensor test template.
The workflow for creating a sensor test template appears.
Step 4
On the Set up Sensor Test window, configure these settings:
Test Template Name: Enter the name for the test.
Note
Use only letters, numbers, underscores, hyphens, and periods.
SSID Selection: Check the check boxes for the SSIDs you want to include for the sensor test.
Step 5
On the Enter SSID Credentials window, enter the credentials for the selected SSIDs:
For SSIDs with Open security, select these options:
Open: For SSIDs with WebAuth passthrough, enter the email address.
ISE Guest Portal: Select the labels for the ISE guest portal.
Clearpass Guest Portal: Select the labels for the Clearpass guest portal and then click Apply.
For SSIDs with WPA2 Personal security, enter the password.
For SSIDs with WPA2 Enterprise security, enter the EAP method, username, and password.
Step 6
To enable proxy settings:
Check the Add Proxy Settings check box.
Configure these proxy settings:
Proxy Server
Proxy Port
Proxy UserName
Proxy Password
Step 7
On the Define Sensor Test Category Details window, check the check boxes for the tests that you want to include:
For the Onboarding test category, the test types are Association, Authentication, and DHCP.
Note
All of these test types are selected by default and cannot be excluded from the test template.
For the RF Assessment test category, the test types are Data Rate and SNR.
Note
All of these test types are selected by default and cannot be excluded from the test template.
For the Network Services Tests test category, select from these test types:
DNS: Resolves the IP address for the domain name.
RADIUS: The sensor acts as a Dot1x supplicant and authenticates through wireless.
For the Performance Tests test category, select from these test types:
Internet (NDT): Does a speed test using Network Diagnostic Tool (NDT).
If you have a Network Diagnostics Test (NDT) server, enter the IP address of the NTD server in the field provided. If the
NDT server is reachable through a proxy server, enter the IP address of the proxy server in the field provided.
iPerf3: iPerf3 test is a tool used to measure network performance. This feature allows you to perform a speed test in the network
with a certain amount of traffic to determine whether the test is able to pass through the traffic.
To run the iPerf3 test, check the iPerf3 check box, and then enter the IP address of the iPerf3 server, UDP bandwidth, and
port details in the fields provided.
iPerf3 Limitations
You can add up to five iPerf3 servers.
You can configure each iPerf3 server to use a maximum of five ports per template. Sensors randomly select the port in which
it wants to run the iPerf3 test.
Two sensors cannot connect to the same port concurrently on a given iPerf3 server.
The “iPerf: Server Busy" error message indicates that there are not enough iPerf3 instances to support the number of the sensors
that are running the iPerf3 test.
To resolve this issue, do one of these tasks:
Add iPerf3 server instances. To do so, expand the ports that support iPerf3 testing on the existing servers.
Reduce the number of sensors that are configured to run the iPerf3 test. To do so, create a separate template for iPerf3 testing.
IP SLA: Runs UDP jitter, UDP echo, packet loss, and latency measurements from sensor to APs.
To run the IPSLA test, select a Service Level option for each SSID from the drop-down list. Options are Platinum (voice), Gold (video), Silver (best effort), and Bronze (background).
For the Application Tests test category, select from these test types:
Host Reachability: Tests for reachability using (ICMP) echo request.
Web: Tests for access to the provided URL and verification of the response data.
FTP: Tests for file upload and download operations
Note
The maximum file size for the sensor test is 5 MB.
For the Email test category, select from these test types:
POP3: Post Office Protocol3, connects to POP3 server TCP port (110).
IMAP: Internet Message Access Protocol, connects to IMAP server TCP port (143).
Outlook Web Access: Logs into the Outlook Web Server (OWS) and verifies access.
Step 8
On the Select AP Coverage window, do these steps:
Check the frequency band check boxes (2.4GHz and 5GHz) that you want to test.
From the Number of Target APs drop-list for the selected bands, select the number of APs that you want the sensor to test against.
Note
You can select a maximum of five APs.
In the RSSI Range slider for the selected bands, drag the slider to the desired RSSI threshold.
Step 9
On the Summary window, review the template settings.
To reconfigure the settings, click Edit in the SSIDs and AP Coverage dashlets.
Step 10
Click Create Test to create the template.
The test template is created and a dialog box appears for confirmation.
Step 11
On the Done! Sensor Test Created confirmation window, click Deploy Test to Locations to configure the locations and schedule for the test template.
Important
If you return to the Test Templates window without deploying the test, click Deploy Test from the Location column to continue to the next step of deploying the test.
Step 12
On the Select Location window, from the left tree hierarchy, check the check boxes of the sites where you want to deploy the test template.
Step 13
On the Set Schedule window, select one of the test frequency options:
Periodic: Runs the test at specified intervals. Use the Interval drop-down list to select the time between intervals.
Scheduled: Runs the tests on designated days of the weeks for a specified duration:
Click the S, M, T, W, T, F, and S buttons to select the days of the week to run the test.
For the selected days, specify the start and end time for the test period from the From time pickers.
From the Select Value drop-down menu, select the desired test duration for the test period.
To add another test period for the selected day, click + Add to add a new row for configuring the test period.
To remove a test period, click the trash can icon.
Continuous: The test runs indefinitely and repeats after completion.
Step 14
On the Summary window, review the deployment details.
To update the details, click Edit in the Location and Schedule dashlets.
Step 15
Click Deploy Test.
If you plan to run IP SLA performance tests, the Warning dialog box appears. Click Deploy to confirm that you want to enable IP SLA on the wireless controllers in the selected sites, so the sensors can run IP SLA tests against the APs.
The test template displays in the Test Templates table on the Test Templates window.
Step 16
Click the test template's corresponding Run Now to run the test.
Manage sensor-driven test templates
Use this procedure to manage sensor-driven test templates. You can duplicate and delete sensor-driven test templates, as well
as undeploy running sensor-driven test templates.
Check the check box for the test template that you want to duplicate.
From the Actions drop-down list, select Duplicate.
In the Input the new Test Name dialog box, enter a name for the duplicate test template.
Click Save.
The duplicate of the test template displays in the Test Templates window. To deploy the test, click the test template's corresponding Deploy Test from the Location column.
Step 4
To delete a test template:
Check the check box for the test template that you want to delete.
From the Actions drop-down list, select Delete.
In the Warning dialog box, click Yes.
The test template is deleted.
Step 5
To undeploy a test template:
Check the check box for the running test template that you want to undeploy.
From the Actions drop-down list, select Undeploy.
In the Warning dialog box, click Undeploy.
Note
If the test template is configured to run IP SLA performance tests, clicking Undeploy confirms that you want to disable IP SLA on the wireless controllers in the selected sites, so the sensors don't run IP SLA tests against the APs.
The test template stops running.
Warning
If you undeploy a test template, its location and schedule settings are removed.

 and select
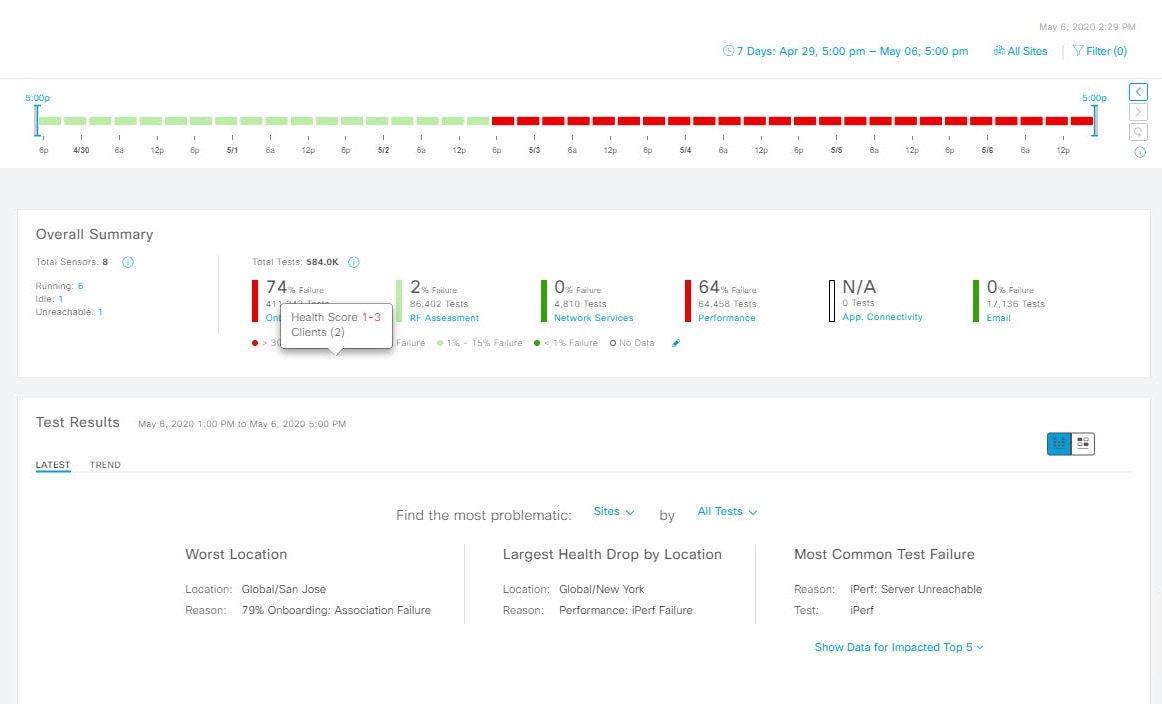


 .
.
 Feedback