Cisco Catalyst Assurance User Guide, Release 3.1.3
Bias-Free Language
The documentation set for this product strives to use bias-free language. For the purposes of this documentation set, bias-free is defined as language that does not imply discrimination based on age, disability, gender, racial identity, ethnic identity, sexual orientation, socioeconomic status, and intersectionality. Exceptions may be present in the documentation due to language that is hardcoded in the user interfaces of the product software, language used based on RFP documentation, or language that is used by a referenced third-party product. Learn more about how Cisco is using Inclusive Language.
Monitor and troubleshoot the health of your network
Use this procedure to get a global view of your network and to determine if there are potential issues that must be addressed.
A network consists of one or more devices, including routers, switches, wireless controllers, and access points. Be aware
that clients and devices in maintenance mode are not part of the network health score.
Assurance supports site-based, role-based access control (SRBAC), which limits a user's scope of access to certain network
sites. You must ensure you have access to the sites and devices while using the network health dashboard. For more information
on user roles and permissions, see Cisco Catalyst Center Administrator Guide
Note
The network health score exists only in the context of a location. If the location of a device is not available, it is not
counted in the network health score.
Procedure
Step 1
From the main menu, choose Assurance > Health.
The Overall health dashboard appears.
Step 2
Click the Network tab.
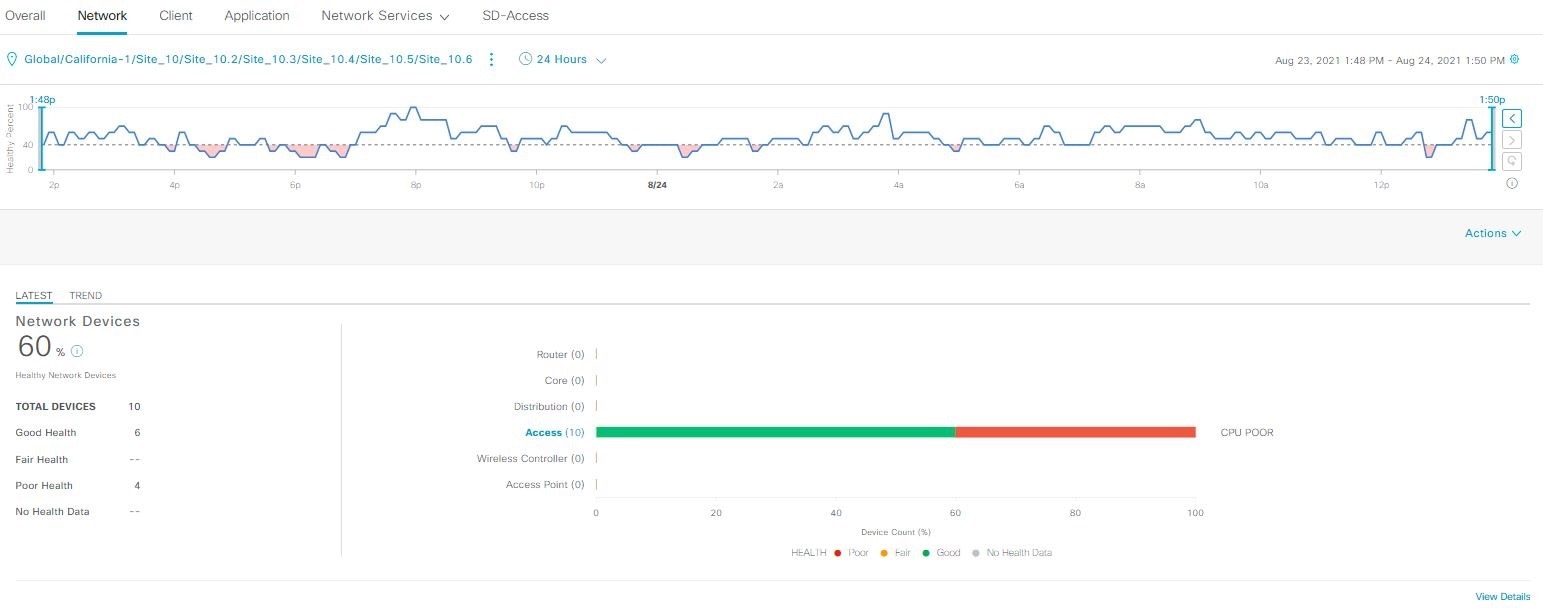
The Network health dashboard appears.
Figure 1. Network health dashboard
Step 3
Click the location option () in the top menu bar to select the site, building, or floor from the Site hierarchy.
Step 4
Click next to the location icon and select Site Details to view the Sites table.
The location pane has this functionality:
Location option
Item
Description
toggle button
List View
Click this toggle button to display the sites and buildings from your network in a list format.
Click the drop-down list for these options:
Hierarchical Site View: Sorts the list at a site level. From the Go to sites column, click for a site or building to display data only for that location on the Network dashboard.
Building View: Sorts the list at a building level. From the Go to sites column, click for a site or building to display data only for that location on the Network dashboard.
toggle button
Map View
Click this toggle button to display the health of all the network sites on a geographic location-oriented network health map.
By default, the network sites are color coded according to the severity of the problem.
Click the Hide Sites icon to hide the sites table.
Topology tool
Click this icon to open the Topology window, which has these views:
Geographical View: Click this toggle button to display your network in a geographical map.
Hover your cursor over a location to view the percentage of healthy devices.
Topology View: Click this toggle button to display a topology of how the components in the network are connected.
Hover your cursor over a device to display device information, such as device role, IP address, and software version. To obtain
a 360° view of the device, click View Details 360.
Step 5
Click the time range setting () in the top menu bar to specify the time range of data that appears on the dashboard.
From the drop-down menu, select the time range: 3 Hours, 24 Hours, or 7 Days.
Specify the Start Date and time, and the End Date and time.
Click Apply.
Step 6
Click the Actions drop-down list in the top menu bar for this functionality:
Export Dashboard: Enables you to export the network dashboard to PDF format. Click Export Dashboard to view the preview page and click Save.
Use the Network Health timeline for this functionality.
You can specify a more granular time range. You can click and drag the timeline boundary lines to specify the time range.
This sets the context for the custom charts on the dashboard.
You can use the arrow buttons on the right of the timeline to view data for up to 30 days.
Hover your cursor within the timeline chart to view the network device health score percentage at a specific time.
The dotted horizontal line represents the threshold for a healthy network, which by default is set to 40%.
To change the threshold value:
Hover your cursor over the information () icon.
In the tooltip, click the edit () icon.
In the Network Health Threshold slide-in pane, click and drag the blue line to set the threshold percentage value.
Click Save.
Note
Changing the custom threshold affects when the Network Device Summary Health Score is displayed as red. The custom threshold
does not change the number of healthy or unhealthy devices.
Note
Gaps in the timeline indicate that no health data was retrieved from the device. This situation can occur when a device is
in maintenance mode.
Step 8
Use the Network Devices Health Summary dashlet for this functionality:
Network Devices health summary dashlet
Item
Description
Network Devices Health Summary area
Includes these tabs:
Latest: Displayed by default. The left pane provides the network health summary score and the total number of devices. The right
pane displays charts.
Network Health Summary Score: The Network Health Summary score is the percentage of healthy (good) devices in your overall network or selected site. See
Network Health score.
Total Devices: Provides the total number of network devices and the count of devices that have Good Health, Fair Health, Poor Health, and
No Health Data.
Charts: This color-coded snapshot-view chart shows the performance of each device category (Access, Core, Distribution, Router,
Wireless Controller, and Access Points) over the last 5 minutes.
Hover your cursor over a color to display the health score and the number of devices associated with that color.
If the chart shows a low health score (red or orange), the KPIs that contributed to the low health score are shown next to
the bar. Examples include link errors, high CPU, high memory, high noise, and low air quality.
You can also click a hyperlinked device category (Access, Core (including third party devices), Distribution, Router, Wireless Controller, and Access Point) to open a slide-in pane with additional details.
Trend: Click the Trend tab to display a trend chart. This color-coded trend chart shows the performance of devices over a time range. Hover your
cursor over the chart to display the total number of devices and their health over time.
The color in the charts represent the health of the network devices:
: Poor network devices. Health score range is 1 to 3.
: Fair network devices. Health score range is 4 to 7.
: Good network devices. Health score range is 8 to 10.
: No Health data (includes third party devices and devices in maintenance mode). Health score is 0.
View Details
Click View Details to open a slide-in pane with additional details. From the slide-in pane, you can click a color segment in the chart to refresh
the data in the table that is displayed below the chart.
Step 9
Use the AP dashlets to view this information:
Total APs up/down dashlet
Color-coded chart that provides this AP status information: number of APs that are connected to the network and the number
of APs that are not connected to the network.
The Latest tab provides a 5-minute snapshot view.
The Trend tab provides a trend view for the time range that you selected in the time range settings. For example, if the time range
is set to the last three hours, the trend tab displays three hours of data.
Click View Details to open a slide-in pane with additional details. From the slide-in pane, you can click a color segment in the chart to refresh
the data in the table that is displayed below the chart.
Top N APs by Client Count Dashlet
Chart that provides information about the APs that have the highest number of clients.
The Latest tab provides a 5-minute snapshot view.
The Trend tab provides a trend view for the time range that you selected in the time range settings. For example, if the time range
is set to the last three hours, the trend tab displays three hours of data.
Click View Details to open a slide-in pane with additional details. From the slide-in pane, you can click a color segment in the chart to refresh
the data in the table that is displayed below the chart.
Top N APs by High Interference Dashlet
Information about the APs that have high interference. You can select 2.4 GHz or 5 GHz.
The Latest tab provides a 5-minute snapshot view.
The Trend tab provides a trend view for the time range that you selected in the time range settings. For example, if the time range
is set to the last three hours, the trend tab displays three hours of data.
Click View Details to open a slide-in pane with additional details. From the slide-in pane, you can click a color segment in the chart to refresh
the data in the table that is displayed below the chart.
Step 10
Use the Network Devices dashlet for this functionality:
Network Devices dashlet
Item
Description
Type
Filter the table based on the device type with these options: All, Access, Core, Distribution, Router, WLC, and AP.
Note
When you filter the devices based on device type "Router", it displays the device(s) with device role “Border Routers".
For SDA Fabric Domain, filter the table based on the fabric type with these options: All, Fabric Control Plane, Fabric Border, Fabric Edge, Fabric WLC, Fabric AP, and Extended Node.
Overall Health
Filter the table based on the overall health score of the device with these options:
All
Poor: Devices with a health score range from 1 to 3.
Fair: Devices with a health score range from 4 to 7.
Good: Devices with a health score range from 8 to 10.
No Health: Devices with no health data.
Network Devices table
View device information for all the devices in the network or for a selected site in a table format.
Note
The Overall Health Score is the minimum subscore of these KPI metric health scores: System Health, Data Plane Connectivity,
and Control Plane Connectivity.
In the Overall Health Score column, hover your cursor over a health score. The Device Health score is displayed along with the health and percentage value of all of the KPI metrics. The Device Health score is the minimum subscore of the KPI metrics, depending on the type of device. For routers and switches, these are the
KPI metrics: System Resources (memory utilization and CPU utilization), Data Plane (uplink availability and link errors),
and Fabric (Control Plane Reachability). The Fabric Domain Name, Fabric Name and Fabric Role columns display the fabric domain name, fabric name, and fabric role (Edge, Border, Map Server, and so on).
The Reachability column displays the status of the device (Reachable, Up, Unreachable, Rebooting, and so on).
Note
For third party devices, the device reachability status is either Reachable or Unreachable.
Device 360
Display a 360° view of a device by clicking the device name in the Device column.
Device 360 provides detailed information for troubleshooting device issues.
Note
When a site admin discovers a device that's not assigned to a site, the Device 360 window doesn't show data for the unassigned
device. However, a global admin can see data for unassigned devices in the Device 360 window.
Click Export to export the device information to a CSV file.
Customize the data you want displayed in the table:
Click .
A list of options is displayed.
Check the check boxes for the data you want displayed in the table.
Click Apply.
Step 11
Use the Network Devices Reachability dashlet to view this information:
Network Devices Reachability Dashlet
Color-coded chart shows the reachability status of routers, switches, and wireless controllers.
Reachable
Unreachable
The Latest tab provides a 5-minute snapshot view.
The Trend tab provides a trend view for the time range that you selected in the time range settings. For example, if the time range
is set to the last three hours, the trend tab displays three hours of data.
Click View Details to open a slide-in pane with additional details. From the slide-in pane, you can hover your cursor over the timeline slider
to view the reachability status of over a time period. The Reachability status count of top devices based on role and location
is displayed below the timeline slider as horizontal bar graphs.
You can select the data displayed as horizontal bars to filter the table based on the reachability status, device types, and
location with these options: All, Access, Core, Distribution, Router, and WLC.
Step 12
Use the WAN Link Utilization dashlet to view this information:
WAN link use dashlet
The bar chart shows the status of the WAN link use percentage only for the available WAN links.
Note
For a link to be considered a WAN link, you must manually assign the system-generated WAN tag to the required port. See "Assign
Tags to Ports" in the Manage Your Inventory chapter of the Catalyst Center User Guide.
The Latest tab provides a 10-minute snapshot view of Available and Not Available WAN links.
The Trend tab provides a trend view for the time range that you selected in the time range settings. For example, if the time range
is set to the last three hours, the trend tab displays three hours of data.
Click View Details to open a slide-in pane with additional details. From the slide-in pane, you can select an element on the chart to view more
detailed data.
You can select the data displayed as horizontal bars below the timeline slider to filter the table based on top locations,
device types, and location.
Step 13
Use the WAN Link Availability dashlet to view this information:
WAN link availability dashlet
Color-coded chart displays the information on the available WAN links in your network.
The Latest tab provides the percentage of WAN links utilized.
The Trend tab provides a trend view for the time range that you selected in the time range settings. For example, if the time range
is set to the last three hours, the trend tab displays three hours of data.
Click View Details to open a slide-in pane with additional details. From the slide-in pane, you can select an element on the chart to view more
detailed data.
You can select the data displayed as horizontal bars below the timeline slider to filter the table based on top locations
(link count) and device types (link count).
Monitor and troubleshoot the health of a device
Use this procedure to view details about a specific device and determine if there are potential issues that must be addressed.
Procedure
Step 1
From the main menu, choose Assurance > Health.
The Overall health dashboard appears.
Step 2
Click the Network tab.
Step 3
In the Network health dashboard, do one of these tasks:
In the Network Devices dashlet, click a device name in the Device Name column.
In the Search field, enter the device name, IP address, or MAC address.
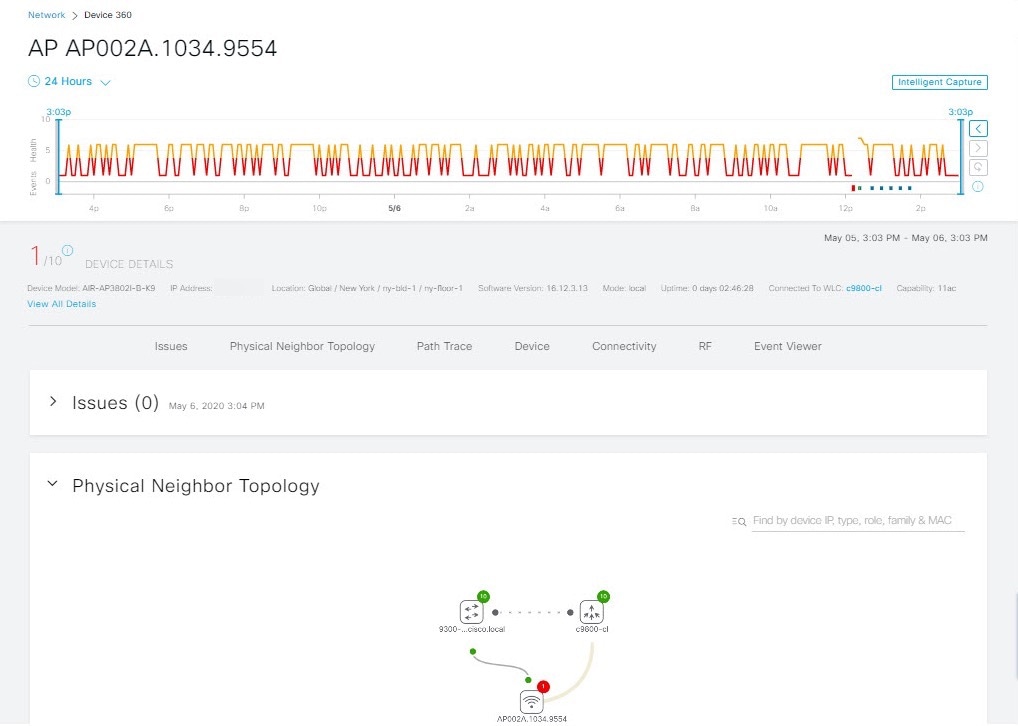
The Device 360 window displays a 360° view of the network device.
Note
The Map View appears by default.
Figure 2. Device 360 window
Note
You can click the View Device Details hyperlink next to the device name to cross-launch the device inventory window.
Step 4
Click the time range setting () to specify the time range of data that is displayed on the window:
From the drop-down menu, select a time range: 3 hours, 24 hours, or 7 days.
Specify the Start date and time and the End date and time.
Click Apply.
Step 5
Click Intelligent Capture to view, monitor, and troubleshoot captured onboarding and data packets for a specific network device and to determine if
there are potential issues that must be addressed. See View RF Statistics of an AP.
Note
Intelligent Capture is not supported for all the AP models. If Intelligent Capture is not displayed, verify that the AP is a supported model, and that the AP is assigned to a location on the Network Health dashboard.
Step 6
Use the timeline slider to view the health and events information about the network device over a period of time.
Note
Gaps in the timeline indicate that no health data was retrieved from the device. This situation can occur when a device is
in maintenance mode.
Under Maintenance banner is displayed for the access points that are under maintenance mode when you hover your cursor during
a specific time period.
The timeline slider displays this information:
Health: You can hover your cursor over the timeline slider to view the client's health score and KPIs for a 5-minute window. The
device's health score is the minimum of all KPI health scores.
When you double-click the graph, it displays the timeline slider for 1 hour.
Note
To display information for longer than 1 hour, manually move the timeline slider to the desired time range.
When you double-click the timeline, it displays the timeline slider for a 1-hour time period. The entire window is refreshed,
providing updates for that hour. Note that the timestamps next to each category (Issues, Connectivity, and so on) are also refreshed.
Events: Event data is displayed as color-coded vertical bars on the graph. Green vertical bars indicate successful events and red
vertical bars indicate events that failed.
Each vertical bar represents 5 minutes of time. Multiple significant events can be generated during each 5-minute window.
Hover your cursor over the vertical bar to get more information about the events.
Check the Telemetry Status check box below the timeline to view the horizontal bar in the timeline. To view the telemetry status:
Hover your cursor over the horizontal bar to view the network device telemetry status such as Good, Fair, or Poor in the tool
tip
Click the Telemetry Status in the tool tip to open a slide-in pane to view the summary of the telemetry status.
Step 7
You can view the device's health score in the Device Details area, below the timeline.
Note
Devices in maintenance mode are not included in the calculation of a device's health score.
The details for the device's health score are as follows:
Switch: The health score for switches is the minimum subscore of these parameters — memory utilization, CPU utilization, link errors,
link discards, uplink availability, and reachability to the control plane. In addition, for fabric devices, fabric health
is also included. For more information, see Switch Health score.
Note
Switches: Uplink availability is based on infrastructure links.
Cisco StackWise Virtual: Uplink availability is based on infrastructure links, Cisco StackWise Virtual links (SVL), and Dual Active Detection (DAD)
links. See About Cisco StackWise Virtual and its limitations.
Router: The health score for routers is the minimum subscore of these parameters — memory utilization, CPU utilization, link errors,
link discards, uplink availability, and reachability to the control plane. For more information, see Router Health score.
Note
Uplink availability is based on infrastructure links.
AP: The health score for APs is the minimum subscore of these parameters — memory utilization, CPU utilization, link errors,
radio utilization, interference, noise, and air quality. For more information, see AP Health score.
Wireless Controller: The health score for wireless controllers is the minimum subscore of these parameters — memory utilization, free timers, free memory buffers (MBufs), work queue element
(WQE) pools, packet pools, and link errors. For fabric wireless controllers, it includes fabric health. For more information,
see Wireless Controller Health score.
The color of the health score represents its severity. The health is measured on a scale of 1 to 10, where 10 is the best
score. A score of 0 indicates that data could not be obtained, or that the device is in maintenance mode.
: Critical issues. Health score range is 1 to 3.
: Warnings. Health score range is 4 to 7.
: No errors or warning. Health score range is 8 to 10.
: No data available (includes devices in maintenance mode). Health score is 0.
Step 8
Use the Device Details area, below the timeline, to view the most current information about the device, such as the building and floor where the
device is located, the device model, IP address, software version installed on the device, device role, HA status, the IP
address or MAC address, and the uptime.
Note
For Fabric Site, elements are displayed in the device details area—Fabric Role, Fabric Domain, System Resources, Data Plane, Virtual Network, Transits and Events.
For Cisco StackWise Virtual, two additional elements are displayed—Stack Status: StackWise Virtual and StackWise Virtual Domain.
For Cisco StackWise, an additional StackWise element is displayed, along with the number of switches in the stack, such as StackWise (2). A stack can contain a maximum of eight switches.
For Mesh APs, these details are displayed in the device details area—Mode, Mesh Role and RAP.
For PoE-capable devices, these elements are also displayed in the device details area—IEEE Class, Negotiated Power Level, and PoE Status.
Step 9
Click View All Details in the Device Details area to open a slide-in pane that displays additional attributes of a device, such as general information, network information,
and rack location. Depending on the device type, additional device-specific details may be included.
Step 10
Use the Issues category to view issues that must be addressed.
Note
When a device is in maintenance mode, it does not trigger any issues.
Issues are listed based on the timestamp. The most recent issue is listed first. Next to the issue name is a Note icon ( ). If you're an admin user, you can add, edit, and delete notes. Click the Note icon ( ) and then click Add. If you're any other type of user, you can only view note information.
Click an issue to open a slide-in pane to view the corresponding details, such as the description of the issue, impact, and
suggested actions.
From the slide-in pane, you can do these tasks:
To resolve an issue:
From the drop-down list, select Resolve.
Click Resolved Issues to view the issues that are resolved.
To ignore an issue:
From the drop-down list, select Ignore.
On the slider, set the number of hours to ignore the issue.
Click Confirm.
Click Ignored Issues to view the issues that have been ignored.
Step 11
Use the Physical Neighbor Topology category to view the topology of the device and how that device is connected to neighboring devices.
You can do these tasks:
Click a node to display a slide-in pane that displays information about the node.
Click a link between two devices to see the details about that specific link, such as the port/interface corresponding to
the link, admin status, port mode, and so on.
Hover your cursor over the link ends (dots) to see the status of the link.
Hover your cursor over a group of devices and click View Devices List to view the list of devices and their details.
In the Search field in the Onboarding area, you can search for a specific device. The specific node is selected, and the corresponding information about the device
is displayed.
Note
For AP 360, the 2-GHz and 5-GHz clients are displayed, and the dotted link lines going from these two clients are not clickable.
Also, the link line between AP to wireless controller and wireless controller to AP is not clickable.
For an SD-Access Fabric, the fabric groups are displayed with a fabric badge icon.
The Cisco StackWise Virtual and Cisco StackWise are displayed with a stack icon ().
Path Trace displays a switch icon if a Cisco StackWise Virtual or a Cisco StackWise is involved in that path.
Step 12
Use the Event View category to view an audit trail of events for the device. The Event Viewer table provides information about the issue such
as the reason code and the time stamp when the event occurred. Click an event to view details about that event in the right
pane.
APs: Lists scenarios and the sequence of subevents that led to each scenario. This allows you to pinpoint during which subevent
an issue occurred. Radio resource management (RRM) events, such as Transmit Power Change, RF Channel Change, and Radio Reset,
are displayed.
Switches and Routers: Displays all syslogs that have a severity of Critical and above (Emergency and Alert), events for any links that are up
or down, and events for devices that are reachable or unreachable. Syslogs that are less severe than Critical level (Error,
Warning, Notice, and Info) are also displayed.
Wireless Controllers: Lists wireless controller events. For Cisco AireOS devices, selected traps and syslogs are displayed. For Cisco IOS controllers,
selected syslogs and events are displayed.
Step 13
Use the Path Trace category to run a path trace.
Click Run New Path Trace to display a network topology between a specified source device and a destination device. The topology includes the path's
direction and the devices along the path, including their IP addresses. The display also shows the protocol of the devices
along the path (Switched, STP, ECMP, Routed, Trace Route) or other source type.
Use the Detail Information category to view the device's historical KPIs performing over a period of time.
Click these tabs to view the respective details:
Device info tab
Availability section displays information about the device CPU, memory, uptime, temperature, and so on.
HA Redundancy section displays information about the Redundancy Mode, Redundancy Unit, Local State, and Peer State for the Cisco Embedded
Wireless Controllers.
For WLC 360, STANDARD POWER SERVICE section displays information about device Connection Status, Last Successful Connection and so on.
Note
For third party devices, only the Uptime chart appears.
If there are multiple sensors for a wireless controller, the data reflects the latest maximum temperature of all sensors.
For network devices that are configured out of band, the uptime chart does not correlate correctly with the heath score and
other data. For example, the uptime chart for a 24-hour window shows that the device was down at 11:39 am and at 2:40 pm.
Then, if you select a 3-hour window, 11:00 am – 2:00 pm (in the timeline slider), the downtime is not displayed. This issue
occurs because Catalyst Center is not able to receive the sys uptime information from the device. To work around this issue, synchronize the configuration
between the device and Catalyst Center.
Connectivity tab
Displays information about the health of a device's connection with the network. This tab is available for APs.
The Connectivity tab contains radio-specific KPIs, such as Radio 0, Radio 1, and Radio 2. Click the appropriate radio to view
information such as Current Channel, Extended Channel(s), RF Profile, Band, Mode, and Current Channel Width. You can also
view charts for Traffic, Client Count, and so on.
Traffic: The traffic (in Mbps) for radios is displayed. The Rx (receiver) data packets and Tx (transmitter) data packets (in bytes)
are shown as color-coded lines on the chart.
Hover your cursor over a time instance on the graph to view the amount of traffic (Rx or Tx) sent or received for a particular
day and time.
Client Count: The number of clients for radios is displayed. The client count is shown as color-coded lines on the chart.
Hover your cursor over a time instance on the graph to view the number of clients connected to an AP for a particular day
and time.
Link Error: To display information about interfaces, check the check boxes next to the interfaces on the right of the chart. Based on
the interfaces you select, the error percentage for each interface is displayed as color-coded lines on the chart.
Hover your cursor over a time instance on the graph to view the error percentage for a particular day and time. You can select
a maximum of five interfaces.
Ethernet Interface KPI: The Ethernet interface KPIs contain interfaces such as GigabitEthernet0 and GigabitEthernet1. Click the appropriate interface
to display the charts for Utilization, Error, and Rate. You can also view the total and average values for the KPIs aggregated
for a time range selected on the top of AP 360.
Note
A Connected Switch banner is displayed for interfaces connected with switches.
Top Clients with Tx Drops per SSID: Displays the top 5 clients with packet drop count per selected SSID. This chart is available only for clients connected
to Cisco 9800 wireless controllers starting from 17.12 version.
Retries: The connection retries for radios are displayed in the retries chart.
Note
Only infrastructure links are considered for link errors. Infrastructure links are topological links connecting Catalyst Center-managed network devices, such as switches, routers, wireless controllers, and APs.
Fabric Site Tab
This tab is available for SD-Access fabric.
Fabric KPIs are grouped under different categories: Fabric Site Connectivity, Fabric Infrastructure, and Fabric Control Plane. You can filter the categories to view the respective KPIs. Based on the KPI selection, you can view the table displayed
with reachability information, such as the destination, IP address, and type. Check the check box next to destination to view
the control plane reachability status, LISP, and Pub/Sub session status charts.
Note
The uplink status chart shows data only if the Fabric Underlay Automation is used to provision the fabric.
Interfaces tab
Contains information about the selected interface, such as the name, description, operational status, and link speed.
Use the PORT TYPE tabs to display information about a specific port type. The tabs that are displayed depend on the type of
device selected:
Switches and Routers: Displays All, Access, Auto, Routed, and Trunk port types.
Cisco StackWise Virtual: Displays All, Access, Auto, Routed, TrunkSVL, and DAD port types.
Cisco StackWise: Displays All, Access, Auto, Routed, Trunk, and StackWisePort port types.
Wireless Controller: Displays All, Ethernet, and Virtual port types.
The table contains sortable columns. However, if you try to sort a column with a new parameter, the expanded interface list
collapses.
Note
For the Link Speed data column, the speed capacity of the interface or physical port is displayed. If the port has negotiated to a certain speed,
that negotiated speed is displayed.
To display the operational status of the interfaces for a particular day and time in a chart format, check the check boxes
next to the interfaces. You can select a maximum of five interfaces. The first interface in the table is selected by default.
The Interface Availability, Utilization, Error, and Link Discard charts are displayed below the table.
Note
For wireless controllers, link discard information is not provided in a separate chart. It is provided, along with other data,
in a Traffic Summary table. Data in the Traffic Summary table is shown only for the physical and Ethernet interfaces of a wireless controller.
The Tx Utilization and Rx Utilization chart values are populated in Percentage and Rate (bps). You can toggle between the Percentage and Rate to view the utilization values.
PoE tab
This tab is available for PoE-capable switches and APs.
Displays the device's Power over Ethernet (PoE) telemetry.
Switches
The POWER SUMMARY section displays the switch's overall PoE telemetry:
Power Budget: The overall power that the switch allocates for use with PoE-capable devices.
Used Power: The power being supplied by the switch to PoE-capable devices.
Remaining Power: The unused power available for use by PoE-capable devices.
Power Usage: The percentage of power being supplied by the switch to PoE-capable devices. This value is equal to the value of the Used Power divided by the value of the Power Budget.
The Power Stack section lists the power stack devices connected to PoE, such as Power Stack Name, Stack Mode, Stack Topology, Allocated Power,
Consumed Power, Remaining Power, and so on.
The Module Power Details section lists the components in the switch that supply power for PoE.
The PoE Interfaces section lists the PoE-capable devices connected to the switch's interfaces. At the top of the section is a count of interfaces
that are currently off.
You can customize the table by doing these tasks:
Use the POE CONFIG, ADMIN STATUS, and POE OPER STATUS (SIGNAL PAIR) filters above the table to filter the interfaces.
Use the search bar to perform searches for specific interfaces, PoE-capable devices, or any other values.
Click to open a menu where you can add and remove columns for specific data types.
APs
The Detail Information section displays the AP's PoE telemetry: IEEE PD Class, Power Level, PoE Admin Status, PoE Oper Status, PoE Policing Status,
Switch Name, Interface Name, Allocated Power, Consumed Power, Max Power Drawn, PoE Priority, PoE Configuration, and Perpetual
PoE.
The Power Distribution section displays a trend chart of the power distribution (allocated and consumed power) for the selected time range.
StackWise Tab
This tab is available for Cisco StackWise.
Displays information about the Cisco StackWise, such as the serial number, product ID, MAC address, role, state, priority,
and the neighboring switch number.
StackWise Virtual Tab
This tab is available for Cisco StackWise Virtual.
Displays information about the Cisco StackWise Virtual, such as the serial number, product ID, MAC address, role, state, priority,
uptime, and port numbers.
RF Tab
This tab is available for APs and wireless clients.
The RF tab contains radio-specific KPIs, such as Radio 0, Radio 1, and Radio 2. Click the appropriate radio tab to display
charts for radio channel utilization, traffic utilization, interference, noise, air quality, air-time efficiency, wireless
latency by client distribution, Tx power, Top Clients with Tx drops per SSID, channel information, and so on.
RF Tab Limitation
When an AP with three radios (for example, a Cisco Catalyst 9130 AP) connects to a wireless controller running 17.2 or later,
the device supports all three radios, and three radios (Radio 0, Radio 1, and Radio 2) are displayed under the RF tab.
When that same AP connects to a wireless controller running version 17.1 older, the device supports two radios, and two radios
(Radio 0 and Radio 1) are displayed under the RF tab.
However, if an AP moves from a wireless controller running a newer version to one running an older version (17.2+ > 17.1),
the RF tab continues to display the three radios (Radio 0, Radio 1, and Radio 2) that were initially detected.
For AP 5-GHz radios, a DFS tab provides information about Dynamic Frequency Selection (DFS) radar events.
For AP 360, under RF tab:
Radio 2 (6GHz band), STANDARD POWER MODE section provides information about Automated Frequency Coordination (AFC) integration that includes AFC status, Last Response Time, Expiration, and AFC defined location details such as location type,
lat/long, and so on.
Neighbors and Rogues section contains Band (2-GHz and 5-GHz radio frequencies), Type (All, Neighbor, Rogue), and RSSI Range (0 to -100 dBm) filters. Depending on the filter selection, the AP table is refreshed.
AP table includes the details, such as the Identifier, Radio, RSSI (dBm), Channel, Type, and SSID of the AP. Use the search
bar to find AP devices, radios, or any other values. Click to open a menu where you can use Edit Table Column to enable or disable specific columns. Click Export to export the table data to a CSV file.
Click the KPI drop-down list and check the check boxes next to the charts that you want to display. The charts provide various information,
such as Throughput, Client Count, Channel Utilization, Top SSIDs by Client/Packet Count, and so on. Selected charts are displayed
in the RF tab.
Depending on the filter selection, the Wi-Fi analyzer graph is displayed below the table. The Wi-Fi graph summarizes the total
and average values for the KPIs aggregated for a time range selected on the top of the AP 360 timeline slider.
Check the check boxes next to the APs to view the Wi-Fi analyzer graph for the specific AP. Hover your cursor over the chart
to view details.
Click the Chart Setting icon to enable or disable the Access Point Label, which is shown in the graph for each AP.
Virtual Network Tab
This tab is available for SD-Access fabric.
The KPIs are grouped under the VN Services and Fabric Control plane categories. You can select the category to view the Dynamic Default Border, Remote Internet Availability, Multicast (external RP), and Pub-Sub Session Status KPIs. You can filter the categories to display the table with reachability information, such as the destination, IP address,
and type. Check the check box next to destination to view the status, such as control plane reachability status, LISP, and
Pub/Sub session status charts.
Transits and Peers Network Tab
This tab is available for SD-Access fabric.
The Transits and Peers Network tab contains these Transit Site Control Plane KPIs: BGP Session from Border to Transit Control Plane, LISP Session from Border to Transit Site Control Plane, and Pub-Sub Session from Border to Transit Site Control Plane. Check the appropriate KPI check box to display the charts and table with reachability information, such as the destination,
IP address, and type.
Mesh Tab
This tab is available for Mesh APs.
The Mesh tab shows a device's mesh role, mesh profile, downstream MAPs, mesh backhaul channel, hops to RAP, bridge group name, and
backhaul interface.
It also provides these radio-specific KPIs: Current Channel, Extended Channel(s), Mode, RF Profile, Band, Tx Power, Clean Air Status, Admin State, and Current Channel Width.
When you use the time slider to display KPI data for the last 3 hours, 24 hours, or 7 days, note that:
The 7-day time slider uses a 60-minute window. It reports data based on the start time of that 60-minute window and returns
the latest data within that 60-minute interval.
The 3-hour and 24-hour time sliders use a 10-minute window. They report data based on the start time of that 10-minute window
and return the latest data within that 10-minute interval.
Step 16
To compare the health of AP radios across the floor in a building, click the toggle button in the top-right corner to switch between Detail View and Map and Comparison View.
Map and Comparison View displays a floor map with the AP radios placed on it.
Step 17
From the View Floor drop-down list, select the floor on which you want to compare the AP radios.
Hover your cursor over the AP icon on the floor map to view the device details of an AP radio, such as MAC Address, Model, Mode, and Issue Count.
Step 18
Click Compare AP Radios to compare the AP radios on the floor map.
The Map View appears by default, showing the last 5 minutes of AP radio data.
Step 19
Click the AP icon on the floor map.
A dialog box appears to select or deselect the radios for comparison.
Step 20
Check the check boxes next to the list of radios that you want to compare on a floor.
Note
By default, Catalyst Center selects the current AP for comparison only if the first radio of the respective AP is in monitor mode.
Local, Remote, and Hybrid modes are the only AP radio modes enabled for comparison.
You can select up to five AP radios at a time for comparison.
Step 21
Use AP Radio Comparison to view the list of AP radios selected for comparison.
You can compare Radio, IP Address, Model, Uptime, Connected to WLC, and Floor.
Step 22
Use Comparative Metrics to view the comparative metrics for the selected KPIs.
Step 23
From the Select KPI drop-down list, select the KPIs for which you want to see the comparative matrices.
You can select from these KPIs:
Channel Information
Throughput (Rx Rate)
Radio Retries
Interference
Air Quality
Management Frames
Tx Errors
Tx Power
Traffic Utilization
Tx Traffic Utilization
Throughput (Tx Rate)
Connected Client Count
Channel Utilization
Noise
Wireless Latency
Data Frames
Rx Errors
Multicast Counter
Rx Traffic Utilization
Step 24
Click the toggle button to switch between Map View and Table View.
The Access Point Radios table view lists the AP radios.
Step 25
Check the check box next to the AP radios that you want to compare on a floor map.
Step 26
To remove all radios from the comparison in the AP Radio Comparison area, click Clear Selection.
Step 27
Click Exit Comparison to exit.
About Cisco StackWise Virtual and its limitations
Cisco StackWise Virtual is a network system visualization technology that allows two physical switches to operate as a single
logical virtual switch using a 40-G or 10-G Ethernet connection.
Supported devices for StackWise Virtual
This table lists the Cisco Catalyst switches that support StackWise Virtual:
Device
Minimum Supported IOS-XE Software Version
Cisco Catalyst 9300 Series Switches
16.11+
Cisco Catalyst 9400 Series Switches
16.11+
Cisco Catalyst 9500 Series Switches
16.11+
StackWise Virtual Limitations
Cisco StackWise Virtual has these known limitations:
After you have configured Cisco StackWise Virtual, the second switch still appears in the inventory, and stops responding
because it does not have its own IP address. As a workaround, do these steps:
After StackWise Virtual is discovered, one switch plays the active role, while the other a standby role. Both switches in
the stack get associated with one primary management IP address.
After you remove Cisco StackWise Virtual, the two switches are independent. They both have the same IP address and operate
in Dual Active Detection (DAD) state. As a workaround, do these steps:
Configure a different IP address on the second switch.
The Cisco StackWise technology provides an innovative new method for collectively utilizing the capabilities of a stack of
switches. Individual switches intelligently join to create a single switching unit with a 32-Gbps switching backplane. Configuration
and routing information is shared by every switch in the stack, creating a single switching unit.
Supported devices for Cisco StackWise
These devices support Cisco StackWise:
Cisco Catalyst 3650 Series Switches
Cisco Catalyst 3850 Series Switches
Cisco Catalyst 9300 Series Switches
Cisco StackWise limitations
Cisco StackWise has these known limitations:
Ring status is not displayed in the Device 360 header.
Link Speed information is not provided in the. Detail Information > Interfaces tab.
Configure health score settings for network devices
Use this procedure to configure the health score settings for network devices. You can customize the health score calculation
for network devices by changing the KPI thresholds and specifying the KPIs that are included for the calculation.
Procedure
Step 1
From the main menu, choose Assurance > Manage > Health Score Settings.
The Health Score window appears.
Step 2
Click the tab of the network device category to customize its health score calculation settings.
The tab displays the KPIs that affect the network device type's health score calculation.
Step 3
From the KPI Name column, click the KPI name link.
The slide-in pane for the KPI appears.
Step 4
Configure the KPI health score settings:
If the KPI threshold is quantitative, you can customize the threshold value for what is considered a good health score.
To sync or unsync the common KPI threshold between the health and issues settings, use the Synced toggle button. The sync
works vice versa when it is synced from health or issue settings page.
To remove the KPI from the health score calculation, uncheck the Included in Device health Score check box.
Note
A network device's health score is the lowest score from all its included KPI scores.
Restriction
At least one KPI must be included for the health score calculation.
Attention
When viewing the KPI health scores for a network device, excluded KPIs display a NA instead of a health score.
To restore the default settings, hover your cursor over View Default Setting and click Use Default.
Step 5
Click Apply.
A confirmation dialog box appears.
Enable SNMP Collector metrics for fabric devices
For the health score to populate correctly for fabric devices, you must enable the SNMP Collector metrics.
Procedure
Step 1
From the main menu, choose System > Data Platform.
Step 2
Click Collectors.
A list of collectors appears.
Step 3
Click COLLECTOR-SNMP.
The COLLECTOR-SNMP window opens.
Step 4
Click + Add.
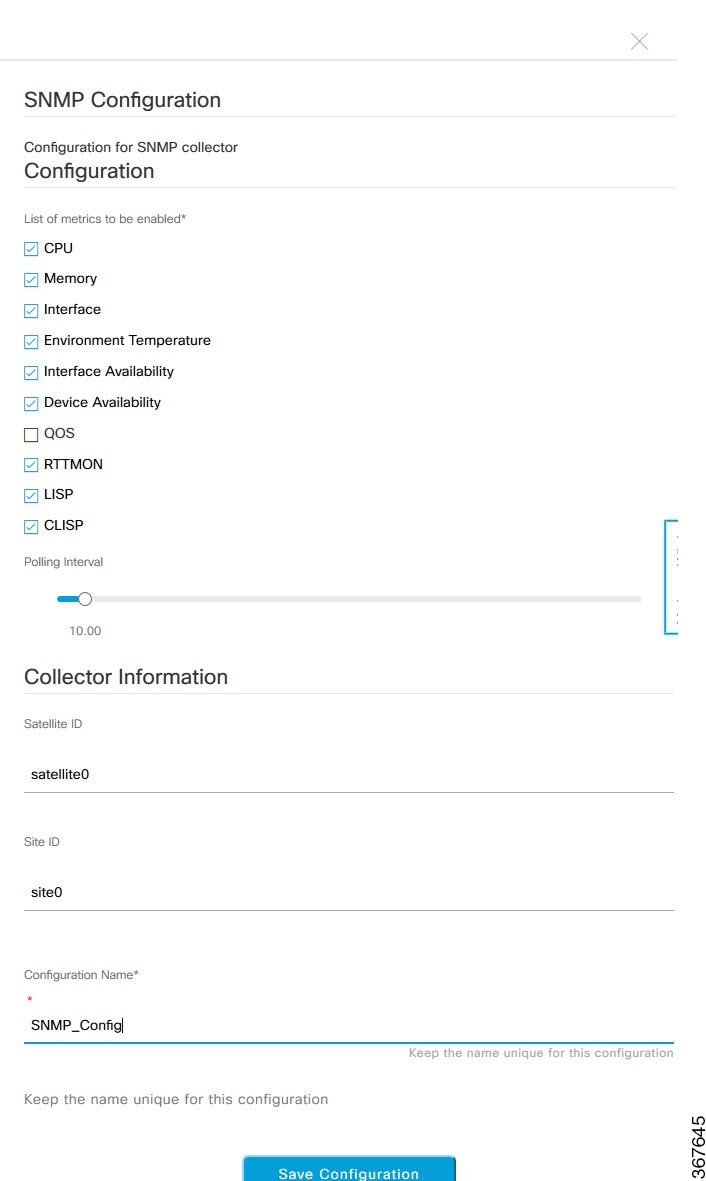
The SNMP Configuration dialog box opens.
Step 5
Check the check boxes adjacent to all the metrics except QOS.
Figure 3. SNMP Configuration
Step 6
In the Configuration Name field, enter a unique name for the SNMP configuration.
Step 7
Click Save Configuration.
Understand network health score and KPI metrics
This section provides information about how the network health scores and KPI metrics are computed.
Network Health score
The Network Health score is a percentage of the number of healthy network devices (a health score from 8 to 10) divided by
the total number of network devices (excluding devices in maintenance mode). The score is calculated every 5 minutes.
For example:
90% (health score) = 90 (network devices with health score from 8 to 10) ÷ 100 (total number of network devices - devices in maintenance mode)
Device Category Health score
The Device Category Health score (Access, Core, Distribution, Router, Wireless) is the percentage of the number of healthy
network devices (a health score from 8 to 10) in a target category, divided by the total number of network devices in that
category (excluding devices in maintenance mode). The score is calculated every 5 minutes.
For example:
90% (health score) = 90 (network devices in a target category with health score from 8 to 10) ÷ 100 (network devices in that
category - devices in maintenance mode)
Individual Device Health score
The Individual Device Health score is the minimum score of these KPI metric health scores: System Health, Data Plane Connectivity,
and Control Plane Connectivity. The KPI metric score is based on the threshold that is defined per KPI.
Device Health Score = MIN (System Health, Data Plane Connectivity, Control Plane Connectivity)
Depending on the type of device, the metrics vary.
System health
Device type
Description
Switch (Access and Distribution)
Includes system-monitoring metrics, such as CPU utilization and memory utilization.
Wireless
Includes these system-monitoring metrics:
For wireless controllers, it includes memory utilization, free timers, and free Mbufs.
For APs, it includes CPU utilization and memory utilization.
Router
Includes system-monitoring metrics, such as CPU utilization and memory utilization.
Fabric
Includes system-monitoring metrics, such as CPU utilization and memory utilization.
Data plane connectivity
Device type
Description
Switch (Access and Distribution)
Includes metrics, such as link errors and link status.
For switches, the Inter-device Link Availability metric counts physical stack ports, network device-connected links, and fabric
edge-facing port channels.
Wireless
Includes these metrics:
For wireless controllers, it includes metrics like WQE pool, packet pools, and link errors.
For AP, it includes RF metrics like interface, noise, air quality, and radio utilization.
Router
Includes metrics, such as link errors.
Control plane connectivity
Device type
Description
Wireless
Includes these KPIs:
For wireless controllers, it includes connectivity to the Control Plane node servers.
For fabric devices, it includes metrics, such as connectivity to the Control Plane node.
Switch Health score
The Switch Health score is the minimum subscore of these parameters:
Note
Devices in maintenance mode are not included in the calculation of a device's health score.
Parameter
Score calculation
CPU Utilization
If CPU utilization is 95 percent or less, the score is 10.
If CPU utilization is more than 95 percent, the score is 1.
Memory Utilization
If memory utilization is 95 percent or less, the score is 10.
If memory utilization is more than 95 percent, the score is 1.
Link Errors (Rx and Tx)
Only infrastructure links are considered for link errors. Infrastructure links are topological links connecting Catalyst Center-managed network devices, such as switches, routers, wireless controllers, and APs.
If a physical infrastructure interface has errors, the score is 8. If all links are down, the score is 1. Otherwise, the score
is 10.
Link Discards
Only infrastructure links are considered for link discards. Infrastructure links are topological links connecting Catalyst Center-managed network devices, such as switches, routers, wireless controllers, and APs.
If a physical infra link has packet drops (discards), the score is 8. If all links encounter discards, the score is 1. Otherwise,
the score is 10.
Link Status
Only infrastructure links are considered for link status UP/DOWN. Infrastructure links are topological links connecting Catalyst Center-managed network devices, such as switches, routers, wireless controllers, and APs.
If a physical infrastructure interface is down, the score is 8. If all interfaces are down, the score is 1. Otherwise, the
score is 10.
Connection to Control Plane Node—Fabric Devices Only (Edge and Border)
If the Control Plane node is reachable, the score is 10.
If the Control Plane node is unreachable, the score is 1.
Note
If there is more than one Control Plane node in a fabric network, and all the Control Plane nodes are reachable, the score
is 10; otherwise, the score is 1.
The Router Health score is the minimum subscore of these parameters:
Note
Devices in maintenance mode are not included in the calculation of a device's health score.
Parameter
Score calculation
CPU Utilization
If CPU utilization is 95 percent or less, the score is 10.
If CPU utilization is more than 95 percent, the score is 1.
Memory Utilization
If memory utilization is 95 percent or less, the score is 10.
If memory utilization is more than 95 percent, the score is 1.
WAN Connectivity
If the WAN connectivity is down, the score is 1.
If the WAN connectivity is up, the score is 10.
Link Errors
Only infrastructure links are considered for link errors. Infrastructure links are topological links connecting Catalyst Center-managed network devices, such as switches, routers, wireless controllers, and APs.
If a physical infrastructure interface has errors, the score is 8. If all links are down, the score is 1. Otherwise, the score
is 10.
Link Discards
Only infrastructure links are considered for link discards. Infrastructure links are topological links connecting Catalyst Center-managed network devices, such as switches, routers, wireless controllers, and APs.
If a physical infra link has packet drops (discards), the score is 8. If all links encounter discards, the score is 1. Otherwise,
the score is 10.
AP Health score
The AP Health score is the minimum subscore of these parameters:
Note
Devices in maintenance mode are not included in the calculation of a device's health score.
Parameter
Score calculation
CPU Utilization
If CPU utilization is 90 percent or less, the score is 10.
If CPU utilization is more than 90 percent, the score is 1.
Memory Utilization
If memory utilization is less than 90 percent, the score is 10.
If available memory is 90 percent or more, the score is 1.
Radio Utilization Score
The score is calculated individually for each radio, and then averaged across all radios to obtain the overall utilization
score.
If radio utilization is less than 70 percent, the score is 10.
If radio utilization is 70 percent or more, the score is 1.
Interference Score
The score is calculated individually for each radio, and then averaged across all radios to obtain the overall interference
score.
For 2.4-GHz radio:
If interference is less than or equal to 50 percent, the score is 10.
If interference is more than 50 percent, the score is 1.
For 5-GHz radio or 6-GHz radio:
If interference is less than or equal to 20 percent, the score 10.
If interference is more than 20 percent, the score is 1.
RF Noise Score
The score is calculated individually for each radio, and then the averaged across all radios to obtain the overall noise score.
For 2.4-GHz radio:
If RF noise is less than -81 dBm, the score is 10.
If RF noise is -81 dBm or more, the score is 1.
For 5-GHz radio or 6-GHz radio:
If RF noise is less than -83 dBm, the score is 10.
If RF noise is -83 dBm or more, the score is 1.
Air Quality Score
The score is calculated individually for each radio, and then averaged across all radios to obtain the overall air quality
score.
For 2.4-GHz radio:
If air quality is 60 percent or more, the score is 10.
If air quality is less than 60 percent, the score is 1.
For 5-GHz radio or 6-GHz radio:
If air quality is 75 percent or more, the score is 10.
If air quality is less than 75 percent, the score is 1.
Link Error Score
The score is calculated individually for each Ethernet interface and then averaged across all Ethernet interfaces to obtain
the overall link error score.
If link errors are less than 1 percent, the score is 10.
If link errors are 1 percent or more, the score is 1.
Wireless Controller Health score
The Wireless Controller Health score is the minimum subscore of these parameters:
Note
Devices in maintenance mode are not included in the calculation of a device's health score.
Parameter
Score calculation
Memory Utilization
If memory utilization is less than 90 percent, the score is 10.
If the available memory is 90 percent or more, the score is 1.
Free Timer Score
If the number of free timers is 20 percent or more, the score is 10.
If the number of free timers is 20 percent or less, the score is 1.
Free Memory Buffers (MBufs)
If the number of free memory buffer is 20 percent or more, the score is 10.
If the number of free memory buffer is less than 20 percent, the score is 1.
Work Queue Element (WQE) Pool Score
If the wqe pool is greater than wqe pool threshold, the score is 10.
If the wqe pool is at the same level as or lower than the wqe pool threshold, the score is 1.
Packet Pools
If the packet pool is greater than the packet pool threshold, the score is 10.
If the packet pool is at the same level as or lower than the packet pool threshold, the score is 1.
Link Errors
If link errors are less than 1 percent, the score is 10.
If link errors are 1 percent or more, the score is 1.
Connection to Control Plane Node—Fabric Wireless Controllers Only
If the Control Plane node is reachable, the score is good.
If the Control Plane node is unreachable, the score is poor.
Note
If there is more than 1 Control Plane node in a fabric network, and all the Control Plane nodes are reachable, the score is
10; otherwise, the score is 1.
Effects of maintenance mode on network health scores and KPI metrics
When a network device (router, switch, wireless controller, or access point) is placed in maintenance mode, its clients are
also placed in maintenance mode. For example, when you place a Cisco Wireless Controller in maintenance mode, any APs associated with the wireless controller are also placed in maintenance mode. Catalyst Center treats all devices in maintenance mode the same, regardless of whether a device was placed in maintenance mode as an administrative
action or as a result of its association with a device.
Network health scores and KPI metrics do not include network devices that are in maintenance mode, because while a network
device is in maintenance mode, Catalyst Center does not do these tasks for the device:
Gather health data.
Collect interface statistics.
Trigger issues.
Include the device in calculating health scores, such as site health scores.
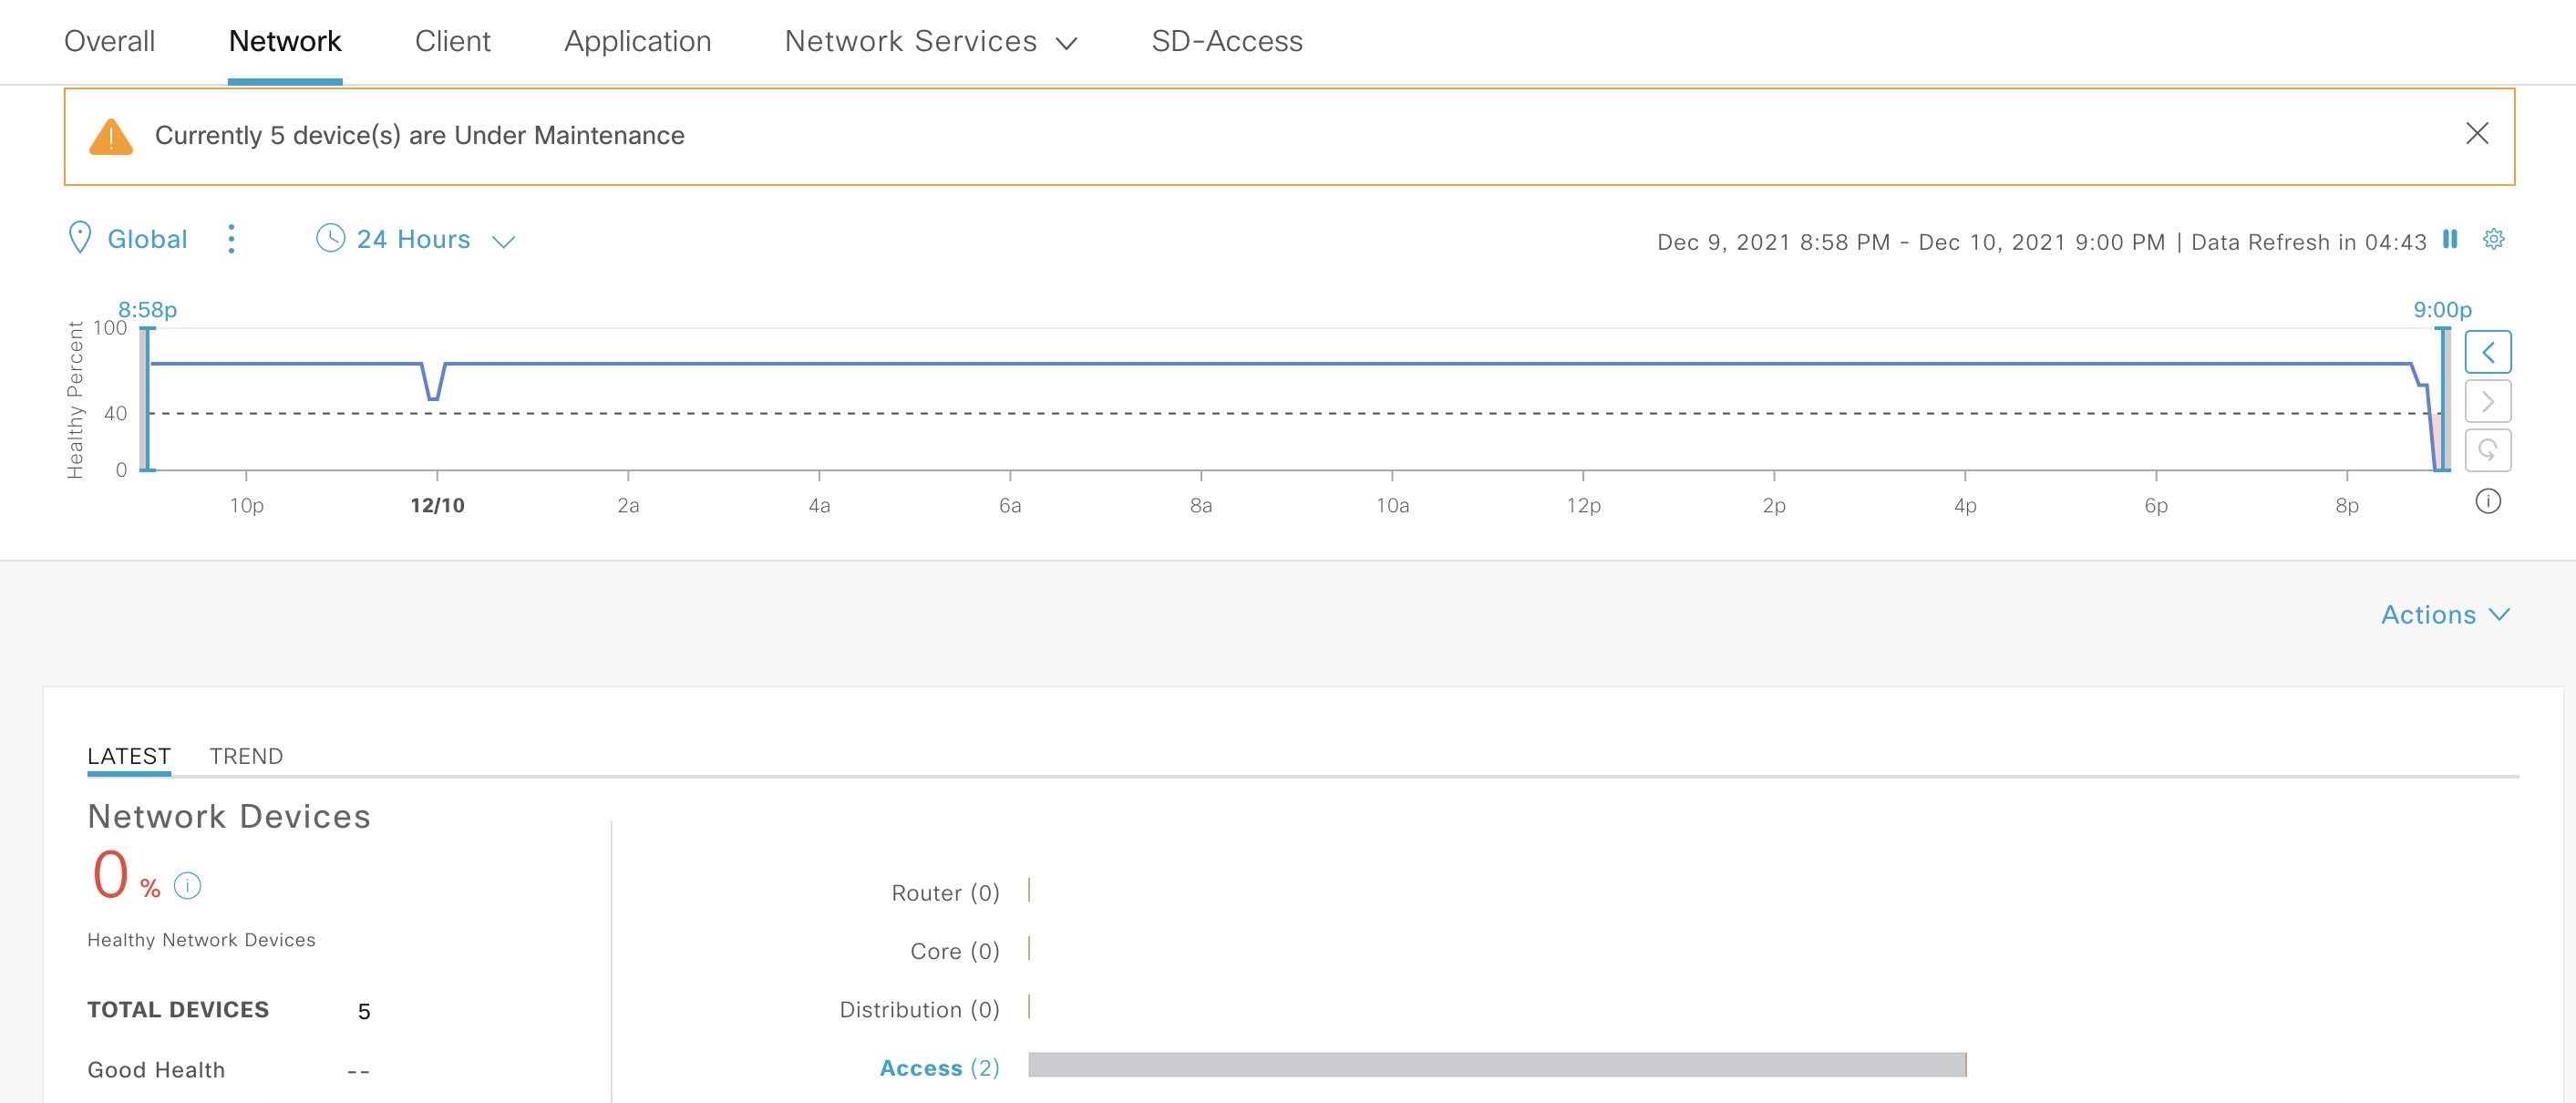
When you access network health scores and KPI metrics while a device is in maintenance mode on the Assurance > Health > Network window, Catalyst Center displays a banner indicating that a device is in maintenance mode. In addition, start and end times of the maintenance window
are indicated in the device 360 windows and logged as events in the system status log. The dashboards allow you to filter
by devices that are in maintenance mode.
Figure 4. Device 360 with maintenance banner
Catalyst Center continues to do these tasks for a device that is in maintenance mode:
Relevant events are still generated and can be displayed in the event viewer during maintenance mode.
Maintenance-related operations, such as image upgraded, bulk provisioning, and so on still trigger events.
The availability report in Assurance is not impacted.
Topology is not impacted.
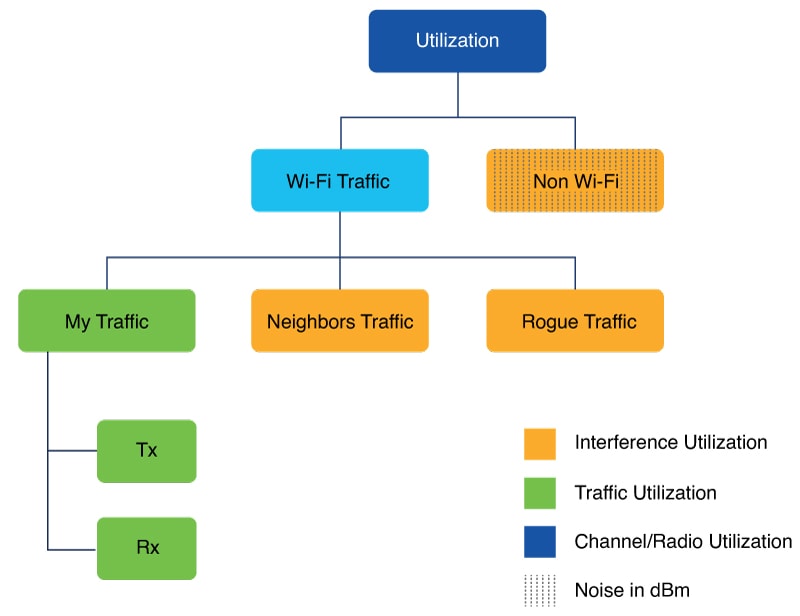
Understand RF calculations
Channel utilization, also known as radio utilization, is the total channel usage that Catalyst Center detects across Wi-Fi and non-Wi-Fi.
Catalyst Center derives the AP radio interference from this formula:

 ) in the top menu bar to select the site, building, or floor from the Site hierarchy.
 next to the location icon and select
  toggle button
 for a site or building to display data only for that location on the
  toggle button


 ) in the top menu bar to specify the time range of data that appears on the dashboard.
 ) icon.
 ) icon.
 : Poor network devices. Health score range is 1 to 3.
 : Fair network devices. Health score range is 4 to 7.
 : Good network devices. Health score range is 8 to 10.
 : No Health data (includes third party devices and devices in maintenance mode). Health score is 0.

 ) to specify the time range of data that is displayed on the window:
 ) and then click
  ).
).
 to open a menu where you can add and remove columns for specific data types.
 Feedback