Cisco Catalyst Assurance User Guide, Release 3.1.3
Bias-Free Language
The documentation set for this product strives to use bias-free language. For the purposes of this documentation set, bias-free is defined as language that does not imply discrimination based on age, disability, gender, racial identity, ethnic identity, sexual orientation, socioeconomic status, and intersectionality. Exceptions may be present in the documentation due to language that is hardcoded in the user interfaces of the product software, language used based on RFP documentation, or language that is used by a referenced third-party product. Learn more about how Cisco is using Inclusive Language.
Assurance doesn’t support remote LAN (RLAN) or RLAN clients. On the Client 360 window, data might be missing or inaccurate for RLAN
clients. On the AP 360 window, for APs with RLAN clients, the RLAN ports don’t show RLAN-specific information. It is important
to consider that RLAN clients on APs and wireless controllers continue to work normally, but there is no visibility for RLAN clients on Assurance windows. For more information, see “Remote LANs” in the Cisco Catalyst 9800 Series Wireless Controller Software Configuration Guide.
Workgroup bridge client support
Assurance doesn’t support workgroup bridge (WGB) clients. On the Client 360 window, data might be missing or inaccurate for WGB clients.
WGB itself is shown as a wireless client within Assurance and has a Client 360 window. It is important to note that WGB and WGB clients on APs and wireless controllers continue to work normally, but there is no visibility for WGB clients on Assurance windows. For more information, see “Workgroup Bridges” in the Cisco Catalyst 9800 Series Wireless Controller Software Configuration Guide.
Monitor and troubleshoot the health of all client devices
A client is an end device (computer, phone, and so on) that is connected to a network device (access point or switch). Catalyst Center supports both wired and wireless clients.
Assurance supports site-based, role-based access control (SRBAC), which limits a user's scope of access to certain network sites. You
must ensure you have access to the sites, wired and wireless clients while using the client health dashboard. For more information
on user roles and permissions, see Cisco Catalyst Center Administrator Guide
Use this procedure to get a global view of the health of all wired and wireless clients and to determine if there are potential
issues that must be addressed.
Assurance uses machine learning algorithms to extract behavioral patterns in the network and predict trends. These trends are displayed
as baselines in the Client Onboarding Time and Client Count Per SSID dashlets.
Note
The client health data might take up to an hour to populate if an HA failover has occurred.
Procedure
Step 1
From the main menu, choose Assurance > Health.
The Overall health dashboard appears.
Step 2
Click the Client tab.
The Client health dashboard appears.
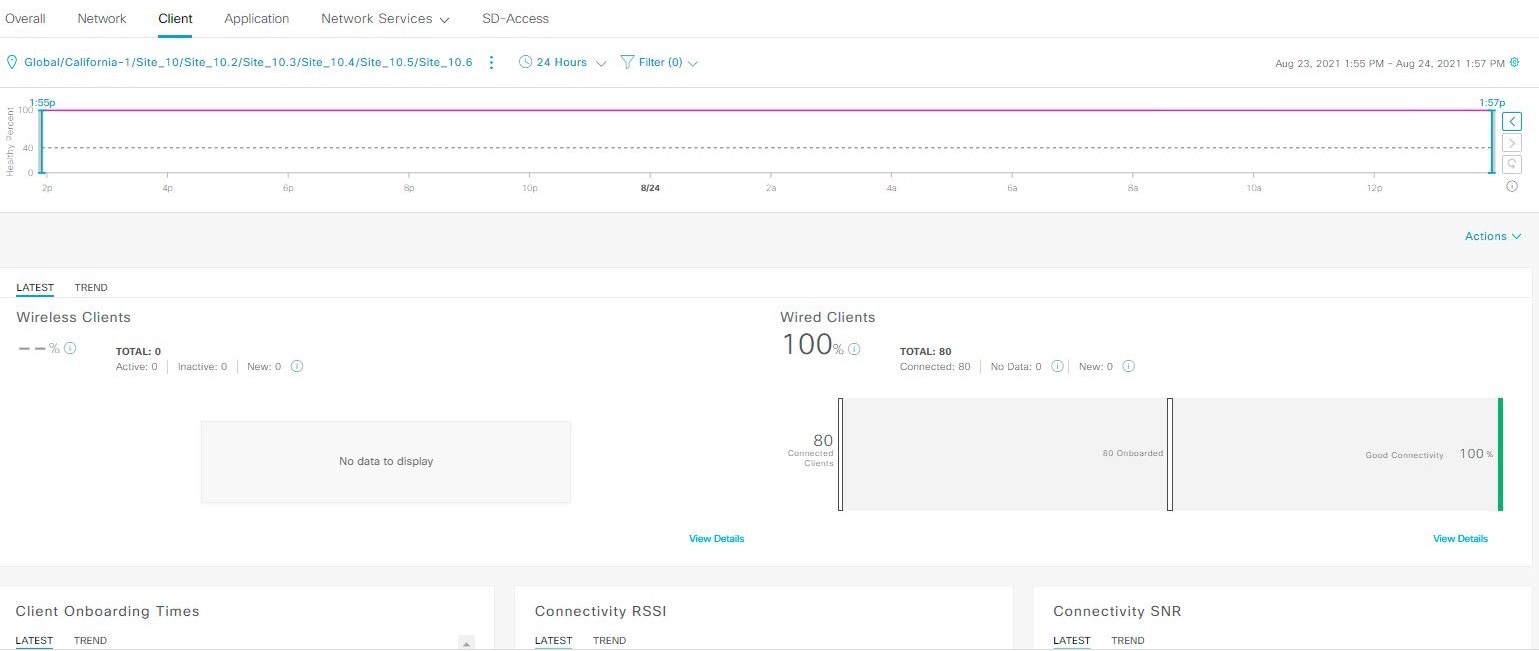
Figure 1. Client health dashboard
Step 3
Use the Client health dashboard top menu bar for this functionality:
Client health dashboard top menu bar
Item
Description
Location pane
Click to display these icons:
Click to select an area/site or building from the left hierarchy tree pane. You can also click down arrow from global to navigate
to its associated area, site, and building.
You cannot select a floor from the network hierarchy.
Click next to the location icon and select Site Details to view the Sites table.
Click to hide the Sites table.
: Click this toggle button and use the drop-down list to view the percentage of healthy clients in a table format for a site
or building. Click Apply for a location to only display the location's client information in the Client Health dashboard.
: Click this toggle button to display the health of all the client sites on a geographic location-oriented client health map.
By default, the client sites are color coded according to the severity of the problem.
The color of the health score represents its severity. The health is measured on a scale of 1 to 10, where 10 is the best
score. A score of 0 indicates that the client is inactive.
From the Go to sites column, click for a site or building to display data only for that location on the Client Health dashboard.
Time Range setting
Enables you to display data within a specified time range on the dashboard. Do these steps:
From the drop-down menu, select the length of the range: 3 Hours, 24 Hours, or 7 Days.
Specify the Start Date and time; and the End Date and time.
Click Apply.
Filter icon
Contains the SSID and Band options. Select the SSIDs and band frequency from the drop-down list by selecting the check boxes next to them, and then
click Apply. Depending on your selection, the information in the dashboard is refreshed.
Note
You can select multiple SSIDs. For example, if you select Class 1 and Class 2 SSIDs, the dashboard displays information for
the clients that are connected to Class 1 SSID and Class 2 SSID.
Actions drop-down list
Enables you to export the client dashboard to PDF format. Click Export Dashboard to view the preview page and click Save.
Use the Timeline Slider to view the healthy client percentage for a more granular time range.
Hover your cursor within the timeline to view the wireless and wired client health score percentage at a specific time.
You can click and drag the timeline boundary lines to specify the time range. This sets the context for client data that is
displayed in the dashboard dashlets.
You can use the arrow buttons on the right of the timeline to view data for up to 30 days.
The dotted horizontal line represents the threshold value for healthy clients, which by default is set to 40%.
To change the threshold value:
Hover your cursor over the information () icon.
In the tooltip, click the edit () icon.
In the Client Health Threshold slide-in pane, click and drag the blue line to set the threshold percentage value.
Click Save.
Note
Changing the custom threshold affects when the Client Summary Health Score is displayed as red. The custom threshold does
not change the number of healthy or unhealthy devices.
Step 5
Use the Client Health Summary dashlet for this functionality:
Client health summary dashlet
Item
Description
Client Health Summary area
Includes these tabs:
Latest: Displayed by default. Includes these options:
Wireless Clients and Wired Clients Health Summary Score: The Wireless and Wired Client Summary Health score is the percentage of clients that onboarded successfully and have good
connectivity. See Client Health score.
Total Devices: Provides the total number of clients and the count of active, inactive, and new clients. Cisco Catalyst Center defines active, inactive, and new clients based on their activity within a 5-minute health score calculation window, as follows:
Active: Clients who have successfully onboarded and are sending sufficient data to meet the data threshold, clients who have successfully
onboarded and then disconnected, clients attempting to onboard and fail, and clients attempting to onboard but were excluded.
Inactive: Clients who don't send sufficient data to meet the data threshold. After a user-idle timeout period expires, the wireless
controller deauthenticates inactive clients.
New: Clients who are in the process of onboarding. The health score for these clients is included in the next 5-minute calculation
window.
Charts: This snapshot-view chart provides the distribution of clients that passed or failed to onboard within the last 5 minutes.
Then, from the number of clients that onboarded successfully (passed), the chart provides the percentage of clients that have
good or fair connectivity.
Trend: Displays a trend chart that shows the health of clients over a time period.
For the clients that failed to onboard, the reason for the onboarding failure is provided. Examples include AAA, DHCP, and
Other.
The color in the charts represents the health of the client devices:
: Poor client devices. Health score range is 1 to 3.
: Fair client devices. Health score range is 4 to 7.
: Good client devices. Health score range is 8 to 10.
: Inactive client devices. Health score is 0.
View Details
Click View Details to open a slide-in pane with additional details.
For both wired and wireless clients, you can view the LATEST and TREND tabs.
LATEST tab: Displays a bar chart that summarizes the client health by onboarding activity.
TREND tab: Displays two charts for tracking the client health over time.
Radial bar chart: Displays the distribution of clients that failed to onboard and the reasons for these failures.
Line chart: Displays onboarding failures over time in 5-minute increments.
Note
If wired and wireless clients use Cisco ISE for AAA management and authentication fails, you can view the top onboarding AAA and Cisco ISE failure reasons in the TREND tab. The AAA failure information is from the wireless controller, and the Cisco ISE information is from Cisco ISE.
For wired clients, click the line chart and then click Top Authentication Failure Reasons to view the failure reason details.
For wireless clients, click AAA next to the radial bar chart to view the failure reason details.
In either tab for wireless or wired clients, you can:
Click a segment in a chart to view more details more about that segment.
Click a data type category displayed below the chart to filter the table data.
In the table, use the search bar to search for specific data.
In the table, click the device identifier or name to go the relevant Client 360 or Device 360 window.
Step 6
Use the KPI dashlets to view specific KPIs and metrics for the clients in your network. These tables describe the KPI dashlets.
Note
The chart data is updated every 5 minutes.
Client onboarding times dashlet
Item
Description
Client Onboarding Times chart
Distribution of all clients' attempts to onboard, in all the sites or a selected site, over time. This dashlet provides the
percentage of clients that took less than 10 seconds to successfully onboard. Client onboarding covers Association, Authentication,
Addressing, WebAuth, and DNS phases.
There are two types of charts:
Latest: Displayed by default. This snapshot-view chart provides the distribution of clients that passed or failed to onboard within
the last 5 minutes. Then, from the number of clients that onboarded successfully (passed), the chart provides the percentage
of clients that have good or fair connectivity.
Trend: Contains the Client Count and Baseline tabs. Click the Baseline tab to display the onboarding time baseline chart, which is generated through machine learning.
To view the baseline chart, you must select a site and SSID from the Filter options.
The chart details for the baseline charts are represented by different colors.
Green band: Predicted baseline value.
Solid blue line: Actual value.
For the clients that failed to onboard, the reason for the onboarding failure is provided. Examples include AAA, DHCP, and
Other.
View Details
Click View Details to open a slide-in pane with additional details:
The left pane contains the Overall, Association, Authentication and DHCP tabs. Click the tabs to populate the charts in the right pane.
The right pane contains Charts that have these tabs:
Latest: Contains the overall average onboarding time.
For Authentication and DHCP, the Latest tab contains a drop-down list to filter the data based on the Avg Latency Time, Avg
Authentication Time for Authentication, and Avg DHCP Time for DHCP.
Trend: Contains the Baseline tab, which allows you to view machine learning baseline charts.
Depending on the tab you select in the left pane, additional tabs display under Trend > Baseline. For example, the Client Count, Time Baseline, or Failure Baseline tabs appear for Association, Authentication, or DHCP data.
Note
Failure Baseline data is available only for the Global site.
Hover and move your cursor over the charts to view synchronized tooltips that display information at a selected point in time.
Click a color segment in the chart to view the options:
Data type categories by client count: Top Locations, Top Access Points, Top Host Device Types, Top SSIDs, Top Bands, and Top Host Operating Systems.
A table with detailed data of the clients in that segment.
Connectivity RSSI dashlet
Item
Description
Connectivity RSSI chart
Received Signal Strength Indication (RSSI) distribution for all clients, in all sites or a selected site. This dashlet provides
the percentage of RSSI measurements for all clients whose RSSI measurement is higher than the threshold value of -72 dBm.
View Details
Click View Details to open a slide-in pane with additional details. From the slide-in pane, you can click a color segment in the chart to view:
Data type categories by client count: Top Locations, Top Access Points, Top Host Device Types, Top SSIDs, Top Bands, and Top Host Operating Systems.
A table with detailed data of the clients in that segment.
Connectivity SNR dashlet
Item
Description
Connectivity SNR chart
Signal-to-Noise ratio (SNR) distribution of all clients, in all sites or a selected site. This dashlet provides the percentage
of SNR measurements for all clients whose SNR measurement is higher than the threshold value of 10 dB.
View Details
Click View Details to open a slide-in pane with additional details. From the slide-in pane, you can click a color segment in the chart to view:
Data type categories by client count: Top Locations, Top Access Points, Top Host Device Types, Top SSIDs, Top Bands, and Top Host Operating Systems.
A table with detailed data of the clients in that segment.
Client Roaming Times dashlet
Item
Description
Client Roaming Times chart
Distribution of the clients by roaming times and failures. This dashlet provides the percentage of clients with roaming times
less than 3000 ms.
View Details
Click View Details to open a slide-in pane with additional details. From the slide-in pane, you can click a color segment in the chart to view:
Data type categories by client count: Top Access Points, Top SSIDs, Top Host Device Types, Top Bands, Top Locations, and Top Host Operating Systems.
A table with detailed data of the clients in that segment.
Client Count per SSID dashlet
Item
Description
Client Count per SSID chart
Distribution of the number of clients per SSID, in all sites or a selected site, over time.
There are two types of charts:
Latest: Displayed by default. This snapshot-view chart provides the distribution of clients per SSID or selected site.
Trend: Contains Client Count and Baseline tabs. Click the Baseline tab to display the SSID baseline chart, which is generated through machine learning.
Hover and move your cursor over the charts to view synchronized tooltips that display information at a selected point in time.
Click a color segment in the chart to view this information:
Data type categories by client count: Top Locations, Top Access Points, Top Host Device Types, Top Bands, and Top Host Operating Systems.
A table with detailed data of the wireless clients in that segment.
Connectivity Physical Link dashlet
Item
Description
Connectivity Physical Link chart
Distribution of wired client device link state—the number of client devices that had their physical links up, down, and had
errors.
View Details
Click View Details to open a slide-in pane with additional details. From the slide-in pane, you can click a color segment in the chart to view:
Data type categories by client count: Top Locations, Top Switches, Top Host Device Types, and Top Host Operating Systems.
A table with detailed data of the clients in that segment.
Client Count per Band dashlet
Item
Description
Client Count per Band chart
Distribution of wireless clients connected to the 2.4-GHz band or 5-GHz band.
Hover your cursor over a segment to view the percentage and number of clients connected to a specific band.
View Details
Click View Details to open a slide-in pane with additional details. From the slide-in pane, you can click a color segment in the chart to view:
Data type categories by client count: Top Locations, Top Access Points, Top Host Device Types, Top SSIDs and Top Host Operating Systems.
A table with detailed data of the clients in that segment.
Client Data Rate dashlet
Item
Description
Client Data Rate chart
Distribution of a client's data rates.
Use the Client Protocol drop-down list to filter clients based on the client protocol they are using. Options are 802.11n/ac/ax and 802.11a/b/g.
View Details
Click View Details to open a slide-in pane with additional details. From the slide-in pane, you can click a color segment in the chart to view:
Data type categories by client count: Top Locations, Top Access Points, Top Host Device Types, Top SSIDs, Top Bands, and Top Host Operating Systems.
A table with detailed data of the clients in that segment.
Step 7
Use the Client Devices dashlet to view detailed information about the clients in your network. This dashlet provides this functionality:
Client Devices dashlet
Item
Description
Type
Filter the table based on client type. Options are Wired and Wireless clients.
Health
Filter the table based on the client health with these options:
All
Inactive: Client devices with a health score of 0.
Poor: Client devices with a health score range from 1 to 3.
Fair: Client devices with a health score range from 4 to 7.
Good: Client devices with a health score range from 8 to 10.
No Data: Client devices with no data.
Data
Filter the table based on data type with these options:
Onboarding Time >= 10 s: Onboarding time is greater than or equal to the 10-second threshold value.
Association >= 5 s: Association time is greater than or equal to the 5-second threshold value.
DHCP >= 5 s: DHCP time is greater than or equal to the 5-second threshold value.
Authentication >= 5 s: Authentication time is greater or equal to 5 seconds.
RSSI <= -72 dBm: RSSI is less than or equal to the -72-dBm threshold value.
SNR <= 9 dB: SNR is less than or equal to the 9-dB threshold value.
Client Device table
View detailed client device information in a table format. The client device table displays this information by default:
Identifier: Displays the client's user ID, hostname, or MAC address based on availability, in that order. For example, if the user ID
is not available, the hostname is displayed. If the user ID and hostname are not available, the MAC address is displayed.
The Identifier column also has specific icons that allow you to determine if the client device is wired or wireless. For wireless devices,
the icon includes a blue dot while the client is connecting and when the client is newly connected.
MAC Address: Displays the MAC address, which includes Device MAC and Randomized and Changing MAC Address (RCM). The Private MAC icon appears in front of the RCM. You can filter the table based on the type of MAC address, such as All, Device MAC, and
RCM.
IPv4 Address: Displays the client's IPv4 address based on availability.
Note
You can display the client's IPv6 address by checking the IPv6 Address check box in the menu.
Device Type: Displays the device type.
Health: Displays the average of the onboarding and connected scores. The Client Health score is calculated every 5 minutes.
Note
A score of -- indicates that the client has recently onboarded (new). New clients are clients that attempted to onboard after
the 5-minute health score calculation window started. The health score for these new clients is included in the next 5-minute
calculation window.
Trust Score: Displays the trust score for the endpoints connected to your network based on the AI Endpoint Analytics trust level.
Tracked: Displays client tracking status.
Last Seen
AP Name (for wireless clients only): Displays the name of the access point.
Switch (for wired clients only)
Port (for wired clients only)
Location: Displays the assigned location of the client.
Security Group (Tag Value): Displays the security group tag value for wired clients only.
Average Latency By Access Category: This includes Avg video, Avg voice, Avg best effort and Avg background latencies.
Link Speed (for wired clients only): Indicates the speed capacity of the interface or physical port. If the port has negotiated to a
certain speed, the negotiated speed is displayed.
Note
You can display the link speed by checking the Link Speed check box in the menu.
Tracked Clients
Click Tracked Clients to view the slide-in pane that displays a table containing the MAC Address, Last Detected, Tracking Duration, Description, and Randomized MACs.
Excluded Clients
Click Excluded Clients to view the slide-in pane that displays the client exclusion list containing the Excluded MAC address, Excluded Since, Impacted Wireless Controllers, and Description.
Display a 360° view of a client by clicking the MAC address or identifier of a client device.
Client 360 provides detailed information for troubleshooting client connectivity issues.
Customize the data you want displayed in the table:
Click .
Check the check boxes for the data you want displayed in the table.
Click Apply.
Export
Click Export to export the table data to a CSV file.
Note
The data from all available columns is included even if the column was not selected for the table. Filters applied to the
client table are applied to the exported data.
Configure tracked clients
You can track and monitor specific clients, showing when they get connected. You can set up notifications so that when a client
in the tracked list connects, you are notified.
Procedure
Step 1
From the main menu, choose Assurance > Health.
The Overall health dashboard appears.
Step 2
Click the Client tab.
Step 3
From the Client Devices dashlet, check the check box next to the clients that you want to track.
Step 4
From the Actions drop-down list, select Track Client.
Step 5
In the Tracked Clientsslide-in pane, to add clients to the tracking list, do these steps:
Click the toggle button to enable the client tracking.
Select the tracking duration from the available options.
To set the notification frequency, select On First Detection or On Every Detection and click Save.
Step 6
To stop tracking clients:
Check the check box next to the client that you want to stop the tracking.
Hover your cursor over Actions, select Stop Tracking Client, and click Ok.
Enable Tracking Notification
To enable the notification of client tracking, you must enable the "Clients detected connecting on network" event (with event
ID NETWORK-CLIENTS-4-370). For the steps to create an event notification, see the Cisco Catalyst Center User Guide > Build and Deploy Workflows chapter > Create an Event Notification section.
Configure excluded clients
Use this procedure to configure excluded clients for Cisco Wireless Controllers. Using the Excluded Clients option, you can configure these tasks:
Add clients to the exclusion list.
Edit the clients in the exclusion list.
Add the wireless controllers for which you want to exclude clients.
Delete clients from the exclusion list.
Procedure
Step 1
From the main menu, choose Assurance > Health.
The Overall health dashboard appears.
Step 2
Click the Client tab.
Step 3
From the Client Devices dashlet, click Excluded Clients.
Step 4
In the Excluded Clients slide-in pane, to add clients to the exclusion list, use one of these methods:
To select clients from the drop-down list, click Add and configure accordingly:
From the MAC Address drop-down list, select a MAC address. Alternatively, you can enter a valid MAC address in the search field and click the
plus icon () to add the MAC address.
In the Description for Exclusion field, enter a description.
(Optional) To add another MAC address, click the plus icon ().
Click Next.
Check the check box next to the wireless controller for which you want to exclude clients.
Click Save.
To import the list of clients in CSV format, click Import Client List (CSV) and follow these steps:
Click CSV Sample to download the sample CSV file.
Edit the sample CSV file to include the client information.
Drag and drop the CSV file into the file upload area. Alternatively, you can click Choose a file and navigate to where your CSV file is located, and then click Upload.
Click Next.
Check the check box next to the wireless controller for which you want to exclude clients.
Click Save.
Step 5
To edit the clients in the exclusion list:
Check the check box next to the excluded MAC addresses that you want to edit.
Hover your cursor over Actions and select Edit.
Edit the description and click Save.
Step 6
To add the wireless controllers for which you want to exclude clients:
Check the check box next to the excluded MAC addresses for which you want to add wireless controllers.
Hover your cursor over Actions and select Add WLC.
Check the check box next to the wireless controller for which you want to exclude clients.
Click Save.
Step 7
To delete clients from the exclusion list:
Check the check box next to the excluded MAC addresses that you want to delete.
Hover your cursor over Actions and select Delete.
Click Yes.
Monitor and troubleshoot the health of a client device
Using the Client 360 window, a network administrator can easily identify problems that clients experience. The information that is available provides
these insights about client issues:
What: Use the Summary category to quickly gain insights into what problem a client has experienced, whether it was an onboarding, roaming, or connectivity
issue.
When: Use the health timeline slider to identify when a problem occurred. If you know when a problem occurred, you might be able
to correlate it with configuration changes.
Why: View the events and KPIs that contributed to a problem.
Impact: Determine whether a problem is isolated to a single user or widespread among many users.
All these features make the IT organization more efficient in operating the network and providing a better experience to their
users.
Use this procedure to view details about a specific client device and to determine if there are potential issues that must
be addressed. Assurance supports site-based, role-based access control (SRBAC), which limits a user's scope of access to certain client 360. You
must ensure you have access to the sites, wired and wireless clients. in the client 360 window. For more information on user
roles and permissions, see Cisco Catalyst Center Administrator Guide
Note
As a best practice, add both Anchor and Foreign wireless controllers to Catalyst Center for complete visibility of guest anchor or L3 mobility client sessions.
If an HA failover occurs, the client health data might take up to an hour to populate.
Procedure
Step 1
From the main menu, choose Assurance > Health.
The Overall health dashboard appears.
Step 2
Click the Client tab.
The Client health dashboard appears.
Step 3
Do one of these tasks:
In the Client Devices table, click the hyperlinked identifier or the MAC address of the device.
In the Search field, enter one of these elements:
User ID (authenticated through Cisco ISE)
IP address
MAC address
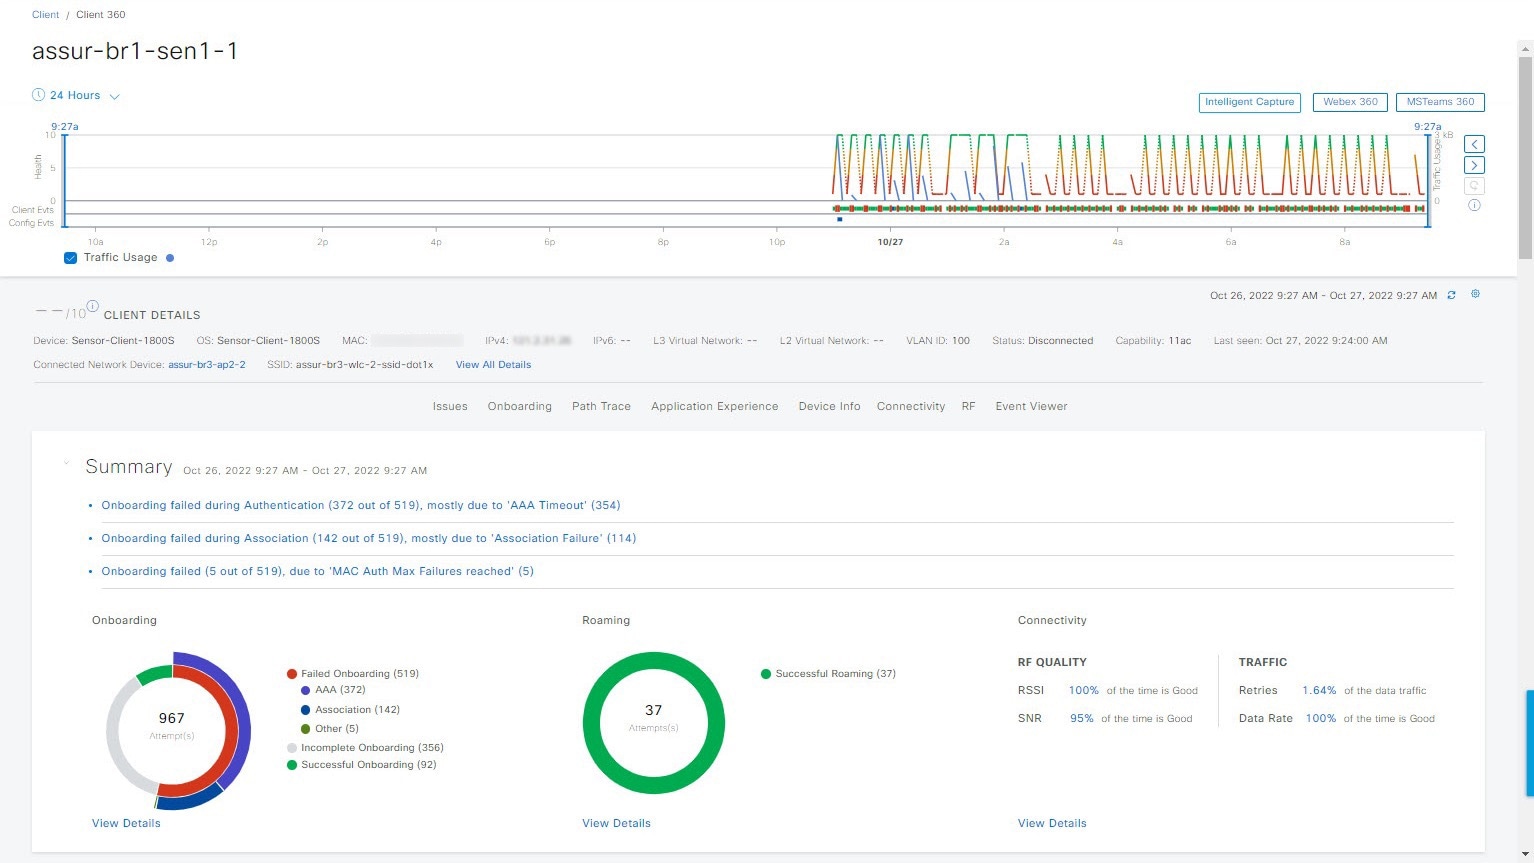
The Client 360 window displays a 360° view of the client device.
Figure 2. Client 360 window
Step 4
Click the time range setting () at the top-left corner to specify the time range of the data that you want displayed on the window:
From the drop-down menu, select a time range: 3 hours, 24 hours, or 7 days.
Specify the Start Date and time; and the End Date and time.
Click Apply.
Step 5
Click Intelligent Capture at the top-right corner of the window to view, monitor, and troubleshoot captured onboarding and data packets for a specific
client device to determine if there are potential issues that must be addressed. See Run an Onboarding Packet Capture live session for a client device.
Note
Intelligent Capture is not supported for all AP models. If Intelligent Capture is not displayed, verify that the client is connected to a supported AP model, and that the AP is assigned to a location
on the Network Health dashboard.
Step 6
Click MS Teams 360 at the top-right corner above the timeline slider to view and monitor the client MS Teams meetings.
The Application Experience for MS Teams slide-in pane is displayed.
Use the Application Experience slide-in pane for this functionality:
Search bar: You can search for meetings in the table.
Time Range filter: Click the time filter to specify a time range for the data you want to be displayed.
Client Meetings table is displayed, which contains Meeting Name, MS Teams Score, Network APM Score, Duration, Start Time, End Time, Status, Meeting Type, and Participants.
Note
Network APM score is a health score, which is calculated based on NetFlow exported from the managed network devices. For more
information regarding APM, see Supported platforms.
To select the meeting to view the meeting quality KPI data displayed below the table:
Click Audio Quality tab to display an MS Teams Score and Network APM Score. You can see the Metrics such as Packet loss, Jitter, and Media Bitrate in a graph view.
Click Video Quality tab to display an MS Teams Score and Network APM Score. You can see the Metrics such as Packet loss, Jitter, and Media Bitrate in a graph view.
Click Share Quality tab to display an MS Teams Score and Network APM Score. You can see the Metrics such as Packet loss, Jitter, and Media Bitrate in a graph view.
Step 7
Click Webex 360 at the top-right corner above the timeline slider to view, monitor the client Webex meetings. The search meeting pop-up window
appears.
Enter the email associated with the client's Webex meeting.
Click Search Meetings. The Application Experience for Webex slide-in pane is displayed.
Use the Application Experience slide-in pane for this functionality:
Search bar: You can search for meetings in the table displayed.
Time Range filter: Click time filter to specify time range for the data you want to display in the table.
Client Meetings table is displayed, which contains meeting number, meeting name, application, network duration, start time,
end time, and status.
You can select the meeting to view the meeting quality KPI data displayed below the table as horizontal bars showing Audio
quality, Video Quality and Share Quality based on application (data retrieved using Webex API) and network (data retrieved
using NetFlow) latencies. You can use the drop-down list to filter the data based on Transmitting and Receiving options to
display the application and network latency graphs related metrics such as packet loss, jitter, and so on.
Step 8
Use the timeline slider to view the health and events information about the client device over a period of time.
Use this table for timeline slider functionality.
If you want to...
Then...
View the client telemetry status
Under the timeline slider, check the Telemetry Status check box.
The telemetry status line displays in the timeline slider.
Hover your cursor over the timeline slider to view the network device telemetry status, such as Good, Fair, or Poor, in the
tool tip.
Under Client Health, click Telemetry Status to view a summary of the telemetry status in a slide-in pane.
View client traffic usage
Under the timeline slider, check the Traffic Usage check box.
The traffic usage line displays in the timeline slider.
Hover your cursor over the timeline slider to view the client usage information.
View client health and KPI details
Hover your cursor over the timeline slider to view the client health and KPI details for a 5-minute window.
Note
Each KPI with a colored circle contributes to the individual client health score.
For the Data Rate KPI, the data rate capacity of the interface or physical port is displayed. If the port has negotiated to a certain rate,
then that negotiated rate is displayed.
Display a 1-hour time period in timeline
Double-click the timeline.
The entire window is refreshed, providing updates for that hour.
Note
To display information for longer than 1 hour, manually move the timeline slider to the desired time range.
View onboarding details
Hover your cursor over the timeline slider to view the client onboarding pass or failure details.
If client onboarding passes, onboarding times, such as association and authentication, are displayed.
If client onboarding fails, the failure type and reason (including the Cisco ISE failure reason if available) are displayed.
View connectivity details
Hover your cursor over the timeline slider to view connectivity details, such as the RSSI and SNR.
View connection details
Hover your cursor over the timeline slider to view connection details, such as the IP address and status.
View major events details
Hover your cursor over the timeline slider to view the client’s major events.
Keep these details in mind.
Event data is displayed as color-coded vertical bars on the graph. Green vertical bars indicate successful events, and red
vertical bars indicate events that failed.
Each vertical bar represents 5 minutes of time. Multiple significant events can be generated during each 5-minute window.
Hover your cursor over the vertical bar to get more information about the events.
Click See Full List to go to the Event Viewer dashlet to view all major events for the client.
Step 9
View the individual client health score in the Client Details area, below the timeline.
The individual client health score is an aggregate of the client's onboarding status, RSSI, and SNR.
If you search by the user ID, the Individual Client Health score that is displayed is the minimum score of all the monitored
client devices associated with that user. For more information, see Individual Client Health score.
If you search by MAC address or IP address, the Individual Client Health score is the health score for that client device.
The color of the health score represents its severity. The health is measured on a scale of 1 to 10, with 10 being the best
score, and a score of 0 for inactive client devices, where the health data is not applicable:
: Poor client devices. Health score range is 1 to 3.
: Fair client devices. Health score range is 4 to 7.
: Good client devices. Health score range is 8 to 10.
: Inactive client devices. Health score is 0.
Note
For clients that are disconnected from the network, the score is represented as a - -.
Step 10
Use the Client Details area, below the timeline, to view this information:
For wireless clients, this area provides information about the client device such as its OS version, MAC address includes
Device MAC and RCM, IPv4 and IPv6 address, Bridge-Mode Virtual Machine, connected VLAN ID, connection status, Avg Latency,
last seen timestamp, connected network device, SSID, and last known location.
Wi-Fi 7 capable wireless clients and access points connects to any combination of 2.4GHz or 5GHz or 6 GHz bands. MLO (Multiple
Link Operational) clients by establishing connections to different bands at the same time results in higher data transfer
rate. When wireless client is connected with Wi-Fi 7 capable APs or Zealand APs, Catalyst Center supports four KPIs per link:
RSSI, SNR, special stream, and channel. For Wi-Fi 7 capable clients hover over cursor on the timeline to view the connectivity
KPIs (Channel, SNR and RSSI) operating in multiple links for a 5-minute window. But the data transfer may happen in single
link or multiple links based on the clients.
For wired clients, this area provides information about the client device such as its MAC address, IPv4 and IPv6 address,
Security Group (Tag Value), connected VLAN ID, connection status, last seen timestamp, connected network device, port, and
last known location.
For PoE-capable devices, these elements are also displayed in the client details area: IEEE Class, Negotiated Power Level, and PoE Status.
Step 11
In the Client Details area, click View All Details to open a slide-in pane with additional details about the client device.
To view client device classification information (such as device type, username, host OS, and hostname), Catalyst Center must be integrated with Cisco ISE, or Cisco AI Endpoint Analytics must be deployed and enabled in Catalyst Center.
Step 12
Use the collapsible categories to view information about issues, onboarding, event viewer, path trace, application experience,
and other details:
Summary category
Provides onboarding, roaming, and connectivity information, which includes traffic-retires and data rate, average latency
by category (video, voice, best effort, and background) for the selected client in the form of human-readable summaries and
graphs for the selected timeframe.
Click an issue in the list to display a slide-in window with details about the client's experience at the last location that
was visited. The slide-in window displays information based on the client, location, and issue.
Depending on the issue, the slide-in pane displays these details:
Location: Click the drop-down field and select a building or floor that the client visited in the last 24 hours. Details about the
client's experience at that location are displayed.
Issue radial bar chart: Summarizes the issue in a graphical chart.
Top Failure Reasons: Indicates the number of times that the client encountered the issue. For example, onboarding issues might show the number
of DHCP timeouts.
Note
For the onboarding category, you can click AAA next to the radial bar chart to view the top AAA or Cisco ISE failure reasons. The AAA failure information is from the wireless controller, and the Cisco ISE failure information is from Cisco ISE.
If you click Top ISE Failure Reasons, the Event Viewer table lists the Cisco ISE authentication event and the corresponding authentication event from the wireless controller so that data can be compared. Note that the number of failure events reported from the wireless controller and Cisco ISE may not match because of the amount of client retries from the wireless controller and the failure report throttling from Cisco ISE.
Timeline slider: The timeline slider displays periods of client failures. Click a colored segment in the radial bar chart to filter the timeline
slider based on that segment. The line above the bars in the timeline slider indicates when the network experienced the same
issue, including other clients at the selected location. APs that the client attempted to connect with are noted.
Event Viewer: Click this tab to display information about the failure.
Impact Analysis: Click this tab to display the top impacted components, for example, top AP, SSID, band, and so on. Under each component,
in parenthesis, is the number of additional clients who were impacted by the component. impact analysis tab
Correlation: Click this tab to display timeline charts of KPIs for failures that the client experienced. By default, the top three APs
where the client experienced the failure are shown, including the connected wireless controllers and switches. In addition
to the default KPIs, you can select more from the KPI drop-down list.
Issues category
Displays any issues that must be addressed. Issues are listed based on the timestamp. The most recent issue is listed first.
Click an issue to open a slide-in pane to view the corresponding details, such as the description of the issue, relevant clients that are experiencing the same
type of issue, and suggested actions.
Note
For wireless clients experiencing Cisco ISE authentication failure issues, you can do these tasks:
View the top Cisco ISE failure reasons for other clients experiencing the same type of issues from the slide-in pane in the Relevant Clients tab.
View the suggested actions to address the failure issues from the slide-in pane in the Suggested Actions tab.
From the slide-in pane, you can do these tasks:
To resolve an issue:
From the drop-down list, select Resolve.
To view the list of issues that have been resolved, click Resolved Issues.
To ignore an issue:
From the drop-down list, select Ignore.
Set the number of hours to ignore the issue on the slider.
Click Confirm.
To view the list of issues that have been ignored, click Ignored Issues.
Topology of how a client got on the network, including information about these services: AAA and DHCP.
Example of wired client topology: Client > Switch > Router
Example of wireless client topology: Client > SSID > Access Point > Wireless Controller
In the topology, you can do these tasks:
Click a node to display a slide-in window that displays information about the node.
Hover your cursor over the link ends (dots) to see the status and port details of the link. When a Wi-Fi 7 capable client
is connected to multiple bands, the band values (2.4 GHz, 5 GHz and 6 GHz) are displayed on top of the topology link.
Hover your cursor over a group of devices and click View Devices List from the pop-up to view the list of devices and their details.
In the Search field in the top-right corner of the Onboarding area, you can search for a specific device. The specific node is selected, and the corresponding information about the device
is displayed.
Event view category
For Wireless Clients: Lists scenarios and the sequence of subevents that led to each scenario. This list allows you to pinpoint during which subevent
an issue occurred.
When an issue occurs, that event is marked red; otherwise, it’s green. The Event Viewer table provides information about the
failure, such as the error message, the AP and wireless controller to which the client device is connected, and the timestamp
when the event occurred. Click an event to view details about that event in the right pane.
For Wired Clients: Lists Cisco ISE server events, switch system level syslogs, switch port or interface-specific events, and client-specific events.
Successful events are displayed as green; failure events that impact the health score are displayed as red. The Event Viewer
table provides information about the failure, such as the type of message, the device information to which the wired client
device is connected, and the timestamp when the event occurred. Click an event to view details about that event in the right
pane.
Note
To view more details about a Cisco ISE authentication failure event, click the ISE Authentication event with a red circle and view the details in the right pane. In the right pane, click Show ISE Events to view the Cisco ISE authentication steps completed by the RADIUS server. Each step includes a code number with its corresponding description,
which is collected from Cisco ISE.
Path Trace category
Click Run New Path Trace to display a network topology between a specified source device and a destination device. The topology includes the path's
direction and the devices along the path, including their IP addresses. The display also shows the protocol of the devices
along the path (Switched, STP, ECMP, Routed, Trace Route) or other source type.
Applications running on a client device with their qualitative and quantitative metrics.
To view the metrics in a chart format, click the radio button next to an application in the table. A slide-in pane opens with
the relevant information.
Click one of these tabs to display the corresponding information:
Device Info: Displays basic information about the device.
For Samsung devices, this tab displays additional information, such as build number, origin, country code, device type (mobile,
tablet, and so on), and host operating system.
For Wi-Fi 7 capable clients, the connection information displays channel and band values.
For the endpoints connected to your network, this tab displays Manufacturing details such as Hardware Manufacturer, Device Type, OS, and Endpoint Type.
This tab also displays the Tracked and Exclusion status of the device. If required, click the corresponding hyperlink to update the tracked and exclusion status of the device.
In the Track Client slide-in pane, do these steps:
Use the toggle button to configure the tracked status of the device.
If you enable the toggle button, select the required option for Tracking Expires After and Notification Frequency.
Click Save.
In the Exclude clients slide-in pane, do these steps:
Use the toggle button to configure the exclusion status of the device.
If you enable the toggle button, enter a description in the Description for Exclusion field, and check the check box next to the wireless controller for which you want to exclude the device.
Click Save.
The available security information displayed, such as the authentication type and security policy type, depends on the client
connection and if Cisco ISE is integrated with Catalyst Center.
Station information, such as the HW model, SW version, AC/DC voltage, is only available for Intel devices.
RF: Only available for wireless devices.
User Defined Network: Only available for UDN-enabled network devices. This tab displays the registered UDN, connected UDN details, device MAC
address, device owner, device name, device type, and current status.
Connectivity: Displays the respective KPI charts for Rx/Tx data rate, Tx/Rx packet count, Rx retries connection for radios, DNS request
and response count, and Tx drops (% of packet drops).
PoE: Only available for PoE-capable clients.
iOS Analytics: Only available for Apple devices.
Intel Connectivity Analytics: Only available for devices supported by Intel wireless adapters. Displays the roam events, reported errors, temporary disconnection
reports, and low RSSI reports reported by the supported client.
Understand Client Health score and KPI metrics
This section provides information about how the Client Health scores and KPI metrics are computed.
Client Health score
The Client Health score (Wireless or Wired) is the percentage of the number of healthy client devices (a health score from
8 to 10) in a target category, divided by the total number of client devices in that category. The score is calculated every
5 minutes.
For example: 90% (health score) = 90 (client devices in a target category with health score from 8 to 10) ÷ 100 (total number
of client devices in that category)
The Individual Client Health score is the sum of the Client Onboarding score and the Client Connectivity score. The client
health score ranges from 1 to 10, with a score of 0 for inactive clients. It is calculated accordingly:
Wired Client: Link to first switch is up, authentication and authorization is successful and IP address is received. Client score is 10.
Wireless Client: Client joined the network and has good connection in terms of the RSSI and SNR KPIs.
Client Onboarding score
The Client Onboarding score indicates the experience of a client device while connecting to the network.
If a client connects to the network successfully, the score is 4.
If a client failed to connect to the network, the score is 1.
If a client is idle, the score is 0.
The Client Onboarding score is calculated accordingly:
Wired Client: Link to the first switch is up, authentication and authorization is successful, and IP address is received.
Wireless Client: Client Onboarding score range is from 1 to 4. When the client connects to the network successfully, the score is 4. If the
client failed to connect to the network, the score is 1.
Client Connectivity score
The Client Connectivity score indicates the experience of the client device after the device is connected to the network. The score is calculated accordingly:
Wired Client: Connectivity score can be 2 or 6. Link errors determine the Connectivity score and the resulting Overall Health score accordingly:
If a client onboards successfully but has link errors, the Connectivity score is 2 and the Overall Health score is 6.
If the client onboards successfully and there are no link errors between the client and the first-hop switch, the Connectivity
score is 6 and the Overall Health score is 10.
Wireless Client: Connectivity score can be 0, 4, or 10. The RSSI and SNR range determines the Connectivity score and the resulting Overall
Health score is calculated as the weighted average of the RSSI-driven Connectivity score and the SNR-driven Connectivity score.
RSSI-driven connectivity score
Client's RSSI
RSSI-driven connectivity score
If RSSI is less than or equal -72 dBm.
The client receives a RSSI-driven connectivity score of 4 and is considered to be in fair health.
If RSSI is greater to -72 dBm.
The client receives a RSSI-driven connectivity score of 10 and is considered to be in good health.
SNR-driven connectivity score
Client's SNR
SNR-driven connectivity score
If SNR is less than or equal to 9.
The client receives a SNR-driven connectivity score of 4 and is considered to be in fair health.
If SNR is greater than 9.
The client receives a SNR-driven connectivity score of 10 and is considered to be in good health.
Individual Client Health score
The Individual Client Health score is the sum of the Client Onboarding score and the Client Connectivity score. The Client
Health score ranges from 1 to 10, with a score of 0 for inactive clients. It is calculated accordingly:
Wired Client: Link to first switch is up, authentication and authorization is successful, and IP address is received. Client score is
10.
Wireless Client: Client joined the network and has good connection in terms of RSSI and SNR KPIs.
Client's onboarding and connectivity
Resulting Client Health score
If the client failed onboarding.
The client receives a health score of 1 and is considered to be in poor health.
If the client's RSSI and SNR are below threshold.
The client receives a health score of 4 and is considered to be in fair health.
If either the client's RSSI or SNR is below threshold.
The client receives a health score of 7 and is considered to be in fair health.
If the client's RSSI and SNR is above threshold.
The client receives a health score of 10 and is considered to be in good health.


 to select an area/site or building from the left hierarchy tree pane. You can also click down arrow from global to navigate
to its associated area, site, and building.
to select an area/site or building from the left hierarchy tree pane. You can also click down arrow from global to navigate
to its associated area, site, and building.
 to hide the Sites table.
 : Click this toggle button and use the drop-down list to view the percentage of healthy clients in a table format for a site
or building. Click
: Click this toggle button and use the drop-down list to view the percentage of healthy clients in a table format for a site
or building. Click  : Click this toggle button to display the health of all the client sites on a geographic location-oriented client health map.
By default, the client sites are color coded according to the severity of the problem.
: Click this toggle button to display the health of all the client sites on a geographic location-oriented client health map.
By default, the client sites are color coded according to the severity of the problem.
 for a site or building to display data only for that location on the
 ) icon.
 ) icon.
 : Poor client devices. Health score range is 1 to 3.
 : Fair client devices. Health score range is 4 to 7.
 : Good client devices. Health score range is 8 to 10.
 : Inactive client devices. Health score is 0.
 Feedback